Food and Nutrition Sciences
Vol. 4 No. 10 (2013) , Article ID: 37230 , 9 pages DOI:10.4236/fns.2013.410138
Virgin Olive Oil Acceptability in Emerging Olive Oil-Producing Countries
![]()
Sensory Evaluation Laboratory, Food Science and Technology Department, School of Chemistry, Universidad de la República, Montevideo, Uruguay.
Email: agambaro@fq.edu.uy
Copyright © 2013 Adriana Gámbaro et al. This is an open access article distributed under the Creative Commons Attribution License, which permits unrestricted use, distribution, and reproduction in any medium, provided the original work is properly cited.
Received July 19th, 2013; revised August 19th, 2013; accepted August 26th, 2013
Keywords: Olive Oil; Consumer Study; Olive Oil Quality
ABSTRACT
A sample of 99 habitual consumers sensory-evaluated 2 extra virgin and 2 ordinary olive oils in terms of overall liking and willingness to purchase based on 9-point structured scales and responded to a check-all-that-apply question comprising a list of 18 positive and negative attributes. In the second session, the same consumers evaluated the same oils also based on their respective commercial specifications and sensory profiles previously prepared by a panel of 9 trained tasters. Two consumer clusters with contrasting behavior were identified. Whereas 52% of respondents gave high overall liking scores to the extra virgin oils and scores below commercially acceptable limits to those of ordinary virgin quality, 48% gave low overall liking scores to the extra virgin oils and high overall liking scores to those oils that were defective. Consumers of neither cluster were influenced by the information made available in Session 2. Although a slight majority of consumers described the oils consistently with the sensory profiles available from the tasting panel, an alarmingly large number of respondents described the two extra virgin oils in terms of defective, bad-tasting, strange-tasting, poor quality and rancid, and those oils that were defective in terms of good quality, tasty, sweet, aromatic, mild-flavored, delicious and fresh. These results highlight the need for the implementation of relevant consumer sensitization programs in emerging olive-producing countries like Uruguay, where virgin olive oils of varied quality are locally available.
1. Introduction
A typical component of the Mediterranean diet, olive oil has only recently reached significant consumption levels in countries outside Europe, like Uruguay. In recent years, Uruguay’s olive oil production has increased markedly and national brands have emerged on the local market, consistently with a two-fold increase (from 0.2 L to 0.4 L) in average per-capita consumption between 2006 and 2012 [1].
Uruguayan consumers perceive olive oil differently from the rest of locally available edible vegetal oils, describing it as an expensive high-quality gourmet oil associated with beneficial health effects and evoking positive feelings [2]. In other countries where olive growing is a new activity, as is the case with the USA, the health benefits and the flavor associated with olive oil have been reported to be primary drivers of consumption [3].
The quality of olive oil can be defined from a commercial, nutritional or sensory standpoint [4]. The nutritional value of olive oil is associated with its high oleic acid content and the presence of minor components, such as phenolic compounds, while its flavor is strongly influenced by the presence of volatiles [5]. The sensory profile of an olive oil will vary according to olive variety, soil characteristics, climate, tree health, fruit maturity at the time of harvest, olive collection process, olive storage conditions, oil extraction process, olive oil storage method prior to packaging, packaging means and preservation method and/or additives [6,7].
The sensory quality of virgin olive oil may be quantified by evaluating the sensations defined by smell, aroma and taste, in addition to pungent and astringent mouth sensations. Healthy olives introduce positive attributes (fruity, bitter and pungent) in an oil, whereas the processes occurring after harvest tend to lessen the intensity of such attributes and induce the appearance of defects, i.e., negative attributes that are to the detriment of product quality [8].
According to the International Olive Council (IOC), commercial grading of olive oil is based on physicochemical and sensory analyses [9]. According to the results of sensory analysis, olive oils are classified on a 10-point scale as extra virgin (the median of defects is 0 and the median of the fruity attribute is greater than 0), virgin (the median of defects is greater than 0 but no greater than 3.5 and the median of the fruity attribute is greater than 0), ordinary virgin (the median of the defects is greater than 3.5 but no greater than 6.0, or the median of the defects is no greater than 3.5 and the median of the fruity attribute is 0) and lampante virgin (the median of the defects is greater than 6.0). Olive oils classified as lampante virgin cannot be sold and must be refined, losing their virgin quality [10].
Markedly defective olive oils (between 3 and 6 on the IOC scale), classified as “ordinary virgin” are available on non-Mediterranean markets where consumers lack the necessary knowledge to perceive olive oils defects and have become accustomed to consuming them. On the other hand, individual beliefs and attitudes towards foods depend on a number of factors, including cultural traditions, education and culinary habits, and may be modified by means of information [11].
Based on a sample of habitual olive oil consumers, this paper addresses the acceptability of and willingness to virgin olive oil purchase according to commercial grade. The influence of consumer acquaintance with the sensory profile and commercial grade of a virgin olive oil on its overall liking and willingness to purchase ratings was also studied.
2. Material and Methods
2.1. Sample Characterization
Four locally available virgin olive oils of different quality were used for this research: 2 labeled as extra virgin oils (A and B), and 2 labeled as ordinary virgin oils (C and D).
The commercial quality of the above oils was confirmed and a panel of 9 tasters recruited and trained according to IOC standards [12], analyzed the oils and produced a descriptive profile. The oils were evaluated in duplicate over two consecutive work sessions. In order to minimize the possibility of systematic error, oil samples were presented on a random basis.
15 mL of oil were poured into blue-colored tasting glasses [13] in order to exclude the visual factor. Oil samples coded with 3-digit random numbers were presented at 28˚C ± 2˚C and rated on 10-cm unstructured scales according to each of the following positive and negative attributes: fruity (green/ripe notes), bitter, pungent, green (grassy/leafy), fig leaf notes, tomato notes (plant-, leaf-, fruit-flavored), apple notes, banana notes, almond/nut notes, sweet, and astringent, among other positive attributes; and fusty/muddy sediment, musty/ humid/earthy, winey/vinegary/acid/sour, frostbitten olives (wet wood-tasting), and rancid, among other negative attributes. Evaluations were conducted in a tasting room with 5 individual cabins furnished with temperature control (22˚C to 24˚C) and ventilation [14].
2.2. Consumer Test
The study was conducted in the city of Montevideo, Uruguay. A total of 99 habitual consumers of olive oil (defined as consuming olive oil every day or several times a week) were randomly recruited at shopping areas, universities, restaurants and other public places. The sample included 49 female (49.5%) and 50 male (50.5%) participants, ranging in age from 18 to 62. Taking into account the areas where the participants were recruited, the sample was assumed to represent the general Uruguayan middle income groups.
Participants were initially (Session 1) presented with the 4 samples of olive oil in monadic sequential fashion. The samples were served at room temperature in white plastic containers coded with three random digits. Sliced white bread was used as tasting vehicle and mineral water, natural yogurt and green apples as palate cleansers. The 4 oil samples were presented in a balanced order.
Participants were asked to taste each olive oil sample and rate them in terms of overall liking and willingness to purchase using 9-point structured hedonic scales ranging from extreme dislike to extreme liking and from definite unwillingness to definite willingness, respectively. No information regarding the commercial grade of the tasted oils was made available at this stage.
The test was completed with a check-all-that-apply (CATA) question consisting of a list of 18 terms or attributes selected on the basis of previous work [2] and the results of the evaluation by the trained tasting panel, as follows: tasty, aromatic, bitter, pungent, fruity, grassy/leafy, strange-tasting, fresh, bad-tasting, strongflavored, mild-flavored, sweet, delicious, rancid, defective, good quality, poor quality and cooked-olive smell.
At the end of Session 1, consumers responded to a brief survey of sociodemographic data (gender, age, marital status, number of persons and number of children in the household, and education level) and olive oil consuming habits.
After a minimum 30-min break, consumers were again (Session 2) presented with the 4 olive oil samples in monadic sequential fashion accompanied by a written description of the sensory profile of each oil. The description was based on the information provided by the panel of sensory tasters and that available from the product label. Samples bore the same codes as in Session 1 with a view to assessing the influence of the availability of sensory descriptions on the overall liking and willingness to purchase scores for each oil.
Consumers were finally asked to rate each oil sample in terms of overall liking and willingness to purchase using the same scales as used in Session 1.
The tests were carried out in a sensory laboratory designed in compliance with ISO 8589 [15].
2.3. Data Analysis
Data comprising the sensory profiles of the studied olive oils was subjected to an analysis of variance (ANOVA) considering the different oil types, the tasters, and the interaction between the two as fixed sources of variation. Where differences were significant, honestly significant differences were determined based on the Tukey test (p < 0.05).
2.4. Cluster Analysis Based on Overall Linking
Hierarchical cluster analysis of overall liking data from Session 1 enabled the identification of consumer groups according to overall attitude towards the tested products. The formation of clusters was based on Ward’s aggregation criterion and the calculation of Euclidean distances between data points. The chi-square test was used to determine differences in gender, age and education frequency distributions between clusters.
Finally, an ANOVA was conducted on the overall liking and willingness to purchase data, considering description availability, oil sample and cluster, as well as combinations of two of the three, as factors. Mean ratings and honestly significant differences were determined based on the Tukey test (p ≤ 0.05).
2.5. Analysis of CATA Question Data
For each term in the CATA question, frequency of mention was determined by counting the number of consumers that used that term to describe each oil sample. Cochran’s Q test was carried out for each of the 18 terms, considering oil sample and consumer as sources of variation to evaluate if the CATA question was able to detect differences in consumers’ perception of the tested oils. Cochran’s Q test is a nonparametric test used for the analysis of two-way randomized block designs to determine whether k treatments have identical effects when the response variable is binary.
Multiple factor analysis (MFA) is a factor analysis method dealing with data sets composed of both quantitative variables and frequency tables [16]. Multiple factor analysis (MFA) was based on the frequencies of mention from the results of the CATA question and the ratings provided by the tasting panel as active variables, and overall liking as supplementary variable, in order to identify relationships between the terms and the oil samples and to generate a sensory map of the oil samples [17]. All statistical analyses were performed using XLStat 2011 software (Addinsoft, NY) and R language (R Development Core Team, 2007).
3. Result
3.1. Olive Oil Sensory Profiles
Whereas the IOC relies on the medians (Me) of positive attributes and defects, mean ratings associated with the studied oils and the results of the analysis of variance are shown in Table 1. Significant differences (p < 0.05) among the four olive oils were identified by consumers in terms of fusty/muddy sediment, musty/humid/earthy, winey/vinegary and rancid, other negative attributes, and fruity, bitter, pungent, green (grassy/leafy notes), tomato, banana and almond/nut notes, other fruity attributes, sweet and astringent.
3.2. Consumer Study
The information provided by the sensory panel and that contained on the product labels was used to generate the
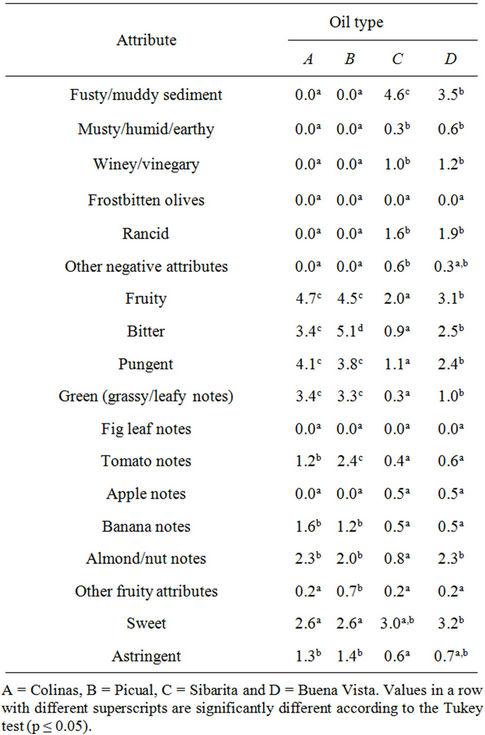
Table 1. Olive oil sensory profiles.
following descriptions, which were presented to the consumers at the time of oil tasting in Session 2 of the consumer study.
Sample A: Bi-varietal blend of Arbequina and Coratina olives, of extra virgin quality. It has a green fruitiness of medium intensity, with green cut grass and leafy notes. Green banana and nut flavors are also present. When tasted, it is slightly sweet, with medium bitterness and persistent pungency. This profile is consistent with that of a well-balanced oil of good quality.
Sample B: Picual extra virgin olive oil. It has medium intensity fruitiness, between green and ripe, with tomato, banana and dried fruit (almond and nut) notes. When tasted it is slightly sweet, with medium to intense bitterness and medium pungency. This profile is consistent with that of a good quality oil.
Sample C: An oil with only slight fruitiness and almost imperceptible bitterness and pungency. It has several defects, such as fusty/muddy sediment (cooked-olive smell, glue, nail polish, cheese rind, garbage can), winey (vinegar) and rancid attributes.
Sample D: An oil with slight ripe fruitiness and slight bitterness and pungency. It has several defects, such as musty/humid/earthy, fusty/muddy sediment (cookedolive smell, glue, nail polish, cheese rind, garbage can), winey (vinegar) and rancid attributes.
3.3. Cluster Analysis
Hierarchical cluster analysis of overall liking data from Session 1 led to the identification of Clusters 1 and 2, composed of 51 and 48 consumers (51.5% and 48.5% of the consumer sample), respectively. Mean overall liking scores according to cluster are shown in Table 2.
Cluster 1 consumers assigned highly significantly different (p < 0.001) scores to extra virgin olive oils (oils A and B) and virgin olive oils of ordinary quality (oils C and D), as shown in Table 2. Considering a minimum rating of 6 on a 9-point hedonic scale as the lowest acceptable score in appraising a product’s commercialization potential [18], Cluster 1 consumers awarded high
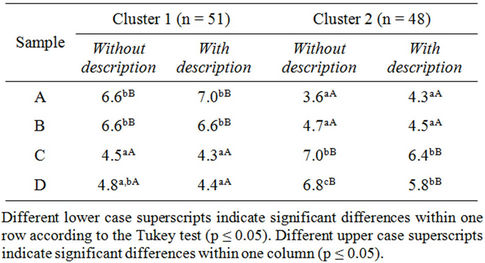
Table 2. Mean overall liking scores evaluated on a 9-point hedonic scale according to cluster.
overall liking scores to the extra virgin olive oils and scores below the commercially acceptable limit to those of ordinary virgin quality. These consumers were capable of identifying the quality of the tasted oils and readily differentiating defective, ordinary virgin olive oils from non-defective, extra virgin ones.
Although highly significant differences (p < 0.001) were also found in the scores assigned to the oils by Cluster 2 consumers, the group’s behavior was in contrast to that of Cluster 1, since the overall liking of extra virgin oils was rated low and that of defective oils was rated high by Cluster 2 consumers.
Except for the evaluation made of oil D by Cluster 2 individuals, consumers in neither cluster were influenced by the sensory description of the oil made available in Session 2. Overall, the sensory profiles of the different oils made available in Session 2 were used by consumers to confirm their initial evaluations made in Session 1 without the profiles. This behavior was expected only for Cluster 1 consumers, as they had been able to discern the quality of the different oils.
Informed descriptions of the good or defective quality of the oil samples, except for oil D, did not affect overall liking ratings for Cluster 2 consumers. Consumer acquaintance the defects of oil D significantly lowered the overall liking scores for this oil among Cluster 2 individuals. Nonetheless, providing Cluster 2 consumers with a written description of the defects of oil D did not influence the behavior of these individuals to an extent such that it led to a reduction in the overall liking of this oil to a value lower than that assigned by these consumers to the extra virgin oils (oils A and B). Members of Cluster 2, amounting to ca. 50% of the consumer sample, did not change their initial assessment of the different oils based on newly available knowledge of their extra virgin or defective quality, reaffirming the preference of these consumers for defective oils and their rejection of extra virgin, higher quality oils.
Table 3 shows willingness to purchase scores for each of the two clusters identified.

Table 3. Mean willingness to purchase scores evaluated on a 9-point scale according to cluster.
It can be noted from Table 3 that willingness to purchase scores followed a similar trend to that of overall liking. Willingness to purchase changed significantly between Sessions 1 and 2 only for sample D; yet its willingness to purchase remained significantly above that of the extra virgin oils (samples A and B).
Clusters 1 and 2 were did not differ significantly (p < 0.05) for any of the socioeconomic variables surveyed. There was a significant difference (p = 0.031) in the brand of olive oil habitually consumed by either cluster. In Cluster 1, there was a large proportion (28%) of habitual consumers of extra virgin olive oil brands of recognized quality, compared to 10% of consumers of these brands in Cluster 2. This highlights the effect of consumption habits on food product acceptability and willingness to purchase, as Cluster 2 consumers, most of whom were not habitual consumers of good quality olive oil brands, preferred defective olive oils and appeared reluctant to change this preference based on newly available knowledge that the tasted oils had several sensory defects and were not of extra virgin quality.
3.4. Check-All-That-Apply-Question
Tables 4 and 5 show the frequency of mention for each of the terms of the CATA question according to consumer cluster.
With both clusters, the most frequently used terms were mild-flavored, aromatic, good quality, tasty and strong-flavored, whereas delicious, sweet, defective, badtasting and rancid had the lowest frequencies of mention.
Frequencies of mention provided by Cluster 1 to 13 of the 18 terms included in the CATA question differed significantly according to oil type. No significant differences were found for the terms bitter, fruity and sweet, although these attributes had been rated differently according to oil by the tasting panel (see Table 1). This shows that these consumers were unable to evaluate and discriminate olive oil quality based on these three attributes. No significant differences were found among the frequencies of mention of the terms delicious and strange-tasting. The low frequency of mention of delicious among Cluster 1 consumers may indicate that olive oil in itself is not associated with pleasurable sensations,

Table 4. Results of the check-all-that-apply question for Cluster 1: frequency of mention by attribute and by sample.
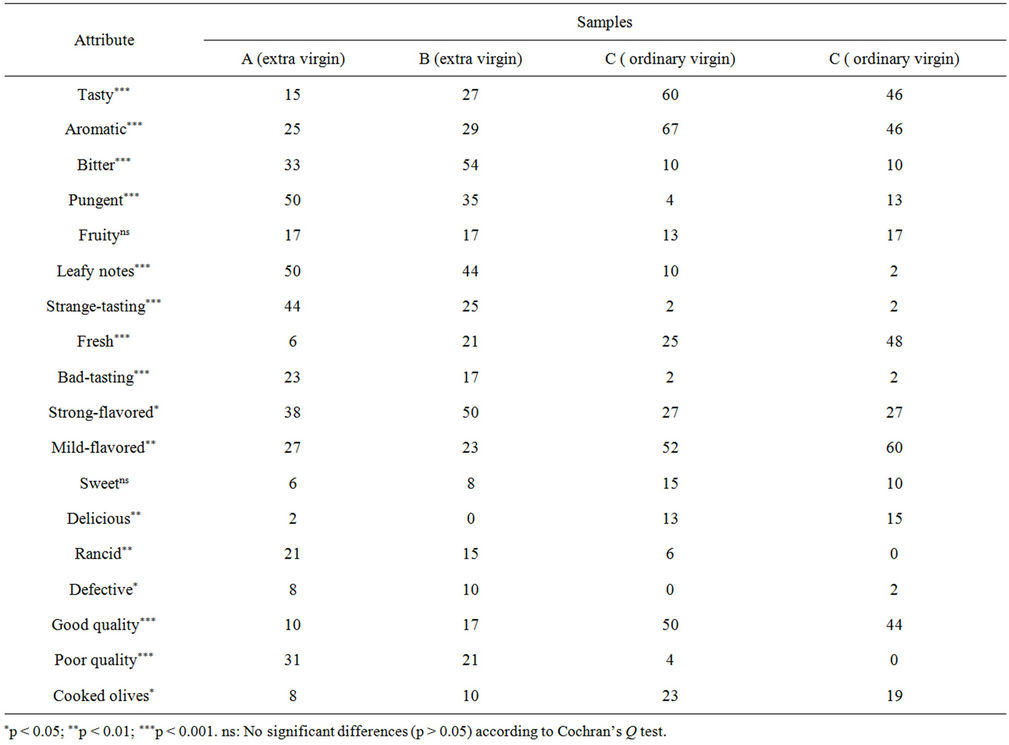
Table 5. Results of the check-all-that-apply question for Cluster 2: frequency of mention by attribute and by sample.
a possibility also consistent with the overall liking scores assigned to the oils, which were in no case greater than 7 on the 9-point hedonic scale (Table 2).
As shown in Table 4, Cluster 1 consumers described the extra virgin oils (A and B) in terms of aromatic, tasty, pungent, leafy notes and good quality. In particular, oil A was described as strong-flavored, in contrast with the mild-flavored attribute used by these consumers to describe oil B.
The two ordinary virgin oils (C and D) were described by Cluster 1 mainly in terms of bad-tasting, mild-flavored, rancid, defective, cooked-olive smell and poor quality. This shows that members of this cluster were readily able to identify those oils that had defects and relate such defects to overall product quality.
In Cluster 2, the frequencies of mention of 16 out of the 18 terms in the CATA questions differed significantly according to oil, showing that these consumers resorted to a greater number of terms to differentiate the oils. As was also the case with Cluster 1 consumers, no significant differences among the different oils were identified by Cluster 2 consumers in terms of fruity and sweet, presumably due to the lack of the sensory training required to be able to rate these attributes.
There was considerable ignorance of olive oil quality facts among Cluster 2 consumers, who made negative appraisals of the positive attributes characteristic of extra virgin olive oil—i.e., these consumers described the bitter, pungent, and green grassy/leafy attributes of extra virgin olive oils A and B in terms of defective, bad-tasting, strange-tasting, poor quality and rancid. Conversely, they associated the cooked-olive smell typical of the fusty/muddy sediment defect of ordinary olive oils with good quality, tasty, sweet and aromatic attributes, which, in addition to mild-flavored, delicious and fresh, were used to describe oils C and D.
Among the factors key to the acceptability extra virgin olive oil are its bitterness and pungency (or spiciness). Australian olive oil producers consider these two attributes to be major determinants of an olive oil’s profile [19] and Italian consumers perceive bitterness and pungency as the most appropriate sensory descriptors of an olive oil’s extra virgin quality [20]. On the other hand, several authors have reported that the greater an olive oil’s bitterness, the less consumers in emerging markets appear to like it [21-23], suggesting that such consumers have not been exposed to the product in sufficient degree to have developed an appreciation of the bitterness and pungency attributes of quality virgin olive oils [24]. In contrast with the above findings, a considerable proportion of the consumer sample (Cluster 1) were capable of appreciating the attributes of quality virgin olive oil by assigning high overall liking scores to oils A and B.
MFA was carried out based on CATA counts for both consumer clusters. The first two dimensions of the MFA accounted for 84.3% of the variance of the experimental data, representing 53.7% and 30.6% of the variance, respectively.
As shown in Figure 1(a), there was a strong correlation between the evaluations made by the two clusters
 (a)
(a)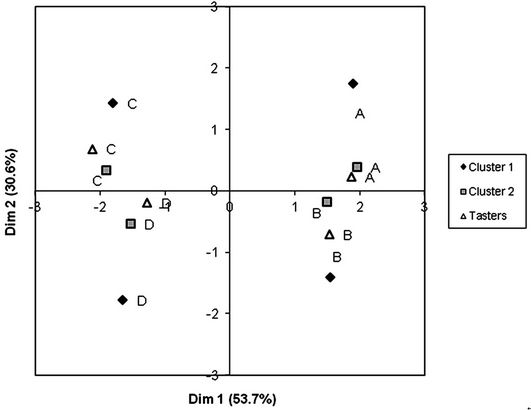 (b)
(b)
Figure 1. (a) Multiple factor analysis based on the check-all-that-apply question. Representation of attributes for Cluster 1 (black trapezoid and italic type), Cluster 2 (grey squares) and for the tasting panel (unfilled triangles and bold type; (b) Multiple factor analysis based on the check-all-that-apply question. Representation of oil samples.
with regard to most of the terms included in the CATA question, suggesting that the two clusters, despite their contrasting preference patterns, perceived the sensory attributes of the different oils similarly. Frequency of mention of pungency, bitter and cooked-olive smell correlated strongly between clusters, suggesting that the different oils were evaluated similarly by all consumers.
Also a strong correlation was found between otherwise contradictory appraisals—e.g., good quality and poor quality—made by consumers in either cluster, showing the different preconception of the sensory attributes of high quality olive oil; hence, the different preference patterns observed between consumer clusters.
The green (grassy/leafy notes) attribute assigned by the sensory tasters was associated with the terms fresh and leafy notes by Cluster 1 consumers, demonstrating the correct appreciation of the quality traits of extra virgin olive oil among members of this cluster. This is also confirmed by the strong correlation observed between the frequency of reference to good quality among Cluster 1 consumers and the ratings for the fruity, pungent, bitter and astringent attributes—i.e., those attributes typical of quality, extra virgin olive oil—provided by the sensory panel.
Likewise, the fusty/muddy sediment, rancid and winey defects identified by the tasting panel correlated strongly with the frequency of mention of rancid, poor quality, bad-tasting and cooked-olive smell among Cluster 1 consumers, and with that of good quality, sweet, aromatic, tasty, delicious and cooked-olive smell among Cluster 2 consumers.
The term cooked-olive smell is a sensory attribute associated with the fusty/muddy sediment defect, a characteristic flavor of oil obtained from olives that have been piled or stored in conditions such as to have undergone anaerobic fermentation to an advanced stage. It is worth noting that consumers were equally able to perceive this smell irrespective of cluster, although the smell was associated with poor quality in the case of Cluster 1 consumers and with good quality in the case of Cluster 2 consumers, who described the defective oils as aromatic. These results suggest that the two clusters had different drivers of liking, reflected in the difference in their preference patterns.
Figure 1(b) shows the representation of the studied oils in the MFA dimensions. It shows the coincidence in the spatial distribution of the oils among the panel of tasters and the two consumer Clusters. The first dimension separates the oils according to commercial quality, with the extra virgin oils on the right and the ordinary virgin oils on the left.
4. Conclusion
The results of this study indicate that a large proportion of consumers in Uruguay, an emerging olive-growing country, are unacquainted with the sensory traits of extra virgin olive oil, and clearly prefer defective, ordinary virgin olive oils, highlighting the need to sensitize consumers in this category.
REFERENCES
- URUGUAY XXI, Sector Olivícola en Uruguay, “Promoción de Inversiones y Exportaciones,” Presidencia de la República Oriental del Uruguay, 2012, p. 5.
- A. Gámbaro, C. Dauber, G. Ares and A. C. Ellis, “Studying Uruguayan Consumers’ Perception of Vegetables Oils Using Word Association,” Brazilian Journal of Food Technology, Special Issue, 2011, pp. 131-139.
- M. Santosa, “Analysis of Sensory and Non-Sensory Factors Mitigating Consumer Behavior: A Case Study with Extra Virgin Olive Oil,” Ph.D. Dissertation, Food Science: University of California, Davis, 2010.
- R. M. Duran, “Relationship between the Composition and Ripening of the Olive and the Quality of the Oil,” ActaHorticulturae, Vol. 286, 2010, pp. 441-451.
- F. Angerosa, “Influence of Volatile Compounds on Virgin Olive Oil Quality Evaluated by Analytical Approaches and Sensor Panels,” European Journal of Lipid Science and Technology, Vol. 104, No. 9-10, 2002, pp. 639-660. http://dx.doi.org/10.1002/1438-9312(200210)104:9/10<639::AID-EJLT639>3.0.CO;2-U
- R. Aparicio and J. Harwood, “Manual del Aceite de Oliva,” AMV Ediciones, Mundiprensa, España, 2003.
- M. Uceda, M. P. Aguilera and I. Mazzuchelli, “Manual de Cata y Maridaje del Aceite de Oliva,” Editorial Almuzara, Córdoba, 2010.
- A. Romero, J. Tous and L. Guerrero, “El Análisis Sensorial del Aceite de Oliva Virgen,” In: J. Sancho, E. Bota and J. J. de Castro, Eds., Introducción al Análisis Sensorial de los Alimentos, Edicions Universitat de Barcelona, Barcelona, 1999, pp. 183-197.
- IOC, “Trade Standard Applying to Olive Oils and OlivePomace Oils,” International Olive Council, COI/T.15/NC no.3/Rev.4, 2009.
- IOC, “Sensory Analysis of Olive Oil. Method for the Organoleptic Assessment of Virgin Olive Oil,” International Olive Council, COI/T.20/Doc.No.15/Rev.4, 2011.
- S. Issanchou, “Sensory and Hedonic Consumer Expectations towards Typical Food Products,” European Conference on Sensory Science of Food and Beverages, Florence, 26-29 September 2004.
- IOC, “Sensory Analysis of Olive Oil. Standard. Guide for the Selection, Training and Monitoring of Skilled Virgin Olive Oil Tasters,” International Olive Council, COI/T.20/ Doc.No.14/Rev.2, 2007.
- IOC, “Sensory Analysis of Olive Oil,” Standard Glass for Oil Tasting, 1987.
- International Olive Council, COI/T.20/Doc.No.5.
- IOC, “Sensory Analysis of Olive Oil. Standard. Guide for the Installation of a Test Room,” International Olive Council, COI/T.20/Doc.No.6/Rev.1, 2007.
- ISO, “Sensory Analysis: General Guidance for the Design of Test Rooms, ISO 8589,” International Organization for Standardization, Geneve, 1988.
- M. Bècue-Bertaut and J. Pagès, “Multiple Factor Analysis and Clustering of a Mixture of Quantitative, Categorical and Frequency Data,” Computational Statistics & Data Analysis, Vol. 52, No. 6, 2008, pp. 3255-3268. http://dx.doi.org/10.1016/j.csda.2007.09.023
- M. Bécue-Bertaut, R. Alvarez-Esteban and J. Pagés, “Ratings of Products through Scores and Free-Text Assertions: Comparing and Combining Both,” Food Quality and Preference, Vol. 19, 2008, pp. 122-134. http://dx.doi.org/10.1016/j.foodqual.2007.07.006
- A. M. Muñoz, V. G. Civille and B. T. Carr, “Sensory Evaluation in Quality Control,” Van Mostrand Reinhold, New York, 1992.
- R. Gawel and D. A. G. Rogers, “The Relationship between Total Phenol Concentration and the Perceived Style of Extra Virgin Olive Oil,” Grasas y Aceites, Vol. 60, No. 2, 2009, pp. 134-138. http://dx.doi.org/10.3989/gya.2009.086008
- G. Caporale, S. Policastro, A. Carlucci and E. Monteleone, “Consumer Expectations for Sensory Properties in Virgin Olive Oils,” Food Quality and Preference, Vol. 17, No. 1, 2006, pp. 116-125. http://dx.doi.org/10.1016/j.foodqual.2005.07.011
- G. Caporale, S. Policastro and E. Monteleone, “Bitterness Enhancement Induced by Cut Grass Odorant (cis-3-hexen- 1-ol) in a Model Olive Oil,” Food Quality and Preference, Vol. 15, No. 3, 2004, pp. 219-227. http://dx.doi.org/10.1016/S0950-3293(03)00061-2
- J. M. Garcıa, K. Yousfi, R. Mateos, M. Olmo and A. Cert, “Reduction of Oil Bitterness by Heating of Olive (Olea europea),” Journal of Agricultural Food Chemistry, Vol. 49, 2001, pp. 4231-4235. http://dx.doi.org/10.1021/jf001302n
- C. Delgado and J. X. Guinard, “How Do Consumer Hedonic Ratings for Extra Virgin Olive Oil Relate to Quality Ratings by Experts and Descriptive Analysis Ratings?” Food Quality and Preference, Vol. 22, No. 2, 2011, pp. 213-225. http://dx.doi.org/10.1016/j.foodqual.2010.10.004
- A. Recchia, E. Monteleone and H. Tuorila, “Responses to Extra Virgin Olive Oils in Consumers with Varying Commitment to Oils,” Food Quality and Preference, Vol. 24, No. 1, 2012, pp. 153-161. http://dx.doi.org/10.1016/j.foodqual.2011.10.009