Advances in Remote Sensing
Vol.2 No.4(2013), Article ID:41262,13 pages DOI:10.4236/ars.2013.24040
Soil Salinity Mapping and Monitoring in Arid and Semi-Arid Regions Using Remote Sensing Technology: A Review
School of Environmental and Rural Science, University of New England, Armidale, Australia
Email: aallbed@une.edu.au, lkumar@une.edu.au
Copyright © 2013 Amal Allbed, Lalit Kumar. This is an open access article distributed under the Creative Commons Attribution License, which permits unrestricted use, distribution, and reproduction in any medium, provided the original work is properly cited.
Received September 16, 2013; revised October 16, 2013; accepted October 23, 2013
Keywords: Soil Salinity; Remote Sensing; Halophytic Plant; Salinity Index
ABSTRACT
Soil salinity is a serious environmental problem especially in arid and semiarid areas. It either occurs naturally or is human-induced. High levels of soil salinity negatively affect crop growth and productivity leading land degradation ultimately. Thus, it is important to monitor and map soil salinity at an early stage to enact effective soil reclamation program that helps lessen or prevent future increase in soil salinity. Remote sensing has outperformed the traditional method for assessing soil salinity offering more informative and professional rapid assessment techniques for monitoring and mapping soil salinity. Soil salinity can be identified from remote sensing data obtained by different sensors by way of direct indicators that refer to salt features that are visible at the soil surface as well as indirect indicators such as the presence of halophytic plant and assessing the performance level of salt-tolerant crops. The purposes of this paper are to 1) discuss some soil salinity indicators; 2) review the satellite sensors and methods used for remote monitoring, detecting and mapping of soil salinity, particularly in arid and semi-arid regions; 3) review various spectral vegetation and salinity indices that have been developed and proposed for soil salinity detection and mapping, with an emphasis on soil salinity mapping and assessment in arid and semi-arid regions; and 4) highlight the most important issues limiting the use of remote sensing for soil salinity mapping, particularly in arid and semi-arid regions.
1. Introduction
According to the US Salinity Staff Laboratory, soils with conductivity of the saturation extract (EC) > 4 deciSiemens per meter (dS/m) at 25˚C, Exchangeable Sodium Percentage (ESP) < 15 and pH (soil reaction) < 8.5 are referred to saline soils [1]. Salt in the soil mostly derives from the weathering of rocks and primary minerals, which formed in situ or transported by water or wind [2]. Other causes of soil salinity are topography, irrigation and dryland salinity, which occur due to forest clearance, overgrazing, and cutting bushes that cause water-tables to rise and bring saline groundwater close to the land surface. Thus, soil salinity categories are either primary salinity which is naturally occurring or secondary salinity which is human-induced.
Soil salinity is a prevalent environmental hazard in arid and semiarid regions around the world [3]. The United Nations Food and Agriculture Organization (FAO) has estimated that saline soil covered 397 million hectares of the total land area of the world [4]. Africa, Asia, Australia, Europe, Latin America, Near East and North America are the most affected areas [4]. According to the most recent estimates from a survey of farmers, about 2 million hectares and 20,000 farms across Australia alone showed some signs of salinity [5]. A recent study conducted by McFarlane et al. [6] has estimated that, in Western Australia alone, secondary salinity covers about 10% of the land, and could reach 23% if action is not taken to stop its spread.
Soil salinity adversely affects plant growth, crop production, soil and water quality, and it eventually results in soil erosion and land degradation [7-9]. Soil salinity impacts are not limited only to the environment but also extend to the economy. For instance, the economic losses due to secondary salinisation in Batinah region in Oman have been estimated at US$ 1604 ha−1 (28%) when the salinity increases from low to medium level and US$ 4352 ha−1 (76%) if it jumps from low to high level [10].
Basically, soil salinity is a dynamic process with severe consequences for the soil, hydrological, climatic, geochemical, agricultural, social, and economic aspects. Therefore, for greater development and implementation of sufficient soil reclamation programs and preventing any further salinization to sustain agricultural lands and natural ecosystems, information on the spatial extent, nature and distribution of soil salinity is becoming very essential. Thus, timely detection of soil salinity, monitoring and assessment of its severity level and extent become very important in its beginning at local and regional scales.
Conventionally, soil salinity has been measured by collecting in situ soil samples and analyzing those samples in the laboratory to determine their solute concentrations or electrical conductivity. However, these methods are time-consuming and costly since dense sampling is required to adequately characterize the spatial variability of an area [11-14]. Ghabour & Daels [15] agreed that detection soil salinity traditionally is time consuming, but remote sensing data and techniques offer more efficiently and economically rapid tools and techniques for monitoring and mapping soil salinity.
Remote sensing data and techniques have been progressively applied to monitor and map soil salinity since 1960s when black-and-white and color aerial photographs are used to delineate salt-affected soils [16]. Multispectral data such as Landsat, Satellite Pour l’Observation de la Terre (SPOT), IKONOS, QuickBird and the Indian Remote Sensing (IRS) series of satellites, as well as hyperspectrl data such as EO-1 Hyperion and HyMap, have been found to be useful in detecting, mapping, and monitoring soil salinity [17-23]. Generally, remote sensing uses the electromagnetic energy reflected from targets to obtain information about the Earth’s surface with different levels of detail. So based on this concept, the spectral reflectance of the salt features at the soil surface has been widely studied using remote sensing and used as a direct indicator for soil salinity detection and mapping. However, when the soil moisture is high or the crust salt is invisible on the soil surface or mixed with other soil constituents, this direct approach becomes complicated and may yield unreliable results since these factors influence the soil spectral reflectance. But, the present scattered vegetation or halophytes on the soil surfaces can serve as a sign of the salinity problem, making it possible to indirectly detect and map areas that are affected by soil salinity using the reflectance from vegetation. Normally, unhealthy vegetation has a lower photosynthetic activity, causing increased visible reflectance and the reduced near-infrared reflectance (NIR) from the vegetation [24]. This pattern has been found in various plants subjected to salinity stress [25]. Therefore, based on this finding, several vegetation indices (VIs) such as Normalized Differential Vegetation Index (NDVI) and Soil Adjusted Vegetation Index (SAVI) have been used as indirect indicators assess and map soil salinity. Similarly, a number of researchers have developed different salinity indices to detect and map soil salinity such as Normalized Difference Salinity Index (NDSI) and Salinity Index (SI).
This review concentrates on the problem of soil salinity and discusses some soil salinity indicators and how remote sensing data and technologies are used for monitoring and mapping soil salinity. Additionally, it will discuss the most current vegetation and salinity indices used for soil salinity detecting and mapping, and it highlights some of the limitations and problems of using remote sensing for monitoring and mapping this hazard with an emphasis on soil salinity mapping and monitoring techniques for arid and semi-arid regions.
2. Soil Salinity and Remote Sensing
2.1. Soil Salinity Symptoms
Soil salinity can be detected directly from remotely sensed data through salt features that are visible at the soil surface, such as bare soil with white salt crusts on the surface [19,26] or indirectly from indicators such as the presence of halophytic plant, the performance level of salt-tolerant crops [27-30].
2.1.1. Salt Features at the Soil Surface
The dynamic processes at the surface of saline soil limit the monitoring and assessment of the salinization process because they influence the spectral, spatial and temporal behavior of the salt features [31]. Via the physicochemical properties of soil such as soil moisture content, organic matter, soil texture, types of clay color and surface roughness soil spectral reflectance is determined [32-36]. Due to salinity these soil properties change which affect the spectral reflectance of features that occur at the soil surface, including salt crusts and efflorescence besides variations in surface texture and structure [37,38]. For example, Schmid et al. [37]found that crusted saline soil reflects strongly in the visible and near-infrared (NIR) bands; moreover, Rao Singh and Sirohi [39] noted that a crusted saline soil surface is generally smoother than a non-saline surface and exhibits high reflectance in the visible and NIR bands, which has been confirmed by Rao et al. [40]. On the other hand, Metternicht and Zinck [41] found that the reflectance in the visible and NIR bands is highly affected by both the crust color and surface roughness factors.
Despite the effects of salt features on the soil surface on the spectral reflectance, they have been considered good direct indicators of soil salinity. For example, Fernandez-Buces et al. [42] used surface features to predict soil salinity. They found that the correlation coefficient between surface colors, EC and the sodium adsorption ratio (SAR) were statistically significant, which suggested that efflorescence color is a promising surface indicator with which to estimate soil salinity.
2.1.2. Presence of Halophytic Plants
Halophytic plants (salt-tolerant plants) are plants that tolerate high salt concentrations of the soil and can be grown on a salt affected land [43]. Although halophytic plants are common in saline areas, not all have been found to be good remote sensing indicators of soil salinity.For instance, Metternicht [44] found the spectral reflectance curve with high absorption in the visible range and high reflectance in the NIR range of halophyte Chenopodiaceae in Bolivia, to be equivalent to that of chlorophyll-rich vegetation. In contrast, due to lower chlorophyll content the spectral reflectance curve of C. dactylon, also a halophyte, increased continuously in the visible and NIR bands. This study concluded that halophytic plants were promise indicator to distinguish saline areas from non-affected ones.
2.1.3. Crop Performance
The performance of some crops that can be grown on saline soils, such as alfalfa, barley, and cotton, reflect the severity of soil salinity. Cotton is largely cultivated on irrigated land, is therefore considered an ideal indirect indicator for soil salinity, so it has been used as salinity indicators in a variety of studies [31]. For example, based on the high correlations between the Normalized Difference Vegetation Index (NDVI) values of cotton, sugarcane crops and the EC, Wiegand et al. [45,46] successfully assessed the severity and extent of soil salinity in terms of the economic impact on crop production and also distinguished saline soils from non-affected soils. This strong relationship most likely exists only where salinity is the major factor that causes crop yield variability; lands that suffer from soil salinity are likely to have other factors that affect yields as much or more than salinity, such as high or low temperatures, topography and land management. Therefore, deduction of the relationship between a number of saline fields and an entire landscape is likely to result in large errors, so the possible use of this indicator for determining the level of soil salinity must be checked carefully. To overcome this issue, some researchers have proposed using average crop production over a series of years to mask out the noise from non-soil factors that differ from year to year. For example, Lobell et al. [47,48] warn of the use of inter-annual changes on crop yield as an indirect indicator of soil salinity at regional scales because yield mapping that is limited to only one year does not always give a reliable estimator of soil salinity, particularly when strongly saline soils are scarce. Thus, through the use of a 6-year temporal series of satellite images of yield, they obtained a strong correlation between yield losses and soil salinity; they highlighted that yield loss in agricultural regions could be primarily due to several factors, including soil salinity.
3. Mapping and Monitoring Soil Salinity Using Remote Sensing Data
Advantages of using remote sensing technology include saving time, wide coverage (satellite remote sensing provides the only source when data is required over large areas or regions), are faster than ground methods, and facilitate long term monitoring. These techniques provide multispectral image with resolutions that can be ranged from medium to high, as well as hyperspctral image. These remotely sensed data have been successfully used for monitoring and mapping soil salinity for decades with mixed results. Many researchers have used different techniques to monitor and map soil salinity using remote sensing data, as discussed below.
3.1. Multispectral Satellite Sensors for Mapping and Monitoring Soil Salinity
Extensive research using satellite imagery for mapping and monitoring soil salinity has been conducted over the last three decades, mostly with multispectral sensors. These include Landsat Thematic Mapper (TM), Landsat Multispectral Scanner System (MSS), Landsat Enhanced Thematic Mapper Plus (ETM+), SPOT, Advanced Spaceborne Thermal Emission and Reflection Radiometer (Terra-ASTER), Linear imaging self-scanning sensor (LISS-III) and IKONOS [23,49,50]. For example, in the United States of America (USA), Elnaggar and Noller [51] used Landsat TM imagery integrated with decision-tree analysis (DTA) to map soil salinity in central Malheur County. They found that there was a significant relationship between EC values and reflectance in Landsat bands 1, 2, 3 and 4 as well as the Brightness (BI) and Wetness (WI) indices. Maximum likelihood supervised classification was used to classify the image into nonsaline soils (EC < 4 dS/m) and saline soils, with accuracies of 97% and 60% respectively, whereas DTA predicted five classes of soil salinity with an overall accuracy of approximately 99%. Their results indicated that the use of Landsat TM imagery effectively identified bare soils that were characterized by high spectral reflectance due to a high salt content on the surface, and the approach of integrating DTA with remote sensing data was more accurate and effective compared to using remote sensing analysis alone.
Many researchers, including Katawatin and Kotrapat [52], Mehrjardi [53] and Yu et al. [54] have investigated the utility and effectiveness of ETM+ data for soil salinity mapping and monitoring. For example, in Thailand, Katawatin and Kotrapat [52] investigated the use of Landsat-7 ETM+ with different combinations of three sources of ancillary data (topography, geology, and underground water quality) for soil salinity mapping. A maximum likelihood classification method was employed in this study. Their results showed that the use of Landsat ETM+ data bands 4, 5 and 7 in combination with all three types of ancillary data yielded the most accurate soil salinity map, with 83.6% overall accuracy. Additionally, Douaoui et al. [55], Farifteh et al. [56] and Eldeiry and Garcia[57] agreed that an integrated approach using remote sensing techniques in addition to ancillary data such as field data, topography and spatial models geophysical surveys can improve the development of high quality soil salinity maps.
Using multispectral sensors for soil salinity research has also been studied by Goossens et al. [58]. Their study examined and compared the accuracy of Landsat TM, MSS, and SPOT XS imagery for soil salinity mapping. They found that Landsat TM was optimal for soil salinity mapping. Another comparative assessment of the suitability of multisensor data for soil salinity studies was conducted in Pakistan by Ahmed and Andrianasolo[59]. They compared the performance of Landsat TM and SPOT XS in mapping salinity at a semi-detailed level. Their results were completely opposite to that of Goossens et al. [58]. They found that the SPOT XS data were more helpful than Landsat TM as it provided finer details of various thematic variables.
Thermal band has proven to be a useful tool in soil salinity studies. It has a key role in differentiating saline soils, especially in areas of bare soil or sparse and similar vegetation. For example, Verma et al. [50] demonstrated that the addition of the thermal band of Landsat TM to the visible-NIR bands helped overcome spectral similarity issues with saline soils. Furthermore, thermal band was used to discriminate saltand sodium-affected soils by Metternicht and Zinck [41]. They found that the incorporation of the thermal band allowed for better salt and sodium detection. Furthermore, in a case study in Iran, AlaviPanah and Goossens [60] found that the addition of the thermal band to the best Landsat TM visible-NIR band combination had great potential for separating saline soil from gypsiferous soil. This study confirmed the result obtained by Goossens et al. [61], who reported the key role of the TM thermal band in separating gypsiferous soil from saline soils. In China, Huang et al. [62] used Terra ASTER imagery to identified saline areas dominated by sodium chlorides and sodium sulfates. Their results showed a good correlation between surface salt concentrations and band 1 of the ASTER sensor, followed by bands 2 and 3.
It cannot be denied that medium or low spatial resolution of the satellite images can limit the mapping and detection of saline regions, particularly when the affected areas are smaller than the pixel size. Thus, high resolution multispectral sensors with pixel size of less than 5 m are becoming an essential for soil salinity studies [23]. However, only limited attempts have been made to identify and map soil salinity problems using fine spatial resolution (0.6 m - 4 m) images that are available from IKONOS (4 bands) and Quickbird (4 bands) satellites, as well as WorldView-2, which has 8 multispectral bands at 1.84 m spatial resolution and one panchromatic band at 0.5 m spatial resolution [63]. This is most likely due to the higher cost of this higher-resolution imagery and these sensors being more recently developed systems. Elhaddad and Garcia [64] have used IKONOS satellite imagery and crop reflectance to identify the severity level of soil salinity and its effect on crop yield in Arkansas River Basin, Colorado. Image enhancement was used to separate the crop condition into several classes, and supervised classification was applied to delineate the different levels of soil salinity. They concluded that the superior effectiveness of their approach was primarily due to the use of high spatial resolution imagery. On the other hand, Dwivedi et al. [23] conducted a comparative study on the performance of IKONOS imagery and imagery from the IRS-ID LISS-III sensor for mapping salt-affected soils. Different image classification and transformation techniques were used in their study, and an overall accuracy of 92.4% was gained when using IKONOS data compared to an overall accuracy of 78.4% and 84.3% obtained when using the IRS-ID LISS-III multispectral sensor, which indicates the great potential of high spatial resolution IKONOS images for soil salinity mapping and detection. In South Australia, Setia et al. [22] detected and mapped soil salinity in an agricultural area using QuickBird imagery. They found that 99% of the variation in spectral values occurred in bands 2 and 4. Furthermore, they found that by dividing the image into hundreds of paddocks (small fields) and performing an unsupervised classification using a paddock-by-paddock approach, which is a procedure where each individual paddock is classified and mapped separately, they were able to map soil salinity severity levels more accurately. Thus, they concluded that a paddock-by-paddock classification approach for QuickBird imagery is a promising method for detecting degrees of salinity severity at a farm level. However, in spite of these promising results, it should be noted that it would extremely difficult to assess the validity and reliability of this approach at regional scales because it is a time-consuming and labor-intensive procedure. Thus, further investigations will help to elucidate whether and how a paddock-by-paddock classification approach will work at regional scales.
3.2. Limitations of Multispectral Satellite Sensors in Soil Salinity Mapping and Monitoring
Multispectral satellite sensors have been and still are the preferred method for mapping and monitoring soil salinity. This is primarily due to the low cost of the imagery (e.g., Landsat, SPOT) and the ability to map extreme surface expressions of salinity. Nevertheless, multispectral data has limited diagnostic capability because of its coarse spatial and spectral resolutions [65]. For example, Furby et al. [66] and Howari [67] reported that direct mapping of soil salinity with multispectral imagery had major limitations that arise, especially where there are no salt features on the soil surface and where saline soils are dominated by halophyte plants. Additionally, Furby et al. [66] stated that multispectral satellite sensors caused confusing reflectance, as they found that non-saline soils were confused with bare, extremely saline areas. In the case of Landsat imagery, Fraser and Joseph [68] reported that the spectral resolution of Landsat was insufficient due to the difference between the spectra of saline land and waterlogged land not being sufficient to allow spectral separation, as well as the variable spectral response of saline soil. Additionally, Hick & Russell [69] state that the ability of discriminating plant species and plant health conditions is challenging with Landsat imagery due to the absence of narrow bands in the range of 700 - 730 nm, 730 - 760 nm and 900 - 1100 nm.
3.3. Hyperspectral Remote Sensing Data
Most of the studies discussed above have attempted to map and monitor soil salinity using different multispectral satellite sensors. However, the use of such sensors is restrictive, as their spectral resolution influences the quality and quantity of the information they provide. The development of airborne and satellite-based hyperspectral sensors has overcome some of the spatial and spectral limitations of multispectral satellite imagery for monitoring and mapping soil salinity, both regionally and locally. Hyperspectral sensors offer a large number of spectral bands with high spatial resolution that allow the discrimination of halophyte plants from non-halophyte plants as well as the identification of surface salt features in more detail than the multispectral sensors [70,71]. Taylor et al. [72] demonstrated the possibility of using airborne hyperspectral data to map salinity in the soil. They described the use of visible-NIR and shortwave infrared (SWIR) hyperspectral data that were collected with airborne Geoscan sensor to map soil salinity at Pyramid Hill, Victoria, Australia. The found that differentiation of salt-affected soils based on the mapping of halophytic plants simply achieved via the employing of the principal component analysis of Geoscan imagery. The potential of the HyMap airborne hyperspectral sensor, which captures images within a spectral range of 450 - 2500 nm in 128 bands, for soil salinity studies has been tested by Dehaan and Taylor [73,74]. They concluded that HyMap has considerable potential for mapping saline areas that characterize the variety of salinity levels and scattered halophyte plants. Likewise, Farifteh et al. [75] measured reflectance spectra from multiple sources (experimental, field, and airborne datasets) to predict salt concentrations with Partial Least Squares Regression (PLSR) and Artificial Neural Networks (ANN) and maped soil salinity using airborne hyperspectral data acquired with HyMap. Their results indicated that both PLSR and ANN enabled good mapping of soil salinity.
After the year 2000, two experimental hyperspectral sensors were launched, CHRIS and Hyperion [76]. Compared to airborne hyperspectral remote sensing, very limited numbers of studies on soil salinity have been conducted with these space-borne hyperspectral data. In Turkey, soil salinity was assessed by Satir et al. [77] using CHRIS PROBA sensor imagery and the spectral characteristics of indicator crops. Their study showed a strong correlation between the spectral wavebands of CHRIS PROBA and the reflected signals of cotton and wheat for detecting soil salinity, which confirmed that the condition of cotton and wheat crops is a good indirect indicator of soil salinity. On the other hand, a study by Dutkiewicz [71] evaluated the performance of Hyperion imagery for mapping surface symptoms of dryland salinity using mixture-tuned matched filtering in southern Australia. She found that the hyperspectral imagery wasunable to distinguish halophytic samphire vegetation at slight or moderate levels of salinity; however, it could be used to map high to very high and extremely high salinity. In China, Weng et al. [18] have investigated the potential of data from the spaceborne Earth Observing 1 (EO-1) Hyperion sensor for the prediction of soil salinity. Partial Least-Squares Regression (PLSR) and Stepwise Linear Regression (SWR) were used as prediction models. Their results indicated that the PLSR model produced more accurate estimations of soil salt content than SWR and could overcome the difficulties that were caused by high dimensionality and strong correlation among input variables as well as noisy data. Thus, they concluded that PLSR was a promising approach for the quantitative mapping of soil salinity with Hyperion data over a large area. These results suggest that further studies need to be conducted to examine prediction models based on nonlinear regression methods, and the spectral noise of hyperspectral data should be taken into consideration to increase the accuracy of soil salinity mapping. In addition, a more recent study was conducted in Iran by Hamzeh et al. [78] to investigate the ability of Hyperion spaceborne hyperspectral data for mapping salinity stress in sugarcane fields. Different classifications such as Support Vector Machine (SVM), Spectral Angle Mapper (SAM), Minimum Distance (MD) and Maximum Likelihood (ML) were used with different band combinations to classify soil salinity into three classes (low, moderate and high salinity). Their results indicated that SVM classification using all bands as input data yielded a salinity map with good accuracy, with an overall accuracy and kappa coefficient of 78.7% and 0.68, respectively.
4. Using Vegetation and Soil Indices in Soil Salinity Studies
4.1. Vegetation and Soil Indices
As mentioned previously, halophytic plants grow naturally in saline soil, and can be adapted to high soil salinity. Therefore, vegetation has been used as an indirect indicator to predict and map soil salinity. Accordingly, numerous researchers have conducted studies on the mapping and delineation of soil salinity using different Spectral Vegetation Indices (SVI). Among the vegetation indices, NDVI, SAVI, Ratio Vegetation Index (RVI) and Tasseled Cap Transformation that consisted of the Soil Brightness Index (SBI), the Green Vegetation Index (GVI), and the Wetness Index (WI) have been used in soil salinity studies [26,29,30,57,79-81].
Due to absorption in the visible range and high reflectance in the NIR range of the electromagnetic spectrum, the NDVI (Table 1) has been widely used to map soil salinity by monitoring halophytic plants [42,51,79]. The difference in reflectance between the visible and NIR bands is divided by the sum of the two bands’ reflectance (Table 1). This normalizes differences in the amount of incoming light and produces a number from −1 to 1; the range of actual values is approximately 0.1 for bare soils to 0.9 for healthy vegetation [82]. In Mexico, FernandezBuces et al. [42] found a significant correlation between NDVI, EC and SAR. Moreover, Pérez González et al. [83] have correlated the NDVI of halophytic vegetation with the spatial variability of the chemical and physical properties of a transect to identify saline hydromorphic soils. Their results showed the NDVI to be very proper in detecting halophytic plant and relating it to saline soils. Additionally, Bannari et al. [84] have stated that because plant growth declines due to soil salinity, salt stress could be predicted using the NDVI. However, researchers such as Metternicht and Zinck [76] and Zhang, et al. [29] argue that detecting soil salinity using the NDVI is challenging because the presence of vegetation could cause spectral confusion with the reflectance properties of salt and also because the NDVI is considered an unreliable indicator, as it is also correlated to other yield variables such as chlorophyll content, biomass and leaf area. Liu and Huete [85] have developed a modification of the NDVI to reduce the atmospheric and canopy background noise, the enhanced soil and atmosphere resistant vegetation index (EVI) (Table 1). A comparison study of the efficiency of the EVI and NDVI calculated from Multiyear Moderate Resolution Imaging Spectroradiometer (MODIS) imagery for assessing soil salinity in the Red River Valley, United States has been conducted by Lobell et al. [48]. They found that the EVI is a more reliable indicator of salinity than the NDVI. The use of the RVI (Table 1) to measure the spectral reflectance of soybean canopy and elephant grass under different salinity and irrigation treatments was investigated by [80] and [86]. In both studies, the results showed that the canopy spectral reflectance in the NIR region was reduced as salinity level increase.
Furthermore, SAVI (Table 1) was developed by Huete [87] to eliminate soil-induced variation and for use in areas where soil backgrounds differed and the low canopy cover was present. Depending on the crop density, the L factor generally ranges from 0 for higher densities and 1 for lower densities [87]. The resulting SAVI values in the classified image are either positive, negative or zero. A positive SAVI value indicates that there is a decrease in the vegetation, while a negative value indicates an increase in vegetation. A zero value indicates no change in vegetation. The effectiveness of this index for soil salinity detection and mapping has been studied by several researchers, including Zhang et al. [29], Alhammadi [88], Koshal [89], Elnaggar & Noller [51] and Masoud & Koike [90]. For example, in the United Arab Emirates (UAE) Alhammadi and Glenn [27] used the SAVI index for detecting date palm health under soil salinity. They found that the SAVI values decreased with increasing soil salinity; for instance, the SAVI value was 0.155 at the lowest salinity level of 6900 parts per million (ppm), whereas the value decreased to 0.104 at the very high salinity of 41,000 ppm. These results showed the potential of using the date palm, which is a halophytic plant, as an indirect indicator of soil salinity as well as the effectiveness of the SAVI in detecting plant stress related to severe salinity and thus permitting the identification and mapping of saline areas indirectly. Recently, Zhang et al. [29] have proposed four Soil-adjusted Salinity Indices (SASIs) through the most sensitive bands in a SAVI form. For halophyte plants, SASIs produced better results compared to other selected vegetation indices such as the NDVI and SAVI. These results indicate that in highly saline areas that are covered mainly by halophyte plants, SASIs would give superior results, whereas VIs such as NDVI and SAVI would only be proper to assess salinity in low saline areas covered by salt-sensitive plants.
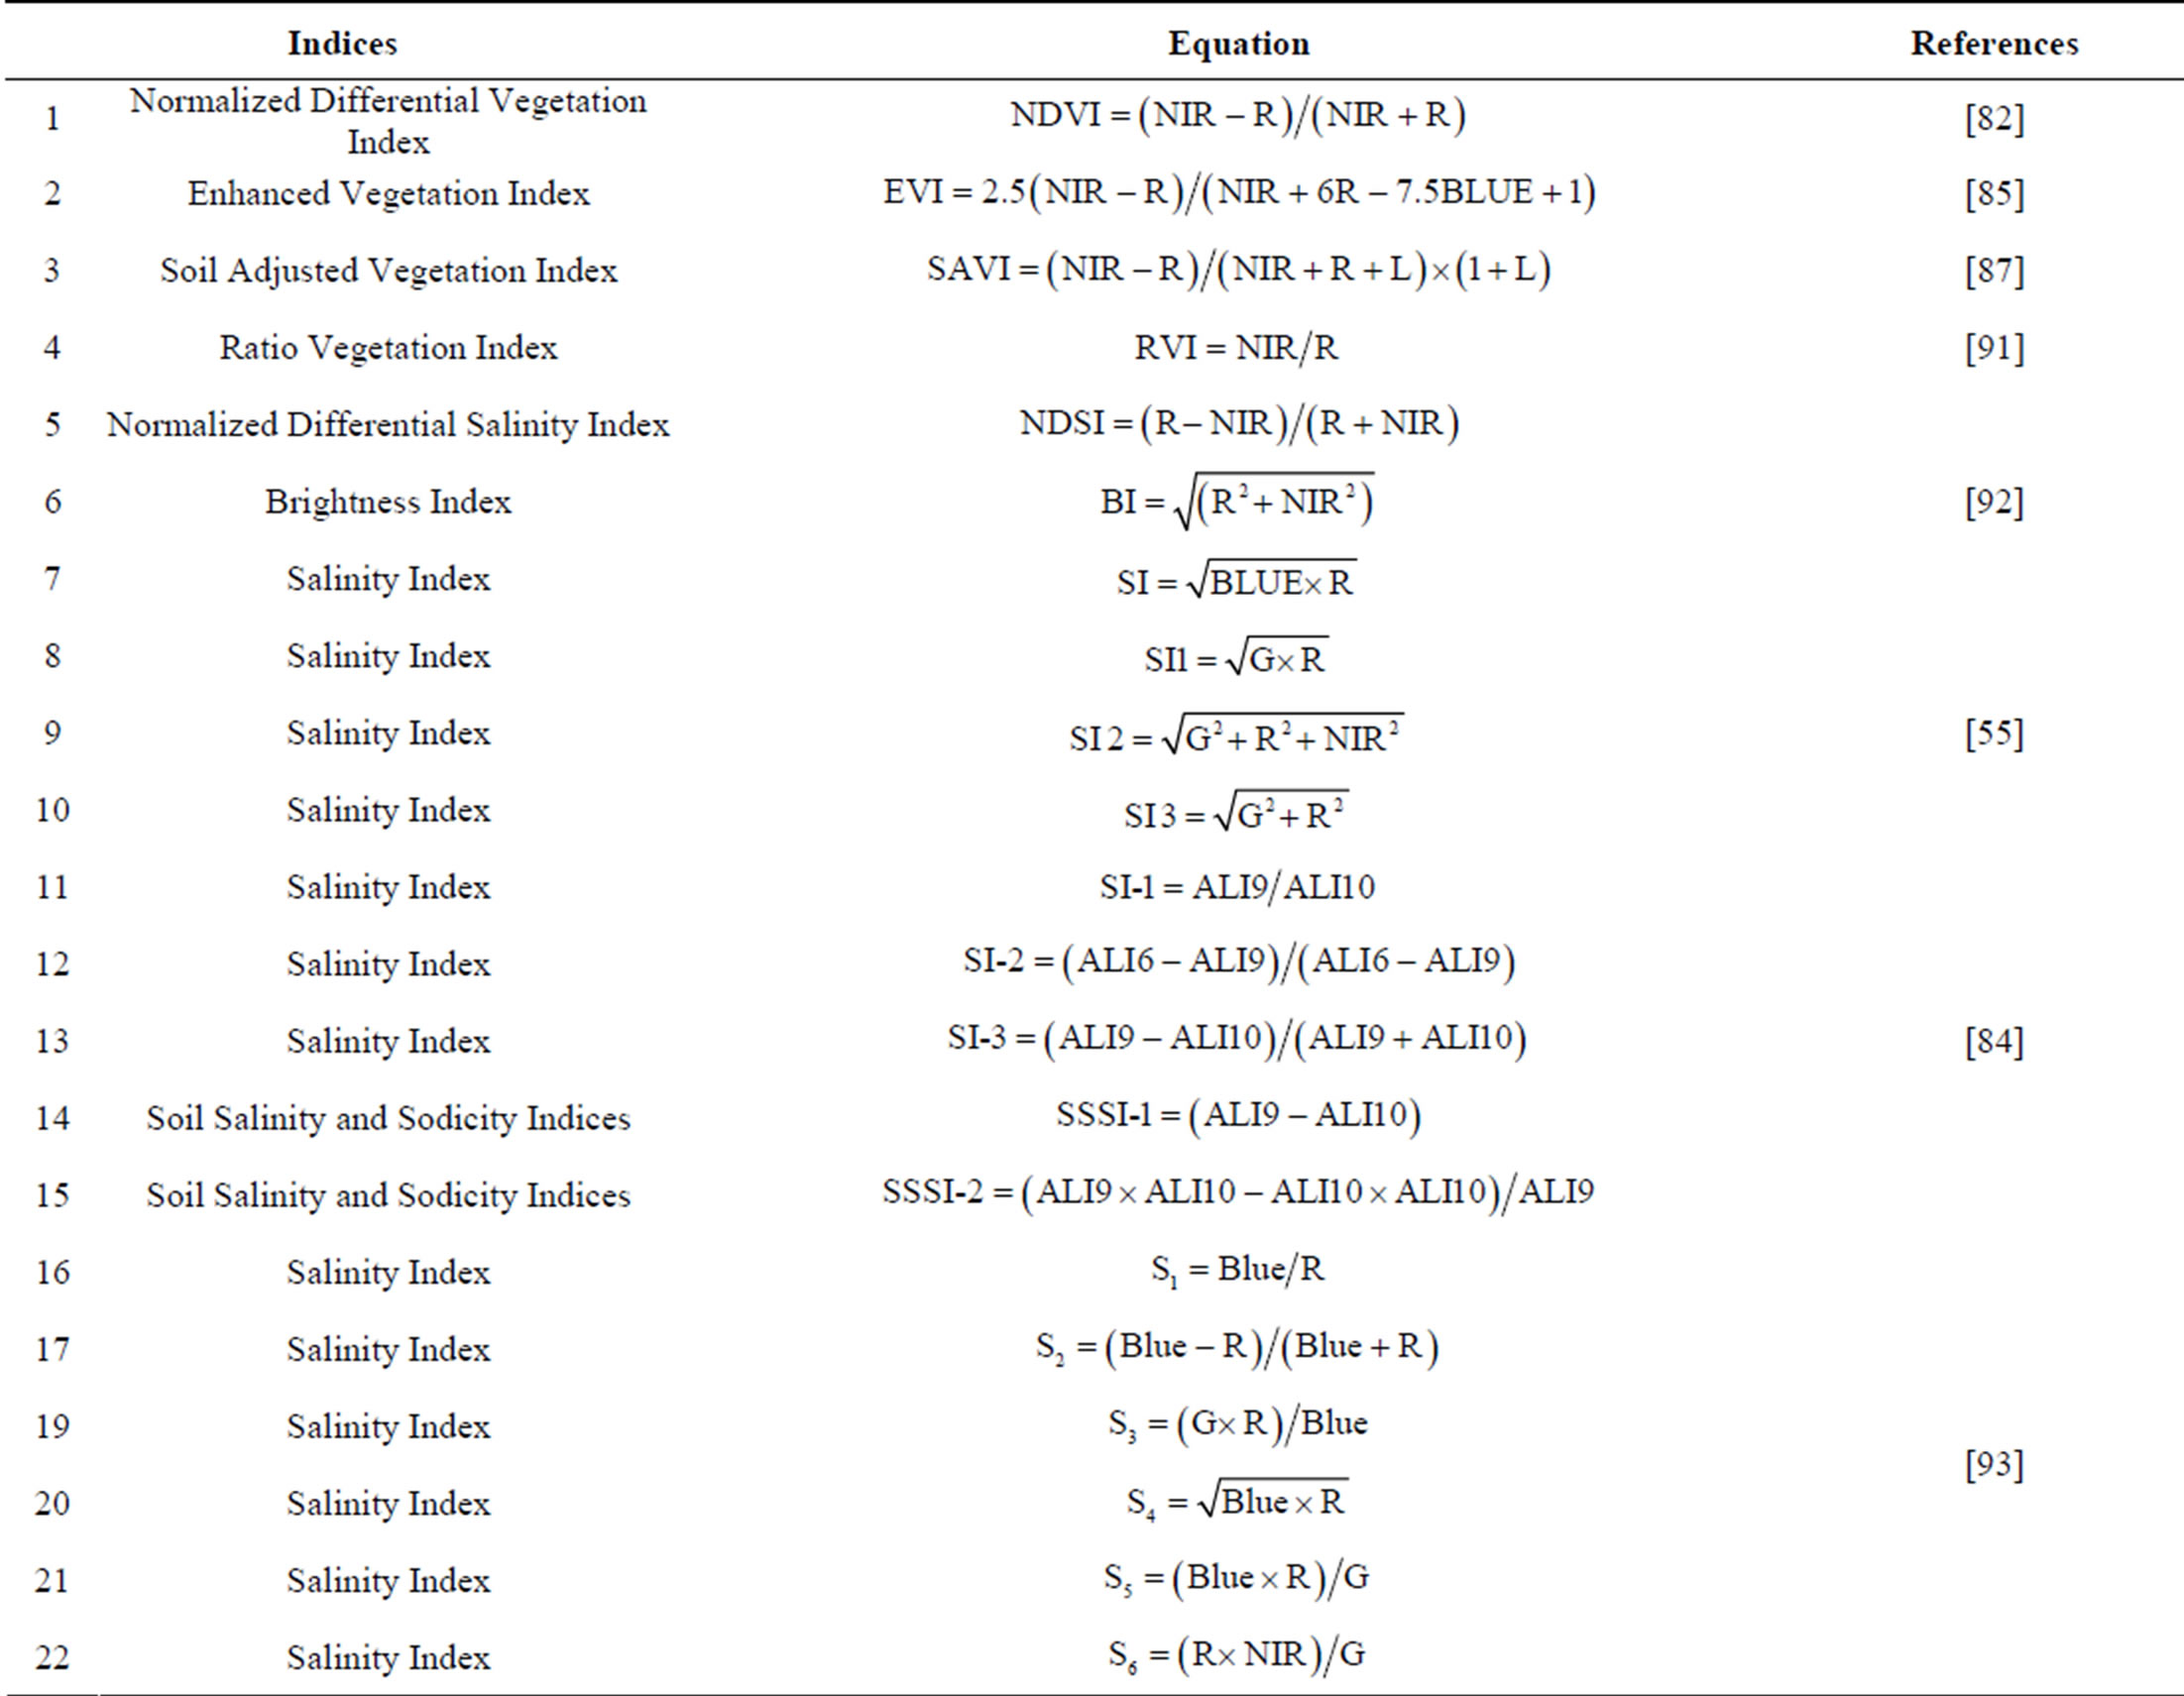
Table 1. Vegetation and soil salinity indices that have been proposed and used for soil salinity monitoring and mapping.
Similarly, various spectral salinity indices have been developed for salt mineral detection and mapping. Douaoui et al. [55] have proposed three salinity indices (Table 1) produced from SPOT XS imagery to detect and map soil salinity hazards in a semi-arid environment in Algeria. They found that those indices were strongly correlated with measured values, but considerably underestimated the salinity of areas with high levels of surface salt. Besides, Khan et al. [92] have proposed three spectral salinity indices: the Brightness index (BI), Normalized Difference Salinity Index (NDSI) and Salinity Index (SI) (Table 1) from the LISS-II sensor of the IRS-1B satellite to assess hydrosalinized land degradation in Pakistan. Among these indices, they found that NDSI yielded the most acceptable results in identifying different salt classes. Another study conducted by Vidal et al. [94] and Vincent et al. [95] looked at salinity by differenting vegetated from non-vegetated areas using NDVI; then the BI was computed to identify the moisture and salinity status of fallow land and deserted fields. Furthermore, three different salinity indices, SI-1, SI-2 and SI-3 (Table 1) from the EO-1 ALI spectral bands, have been proposed by Bannari et al. [84] to discriminate slight and moderate soil salinity and sodicity in Morocco. Although the results showed that SI-3 had the highest correlation (46.9%), the result from this index was not adequate to provide precise information. Therefore, they devised another two Soils Salinity and Sodicity Indices (SSSI) (Table 1). Their results indicated that these SSSI indices were likely to increase the identification accuracy in areas with low and medium salinity because they offered the most significant correlation (52.9%) with the ground EC measurement. In Pakistan, Abbas and Khan [93] have suggested an integrated approach based on the spatial analysis of both ground and satellite data to assess soil salinity. Remotely sensed data-based salinity indices and a Principal Components Analysis (PCA) were developed to detect soil salinity. Their result showed that out of the six salinity indices (Table 1) S3 produced the most promising result compared to ground measurements. Moreover, they concluded that PCA and salinity indices are promising techniques for soil salinity prediction based on satellite images.
Looking at these vegetation and soil salinity indices in the literature, a number of results stand out. Utilizing vegetation indices in the assessment and mapping of soil salinity in areas of densely vegetated soils will yield promising results, whereas on bare soils, the identification of salt based on vegetation indices will not work. Thus, soil salinity indices will be the appropriate method in the case of bare soils or soils with very low scattered vegetation cover, providing super results. These observations are in agreement with Bouaziz et al. [96] and Fan et al. [97]. Bouaziz et al. [96] found that vegetation indices such as SAVI, NDVI and EVI had a low correlation with EC due to an insufficient density of vegetation cover, whereas soil salinity indices indices exhibited higher correlations with EC. Additionally, Fan et al. [97] found that NDVI values had a significant negative relationship with soil salinity in soils covered by vegetation, whereas this relationship was not clear on bare soil.
5. Issues in Mapping Soil Salinity in Arid and Semi-Arid Regions Using Remote Sensing
The spatial, temporal and vertical variability in the soil profile are the limiting factors in the assessment and mapping of soil salinity using remote sensing data because the spectral reflectance is unable to provide information on the whole soil profile, as it only observes the soil surface [98,99]. Moreover, the surface characteristics in many cases may not be representative of the deeper soil profile [100]. However, combining remote sensing data with geophysical surveys and simulation models can be an alternative option [56].
The direct detection of soil salinity becomes applicable and much easier for bare soils and/or whenever salt-related symptoms (e.g., crusts) and scattered vegetation are visible on the surface; in these cases, information such as salt types and quantity as well as the crust thickness can be provided based on the soil surface spectral signatures [67,101]. Yet, the direct deduction of soil salinity in arid and semi-arid regions that are characterized by dense vegetation cover would be difficult, as the vegetation will cause spectral mixing [102,103].
On the other hand, different studies such as Tashi et al. [104], Fernandez-Buces, et al. [42] have successfully used indirect indicator to map soil salinity through monitoring the vegetation condition by using NDVI. Generally, these methods assume that soil salinity is the only stressor decreasing and damaging the crop condition, whereas other factors such as inappropriate soil management and water quality are neglected. Moreover, reductions in vegetation growth and vigor could be related to a lack of necessary nutrients rather than the occurrence of salt. Additionally, different plants generally grow in different levels of salinity, so that the NDVI is considered an uncertain indicator for soil salinity monitoring and mapping. Besides, the existence of halophytic plants may confuse soil salinity detection based on the NDVI due to mixing with the spectral signature of salt, which then will lead to classification errors [98]. Hence, to overcome this issue and remove classification errors to some degree, the SAVI index and other indices and enhancement models have helped to separate soil and vegetation signals [105].
Additionally, low spectral resolution satellite images limit the direct detection and mapping of soil salinity, primarily due to their inability to detect particular absorption bands of some salt types and the frequent occurrence of problems with mixedspectral signatures that come from a variety of surface components [74,106]. Nevertheless, the advance of hyperspectral sensors has enabled spectral features associated to the characteristic absorption bands of salt minerals to be mapped with more detail [107]. The above shortcomings indicate that detecting and mapping soil salinity in arid and semi-arid regions using remote sensing is challenging. This is primarily attributed to the weakness of the spectral signals from saline soils compared to the noise caused by other factors. Obviously, there is no agreed-on best approach to this technology for monitoring and mapping soil salinity, as many researchers have used and applied different tools and techniques to map and monitor saline soils with varying degrees of success. For example, in the case of vegetation indices, some researchers like Elnaggar & Noller [51] have found that vegetation indices (NDVI, SAVI, and GVI) had a weak correlation with the EC measurements, which suggests that halophytes could not be used to identify salt-affected soils under vegetation cover. Sethi et al. [108] in a study in India, found the same, whereas Pérez González et al. [83] found the NDVI to be very useful in detecting halophytic plants and relating it to saline soils. Despite these varying results of using halophytic plants as indirect indicators for soil salinity detection and mapping, it is ineffective to monitor and map soil salinity through non-halophyte plants, as they cannot live in highly saline areas. Thus, taking into consideration the spectral reflectance of halophytic plants is necessary for soil salinity detection and mapping, particularly in highly saline areas.
6. Conclusions
Soil salinity, either naturally occurring or human-induced, is a serious global environmental problem, especially in arid and semi-arid regions. This is a complex dynamic process with serious consequences for the soil environment as well as, geochemical, hydrological, climatic, agricultural, and economic impacts. Being a severe environmental hazard, the frequent detection of soil salinity and assessment of its extent and severity at an early stage become very important at both local and regional scales. Traditionally, soil salinity was assessed via collecting in situ soil samples and analyzing those samples in the laboratory. Undertaking this method, especially over a large area, is expensive and time consuming. Remote sensing represents a good alternative for monitoring and mapping changes in soil salinity.
Remote sensing data have been used extensively to identify and map saline areas, and the potential of remote sensing for assessing and mapping soil salinity is enormous. Multispectral satellite sensors are the preferred method for mapping and monitoring soil salinity, largely due to the low cost of such imagery and the ability to map extreme surface expressions of salinity. However, multispectral data have limited capabilities due to their spatial and spectral resolution. Hyperspectral imagery, with its fine spatial and spectral resolutions, allows soil salinity mapping in greater detail and represents another alternative.
Surface reflectance is highly affected by soil’s moisture content, salt content, color, and surface roughness. High salt concentrations can be identified through the existence of characteristic vegetation types and growth patterns or by the salt efflorescence and crust that are present on bare soils. Similar to vegetation indices, researchers have developed different salinity indices to detect and map soil salinity. As discussed, these indices have been applied with varying degree of success. Field sites differ in terms of levels of salinity and the amount of vegetation cover; hence, a single selected index may not perform best in all cases. Each site needs to be assessed regarding the strengths and weaknesses of the proposed indices before appropriate remote sensingbased indices are used for soil salinity mapping and assessing.
REFERENCES
- L. Richards, “Diagnosis and Improvement of Saline and alkali Soils,” Soil Science, Vol. 78, No. 2, 1954, p. 154. http://dx.doi.org/10.1097/00010694-195408000-00012
- D. P. Shrestha and A. Farshad, “Chapter 13. Mapping Salinity Hazard: An Integrated Application of Remote Sensing and Modeling-Based Techniques,” In: G. Metternicht and J. A. Zinck, Eds., Remote Sensing of Soil Salinization: Impact on Land Management, CRC Press, Boca Raton, 2008, p. 257. http://dx.doi.org/10.1201/9781420065039.pt3
- D. Hillel, “Salinity Management for Sustainable Irrigation: Integrating Science, Environment, and Economics,” World Bank Publications, Washington DC, 2000. http://dx.doi.org/10.1596/0-8213-4773-X
- P. Koohafkan, “Water and Cereals in Drylands,” The Food and Agriculture Organization of the United Nations and Earthscan, Rome, 2012.
- ABS Australian Bureau of Statistics, “Salinity,” Canberra, 2002. http://www.abs.gov.au/ausstats/abs@.nsf/Lookup/by%20Subject/1370.0~2010~Chapter~Salinity%20(6.2.4.4)
- D. J. McFarlane, et al., “The Extent and Potential Area of Salt-Affected Land in Western Australia Estimated Using Remote Sensing and Digital Terrain Models,” Engineering Salinity Solutions: 1st National Salinity Engineering Conference 2004, Barton, 2004, pp. 55-60.
- J. K. Zhu, “Plant Salt Tolerance,” Trends in Plant Science, Vol. 6, No. 2, 2001, pp. 66-71. http://dx.doi.org/10.1016/S1360-1385(00)01838-0
- D. Corwin and S. Lesch, “Application of Soil Electrical Conductivity to Precision Agriculture,” Agronomy Journal, Vol. 95, No. 3, 2003, pp. 455-471. http://dx.doi.org/10.2134/agronj2003.0455
- J. Rhoades and J. Loveday, “Salinity in Irrigated Agriculture,” In: B. A. Stewart and D. R. Nielsen, Eds., American Society of Civil Engineers, Irrigation of Agricultural Crops, Vol. 30, Monograph, American Society of Agronomists, Madison, 1990, pp. 1089-1142.
- A. Naifer, et al., “Economic Impact of Salinity: The Case of Al-Batinah in Oman,” International Journal of Agricultural Research, Vol. 6, No. 2, 2011, pp. 134-142. http://dx.doi.org/10.3923/ijar.2011.134.142
- P. Brunner, et al., “Generating Soil Electrical Conductivity Maps at Regional Level by Integrating Measurements on the Ground and Remote Sensing Data,” International Journal of Remote Sensing, Vol. 28, No. 15, 2007, pp. 3341-3361. http://dx.doi.org/10.1080/01431160600928641
- D. Dent and A. Young, “Soil Survey and Land Evaluation,” George Allen & Unwin, Crows Nest, 1981.
- R. Dehaan and G. Taylor, “Field-Derived Spectra of Salinized Soils and Vegetation as Indicators of IrrigationInduced Soil Salinization,” Remote Sensing of Environment, Vol. 80, No. 3, 2002, pp. 406-417. http://dx.doi.org/10.1016/S0034-4257(01)00321-2
- M. R. D. Nanni, “Spectral Reflectance Methodology in Comparison to Traditional Soil Analysis,” Soil Science Society of America Journal, Vol. 70, No. 2, 2006, pp. 393-407. http://dx.doi.org/10.2136/sssaj2003.0285
- T. Ghabour and L. Daels, “Mapping and Monitoring of Soil Salinity of ISSN,” Egyptian Journal of Soil Science, Vol. 33, No. 4, 1993, pp. 355-370.
- P. Dale, et al., “Classification of Reflectance on Colour Infrared Aerial Photographs and Sub-Tropical Salt-Marsh Vegetation Types,” International Journal of Remote Sensing, Vol. 7, No. 12, 1986, pp. 1783-1788. http://dx.doi.org/10.1080/01431168608948968
- J. Farifteh, “Imaging Spectroscopy of Salt-Affected Soils: Model-Based Integrated Method,” International Institute Geo-Information Science and Earth Observation (ITC) and Utrecht University, Utrecht, 2007.
- Y. Weng, et al., “Soil Salt Content Estimation in the Yellow River Delta with Satellite Hyperspectral Data,” Canadian Journal of Remote Sensing, Vol. 34, No. 3, 2008, pp. 259-270.
- S. Teggi, et al., “SPOT 5 Imagery for Soil Salinity Assessment in Iraq,” Proceedings of SPIE—Earth Resources and Environmental Remote Sensing/GIS Applications III, Vol. 8538, 2012, pp. 85380V-85380V-12.
- A. K. Koshal, “Spectral Characteristics of Soil Salinity Areas in Parts of South-West Punjab through Remote Sensing and GIS,” International Journal of Remote Sensing and GIS, Vol. 1, No. 2, 2012, pp. 84-89.
- A. Dehni and M. Lounis, “Remote Sensing Techniques for Salt Affected Soil Mapping: Application to the Oran Region of Algeria,” Procedia Engineering, Vol. 33, 2012, pp. 188-198. http://dx.doi.org/10.1016/j.proeng.2012.01.1193
- R. Setia, et al., “Severity of Salinity Accurately Detected and Classified on a Paddock Scale with High Resolution Multispectral Satellite Imagery,” Land Degradation & Development, Vol. 24, No. 4, 2011, pp. 375-384.
- R. Dwivedi, et al., “5 Generation of Farm-Level Information on Salt-Affected Soils Using IKONOS-II Multispectral Data,” In: G. Metternicht and J. Zinck, Eds., Remote Sensing of Soil Salinization: Impact on Land Management, CRC Press, Boca Raton, 2008. http://dx.doi.org/10.1201/9781420065039.ch5
- E. Weiss, et al., “Application of NOAA-AVHRR NDVI Time-Series Data to Assess Changes in Saudi Arabia’s Rangelands,” International Journal of Remote Sensing, Vol. 22, No. 6, 2001, pp. 1005-1027. http://dx.doi.org/10.1080/014311601300074540
- D. R. Tilley, et al., “Hyperspectral Reflectance Response of Freshwater Macrophytes to Salinity in a Brackish Subtropical Marsh,” Journal of Environmental Quality, Vol. 36, No. 3, 2007, pp. 780-789. http://dx.doi.org/10.2134/jeq2005.0327
- H. R. Matinfar, et al., “Detection of Soil Salinity Changes and Mapping Land Cover Types Based upon Remotely Sensed Data,” Arabian Journal of Geosciences, Vol. 6, No. 3, 2013, pp. 913-919.
- M. S. Alhammadi and E. P. Glenn, “Detecting Date Palm Trees Health and Vegetation Greenness Change on the Eastern Coast of the United Arab Emirates Using SAVI,” International Journal of Remote Sensing, Vol. 29, No. 6, 2008, pp. 1745-1765. http://dx.doi.org/10.1080/01431160701395195
- F. Iqbal, “Detection of Salt Affected Soil in Rice-Wheat Area Using Satellite Image,” African Journal of Agricultural Research, Vol. 6, No. 21, 2011, pp. 4973-4982.
- T. T. Zhang, et al., “Using Hyperspectral Vegetation Indices as a Proxy to Monitor Soil Salinity,” Ecological Indicators, Vol. 11, No. 6, 2011, pp. 1552-1562.
- Y. Y. Aldakheel, “Assessing NDVI Spatial Pattern as Related to Irrigation and Soil Salinity Management in Al-Hassa Oasis, Saudi Arabia,” Journal of the Indian Society of Remote Sensing, Vol. 39, No. 2, 2011, pp. 171- 180. http://dx.doi.org/10.1007/s12524-010-0057-z
- G. Metternicht and A. Zinck, “Remote Sensing of Soil Salinization: Impact on Land Management,” CRC Press, 2008. http://dx.doi.org/10.1201/9781420065039
- J. A. M. Demattê, et al., “Visible-NIR Reflectance: A New Approach on Soil Evaluation,” Geoderma, Vol. 121, No. 1-2, 2004, pp. 95-112. http://dx.doi.org/10.1016/j.geoderma.2003.09.012
- D. J. Brown, et al., “Global Soil Characterization with VNIR Diffuse Reflectance Spectroscopy,” Geoderma, Vol. 132, No. 3, 2006, pp. 273-290. http://dx.doi.org/10.1016/j.geoderma.2005.04.025
- M. Baumgardner, et al., “Reflectance Properties of Soils,” Advances in Agronomy, Vol. 38, 1985, pp. 2-44.
- S. De Jong, “The Analysis of Spectroscopical Data to Map Soil Types and Soil Crusts of Mediterranean Eroded Soils,” Soil technology, Vol. 5, No. 3, 1992, pp. 199-211. http://dx.doi.org/10.1016/0933-3630(92)90022-S
- D. Shrestha, D. E. Margateb, F. van der Meera and H. V. Anhc, “Analysis and Classification of Hyperspectral Data for Mapping Land Degradation: An Application in Southern Spain,” International Journal of Applied Earth Observation and Geoinformation, Vol. 7, No. 2, 2005, pp. 85-96. http://dx.doi.org/10.1016/j.jag.2005.01.001
- T. Schmid, M. Koch and J. Gumuzzio, “Application of Hyperspectral Imagery to Soil Salinity Mapping,” In: G. Metternicht and J. Zinck, Eds., Remote Sensing of Soil Salinization: Impact on Land Management, CRC Press, Boca Raton, 2008, pp. 113-137.
- D. S. G. Thomas, “Arid Zone Geomorphology: Process, Form and Change in Drylands,” John Wiley & Sons, Chichester, 2011.
- R. P. Singh and A. Sirohi, “Spectral Reflectance Properties of Different Types of Soil Surfaces,” ISPRS Journal of Photogrammetry and Remote Sensing, Vol. 49, No. 4, 1994, pp. 34-40. http://dx.doi.org/10.1016/0924-2716(94)90045-0
- B. R. M. Rao, R. C. Sharma, T. Ravi Sankar, S. N. Das, R. S. Dwivedi, S. S. Thammappa and L. Venkataratnam, “Spectral Behaviour of Salt-Affected Soils,” International Journal of Remote Sensing, Vol. 16, No. 12, 1995, pp. 2125-2136. http://dx.doi.org/10.1080/01431169508954546
- G. Metternicht and J. A. Zinck, “Spatial Discrimination of Saltand Sodium-Affected Soil Surfaces,” International Journal of Remote Sensing, Vol. 18, No. 12, 1997, pp. 2571-2586.
- N. Fernandez-Buces, C. Siebe, S. Cram and J. L. Palacio, “Mapping Soil Salinity Using a Combined Spectral Response Index for Bare Soil and Vegetation: A Case Study in the Former Lake Texcoco, Mexico,” Journal of Arid Environments, Vol. 65, No. 4, 2006, pp. 644-667. http://dx.doi.org/10.1016/j.jaridenv.2005.08.005
- E. P. Glenn, J. Jed Brown and E. Blumwald, “Salt Tolerance and Crop Potential of Halophytes,” Critical Reviews in Plant Sciences, Vol. 18, No. 2, 1999, pp. 227-255. http://dx.doi.org/10.1016/S0735-2689(99)00388-3
- G. I. Metternicht, “Analyzing the Relationship between Ground Based Reflectance and Environment Indicators of Salinity Processes in the Cochabamba Valley (Bolivia),” International Journal of Ecology and Environmental Sciences, Vol. 24, No. 4, 1998, pp. 359-370.
- C. Wiegand, G. Anderson, S. Lingle and D. Escobar, “Soil Salinity Effects on Crop Growth and Yield-Illustration of an Analysis and Mapping Methodology for Sugarcane,” Journal of Plant Physiology, Vol. 148, No. 3-4, 1996, pp. 418-424. http://dx.doi.org/10.1016/S0176-1617(96)80274-4
- C. Wiegand, J. D. Rhoades, D. E. Escobar and J. H. Everitt, “Photographic and Videographic Observations for Determining and Mapping the Response of Cotton to Soil Salinity,” Remote Sensing of Environment, Vol. 49, No. 3, 1994, pp. 212-223. http://dx.doi.org/10.1016/0034-4257(94)90017-5
- D. B. Lobell, J. I. Ortiz-Monasterio, F. C. Gurrola and L. Valenzuela, “Identification of Saline Soils with Multiyear Remote Sensing of Crop Yields,” Soil Science Society of America Journal, Vol. 71, No. 3, 2007, pp. 777-783. http://dx.doi.org/10.2136/sssaj2006.0306
- D. B. Lobell, S. M. Leschb, D. L. Corwinc, M. G. Ulmerd, K. A. Andersone, D. J. Pottsf, J. A. Doolittleg, M. R. Matosh and M. J. Baltes, “Regional-Scale Assessment of Soil Salinity in the Red River Valley Using Multi-Year MODIS EVI and NDVI,” Journal of Environmental Quality, Vol. 39, No. 1, 2010, pp. 35-41. http://dx.doi.org/10.2134/jeq2009.0140
- R. S. Dwivedi, “Soil Resources Mapping: A Remote Sensing Perspective,” Remote Sensing Reviews, Vol. 20, No. 2, 2001, pp. 89-122. http://dx.doi.org/10.1080/02757250109532430
- K. Verma, R. K. Saxena, A. K. Barthwal and S. N. Deshmukh, “Remote Sensing Technique for Mapping Salt Affected Soils,” International Journal of Remote Sensing, Vol. 15, No. 9, 1994, pp. 1901-1914. http://dx.doi.org/10.1080/01431169408954215
- A. A. Elnaggar and J. S. Noller, “Application of RemoteSensing Data and Decision-Tree Analysis to Mapping SaltAffected Soils over Large Areas,” Remote Sensing, Vol. 2, No. 1, 2009, pp. 151-165. http://dx.doi.org/10.3390/rs2010151
- R. Katawatin and W. Kotrapat, “Use of LANDSAT-7 ETM+ with Ancillary Data for Soil Salinity Mapping in Northeast Thailand,” Third International Conference on Experimental Mechanics and Third Conference of the Asian 2004, Sevilla, 3 June 2005, pp. 708-716.
- R. T. Mehrjardi, Sh. Mahmoodi, M. Taze and E. Sahebjalal, “Accuracy Assessment of Soil Salinity Map in Yazd-Ardakan Plain, Central Iran, Based on Land sat ETM+ Imagery,” American-Eurasian Journal of Agricultural & Environmental Sciences, Vol. 3, No. 5, 2008, pp. 708-712.
- R. Yu, T. X. Liu, Y. P. Xu, C. Zhu, Q’ Zhang, Z. Y. Qu, X. M. Liu and C. Y. Li, “Analysis of Salinization Dynamics by Remote Sensing in Hetao Irrigation District of North China,” Agricultural Water Management, Vol. 97, No. 12, 2010, pp. 1952-1960. http://dx.doi.org/10.1016/j.agwat.2010.03.009
- A. E. K. Douaoui, H. Nicolasb and C. Walter, “Detecting Salinity Hazards within a Semiarid Context by Means of Combining Soil and Remote-Sensing Data,” Geoderma, Vol. 134, No. 1-2, 2006, pp. 217-230. http://dx.doi.org/10.1016/j.geoderma.2005.10.009
- J. Farifteh, A. Farshad and R. J. George, “Assessing SaltAffected Soils Using Remote Sensing, Solute Modelling, and Geophysics,” Geoderma, Vol. 130, No. 3-4, 2006, pp. 191-206. http://dx.doi.org/10.1016/j.geoderma.2005.02.003
- A. Eldeiry and L. A. Garcia, “Detecting Soil Salinity in Alfalfa Fields Using Spatial Modeling and Remote Sensing,” Soil Science Society of America Journal, Vol. 72, No. 1, 2008, pp. 201-211. http://dx.doi.org/10.2136/sssaj2007.0013
- R. Goossens, M. el Badawi, T. Ghabour and M. de Dapper, “A Simulation Model to Monitor the Soil Salinity in Irrigated Arable Land in Arid Areas Based upon Remote Sensing and GIS,” EARSeL. Advances in Remote Sensing, Vol. 2, No. 3, 1993, pp. 165-171.
- I. Ahmed and H. H. Andrianasolo, “Comparative Assessment of Multisensor Data for Suitability in Study of the Soil Salinity Using Remote Sensing and GIS in the Fordwah Irrigation Division,” IEEE International Conference on Geoscience and Remote Sensing, Singapore, 3-8 August 1997, pp. 1627-1629. http://dx.doi.org/10.1109/IGARSS.1997.608989
- S. K. Alavi Panah and R. Goossens, “Relationship between the Landsat TM, MSS Data and Soil Salinity,” Journal of Agricultural Science and Technology (JAST), Vol. 3, No. 2, 2001, pp. 21-31.
- R. Goossens, A. P. S. Kazem, M. De Dapper and O. Kissyar, “The Use of Thermal Band of Landsat TM for the Study of Soil Salinity in Iran (Ardakan Area) and Egypt (Ismailia Province),” International conference on Geoinformatics for Natural Resource Assessment, Monitoring and Management, Indian Institute of Remote Sensing, Dehradun, 3-11 March 1999, pp. 454-459.
- S. Y. Huang, Q. H. Liu, X. W. Li and Q. H. Liu, “Spectral Model of Soil Salinity in Xinjiang of China,” IEEE International Geoscience and Remote Sensing Symposium, Seoul, 25-29 July 2005, pp. 4458-4460.
- K. Navulur, “Multispectral Image Analysis Using the Object-Oriented Paradigm,” CRC Press, Boca Raton, 2006.
- A. Elhaddad and L. Garcia, “Detecting Soil Salinity Levels in Agricultural Lands Using Satellite Imagery,” Proceedings of the American Society for Photogrammetry and Remote Sensing Annual Conference, Reno, 2006.
- B. Spies and P. Woodgate, “Salinity Mapping Methods in the Australian Context,” Department of the Environment and Heritage, Canberra, 2005.
- S. Furby, et al., “Detecting and Monitoring Salt-Affected Land: A Report from the LWRRDC Project Detecting and Monitoring Changes in Land Condition through Time Using Remotely Sensed Data,” CSIRO, Division of Mathematics & Statistics, 1995.
- F. Howari, “The Use of Remote Sensing Data to Extract Information from Agricultural Land with Emphasis on Soil Salinity,” Australian Journal of Soil Research, Vol. 41, No. 7, 2003, pp. 1243-1253. http://dx.doi.org/10.1071/SR03033
- D. Fraser and S. Joseph, “Mapping Soil Salinity in the Murray Valley (NSW) Using Satellite Imagery,” Proceeding of the 9th Australaian Remote Sensing and Photogrammetry Conference, Australia Causal Productions Sydney, Sydney, 1998.
- P. Hick and W. Russell, “Remote Sensing of Agricultural Salinity,” CSIRO, Division of Exploration Geoscience, Perth, 1987.
- R. P. Gupta, “Remote Sensing Geology,” Springer Verlag, New York, 2003.
- A. Dutkiewicz, “Evaluating Hyperspectral Imagery for Mapping the Surface Symptoms of Dryland Salinity,” The University of Adelaide, Adelaide, 2006.
- G. R. Taylor, B. A. Bennett, A. H. Mah and R. D. Hewson, “Spectral Properties of Salinised Land and Implications for Interpretation of 24 Channel Imaging Spectrometry,” Proceedings of the International Airborne Remote Sensing Conference and Exhibition, Taylor & Francis Strasbourg, France, 1994, pp. 504-513.
- R. L. Dehaan and G. R. Taylor, “Field-Derived Spectra of Salinized Soils and Vegetation as Indicators of Irrigation-Induced Soil Salinization,” Remote Sensing of Environment, Vol. 80, No. 3, 2002, pp. 406-417. http://dx.doi.org/10.1016/S0034-4257(01)00321-2
- R. Dehaan and G. R. Taylor, “Image-Derived Spectral Endmembers as Indicators of Salinisation,” International Journal of Remote Sensing, Vol. 24, No. 4, 2003, pp. 775- 794. http://dx.doi.org/10.1080/01431160110107635
- J. Farifteh, F. Van der Meera, C. Atzbergerb and E. J. M. Carranzaa, “Quantitative Analysis of Salt-Affected Soil Reflectance Spectra: A Comparison of Two Adaptive Methods (PLSR and ANN),” Remote Sensing of Environment, Vol. 110, No. 1, 2007, pp. 59-78. http://dx.doi.org/10.1016/j.rse.2007.02.005
- G. Metternicht and A. Zinck, “Remote Sensing of Soil Salinization: Impact on Land Management,” CRC Press, Taylor and Francis Publisher, Boca Raton, 2008.
- O. Satir, S. Berberoglu, S. Kapur, T. Nagano, E. Akça, M. A. Erdogan, C. Donmez, N. Yonca Satir and K. Tanaka, “Soil Salinity Mapping Using Chris-Proba Hyperspectral Data,” Proceedings of Hyperspectral Workshop 2010, Frascati, 17-19 March 2010, 8p.
- S. Hamzeh, A. A. Naseri, S. K. Alavi Panah, B. Mojaradi, H. M. Bartholomeus and M. Herold, “Mapping Salinity Stress in Sugarcane Fields with Hyperspecteral Satellite Imagery,” Proceedings SPIE 8531, Remote Sensing for Agriculture, Ecosystems, and Hydrology XIV, Edinburgh, 24 September 2012, pp. 85312B-1.
- M. T. Jabbar and X. Chen, “Land Degradation Due to Salinization in Arid and Semi-Arid Regions with the Aid of Geo-Information Techniques,” Geo-Spatial Information Science, Vol. 11, No. 2, 2008, pp. 112-120. http://dx.doi.org/10.1007/s11806-008-0013-z
- D. Wang, J. A. Poss, T. J. Donovan, M. C. Shannon and S. M. Lesch, “Biophysical Properties and Biomass Production of Elephant Grass under Saline Conditions,” Journal of Arid Environments, Vol. 52, No. 4, 2002, pp. 447-456. http://dx.doi.org/10.1006/jare.2002.1016
- D. Lobell, S. M. Lesch, D. L. Corwin, M. G. Ulmer, K. A. Anderson, D. J. Potts, J. A. Doolittle, M. R. Matos and M. J. Baltes “Regional-Scale Assessment of Soil Salinity in the Red River Valley Using Multi-Year MODIS EVI and NDVI,” Journal of Environmental Quality, Vol. 39, No. 1, 2010, pp. 35-41. http://dx.doi.org/10.2134/jeq2009.0140
- D. Deering and J. Rouse, “Measuring ‘Forage Production’ of Grazing Units from Landsat MSS Data,” 10th International Symposium on Remote Sensing of Environment, ERIM, Ann Arbor, 1975, pp. 1169-1178.
- M. E. Pérez González, M. del Pilar García Rodríguez, V. González-Quiñones and R. Jiménez Ballesta, “Spatial Variability of Soil Quality in the Surroundings of a Saline Lake Environment,” Environmental Geology, Vol. 51, No. 1, 2006, pp. 143-149. http://dx.doi.org/10.1007/s00254-006-0317-y
- A. Bannari, A. M. Guedona, A. El-Hartib, F. Z. Cherkaouic and A. El-Ghmari, “Characterization of Slightly and Moderately Saline and Sodic Soils in Irrigated Agricultural Land using Simulated Data of Advanced Land Imaging (EO-1) Sensor,” Communications in Soil Science and Plant Analysis, Vol. 39, No. 19-20, 2008, pp. 2795-2811. http://dx.doi.org/10.1080/00103620802432717
- H. Q. Liu and A. Huete, “A Feedback Based Modification of the NDVI to Minimize Canopy Background and Atmospheric Noise,” IEEE Transactions on Geoscience and Remote Sensing, Vol. 33, No. 2, 1995, pp. 457-465. http://dx.doi.org/10.1109/36.377946
- D. Wang, C. Wilson and M. C. Shannon, “Interpretation of Salinity and Irrigation Effects on Soybean Canopy Reflectance in Visible and Near-Infrared Spectrum Domain,” International Journal of Remote Sensing, Vol. 23, No. 5, 2002, pp. 811-824. http://dx.doi.org/10.1080/01431160110070717
- A. R. Huete, “A Soil-Adjusted Vegetation Index (SAVI),” Remote Sensing of Environment, Vol. 25, No. 3, 1988, pp. 295-309. http://dx.doi.org/10.1016/0034-4257(88)90106-X
- M. S. Alhammadi, “Using QuickBird Satellite Images to Study the Salinity Effect on Date Palm Field,” International Congress Geotunis 2010, Tunis, 29 November-3 December 2010, pp. 1-6.
- A. K. Koshal, “Indices Based Salinity Areas Detection through Remote Sensing and GIS In Parts of South Waste Punjab,” 13th Annual International Conference and Exibition on Geospatial Information Technology and Applications, Gurgaon, 2010.
- A. Masoud and K. Koike, “Arid Land Salinization Detected by Remotely-Sensed Landcover Changes: A Case Study in the Siwa Region, NW Egypt,” Journal of Arid Environments, Vol. 66, No. 1, 2006, pp. 151-167. http://dx.doi.org/10.1016/j.jaridenv.2005.10.011
- D. Major, F. Baret and G. Guyot, “A Ratio Vegetation Index Adjusted for Soil Brightness,” International Journal of Remote Sensing, Vol. 11, No. 5, 1990, pp. 727-740. http://dx.doi.org/10.1080/01431169008955053
- N. M. Khan, V. V. Rastoskuev, Y. Sato and S. Shiozawa, “Assessment of Hydrosaline Land Degradation by Using a Simple Approach of Remote Sensing Indicators,” Agricultural Water Management, Vol. 77, No. 1, 2005, pp. 96-109. http://dx.doi.org/10.1016/j.agwat.2004.09.038
- A. Abbas and S. Khan, “Using Remote Sensing Techniques for Appraisal of Irrigated Soil Salinity,” In: L. Oxley and D. Kulasiri, Eds., International Congress on Modelling and Simulation (MODSIM), Modelling and Simulation Society of Australia and New Zealand, Brighton, 2007, pp. 2632-2638.
- A. Vidal, P. Maure, H. Durand and P. Strosser, “Remote Sensing Applied to Irrigation System Management: Example of Pakistan,” EURISY Colloquium: Satellite Observation for Sustainable Development in the Mediterranean Area, Paris, 1996, pp. 132-142.
- B. Vincent, A. Vidal, D. Tabbet, A. Baqri and M. Kuper, “Use of Satellite Remote Sensing for the Assessment of Water Logging or Salinity as an Indication of the Performance of Drained Systems,” 16th Congress on Irrigation and Drainage, Cairo, 15-22 September 1996, pp. 203-216.
- M. Bouaziz, J. Matschullat and R. Gloaguen, “Improved Remote Sensing Detection of Soil Salinity from a SemiArid Climate in Northeast Brazil,” Comptes Rendus Geoscience, Vol. 343, No. 11-12, 2011, pp. 795-803.
- X. Fan, B. Pedroli, G. Liu, Q. Liu, H. Liu and L. Shu, “Soil Salinity Development in the Yellow River Delta in Relation to Groundwater Dynamics,” Land Degradation & Development, Vol. 23, No. 2, 2012, pp.175-189.
- M. Sethi, D. S. Bundela, M. Sethi, K. Lal and S. K. Kamra, “Remote Sensing and Geographic Information System for Appraisal of Salt-Affected Soils in India,” Journal of Environmental Quality, Vol. 39, No. 1, 2010, pp. 5-15. http://dx.doi.org/10.2134/jeq2009.0032
- T. J. Schmugge, W. P. Kustas, J. C. Ritchie, T. J. Jackson and A. Rango, “Remote Sensing in Hydrology,” Advances in Water Resources, Vol. 25, No. 8-12, 2002, pp. 1367- 1385.
- O. Dewitte, A. Jones, H. Elbelrhiti, S. Horion and L. Montanarella, “Satellite Remote Sensing for Soil Mapping in Africa An Overview,” Progress in Physical Geography, Vol. 36, No. 4, 2012, pp. 514-538. http://dx.doi.org/10.1177/0309133312446981
- H. A. Ghrefat, P. C. Goodell, B. E. Hubbard, R. P. Langford and R. E. Aldouri, “Modeling Grain Size Variations of Aeolian Gypsum Deposits at White Sands, New Mexico, Using AVIRIS Imagery,” Geomorphology, Vol. 88, No. 1-2, 2007, pp. 57-68. http://dx.doi.org/10.1016/j.geomorph.2006.10.013
- A. L. Kaleita, L. F. Tian and M. C. Hirschi, “Relationship between Soil Moisture Content and Soil Surface Reflectance,” Transactions of the ASAE, Vol. 48, No. 5, 2005, pp. 1979-1986. http://dx.doi.org/10.13031/2013.19990
- J. Ding, M.-C. WU and T. Tiyip, “Study on Soil Salinization Information in Arid Region Using Remote Sensing Technique,” Agricultural Sciences in China, Vol. 10, No. 3, 2011, pp. 404-411. http://dx.doi.org/10.1016/S1671-2927(11)60019-9
- Y. Tashi, P. C. Chamard, M.-F. Courel, T. Tiyip, Y. Tuerxun and S. Drake, “The Recent Evolution of the Oasis Environment in the Taklimakan Desert, China,” In: Water and Sustainability in Arid Regions, Springer, Netherlands, 2010, pp. 51-74.
- V. Mulder, S. de Bruin, M. E. Schaepman and T. R. Mayr, “The Use of Remote Sensing in Soil and Terrain Mapping—A Review,” Geoderma, Vol. 162, No. 1-2, 2011, pp. 1-19. http://dx.doi.org/10.1016/j.geoderma.2010.12.018
- B. Mougenot, M. Pouget and G. F. Epema, “Remote Sensing of Salt Affected Soils,” Remote Sensing Reviews, Vol. 7, No. 3-4, 1993, pp. 241-259. http://dx.doi.org/10.1080/02757259309532180
- E. Cloutis, “Review Article Hyperspectral Geological Remote Sensing: Evaluation of Analytical Techniques,” International Journal of Remote Sensing, Vol. 17, No. 12, 1996, pp. 2215-2242.
- M. Sethi, G. S. Dasog, A. Van Lieshoutc and S. B. Salimathd, “Salinity Appraisal Using IRS Images in Shorapur Taluka, Upper Krishna Irrigation Project, Phase I, Gulbarga District, Karnataka, India,” International Journal of Remote Sensing, Vol. 27, No. 14, 2006, pp. 2917-2926. http://dx.doi.org/10.1080/01431160500472062