American Journal of Analytical Chemistry
Vol. 3 No. 1 (2012) , Article ID: 16793 , 9 pages DOI:10.4236/ajac.2012.31010
Fast-GC Quantification of Harmonine, the Major Defense Alkaloid of the Multicolored Asian Ladybird Harmonia axyridis (Pallas)
1Department of Analytical Chemistry, Gembloux Agro-Bio Tech, Liège University, Liège, Belgium
2Department of General and Organic Chemistry, Gembloux Agro-Bio Tech, Liège University, Liège, Belgium
3Department of Biological and Industrial Chemistry, Gembloux Agro-Bio Tech, Liège University, Liège, Belgium
4Department of Functional and Evolutionary Entomology, Gembloux Agro-Bio Tech, Liège University, Liège, Belgium
Email: *christophe.fischer@ulg.ac.be
Received August 16, 2011; revised November 15, 2011; accepted December 9, 2011
Keywords: Alkaloid; Harmonine; Harmonia axyridis; Fast-GC; Validation
ABSTRACT
These last few years the multicolored Asian ladybird, Harmonia axyridis (Pallas), previously introduced in Europe and North America as a biological control agent, has swiftly spread out on those territories and turns out to be a pest in several ways. In order to improve understanding of several key points of the biology of this ladybird, a novel fast-GC method of quantification of harmonine, the main defense alkaloid of H. axyridis, has been designed and validated using the accuracy profile concept for concentrations ranging from 13 to 264 µg/individual. This method allows quantifying harmonine in a single insect with a maximal error risk of 20%. For ladybirds collected in spring, mean harmonine concentration observed was 106.6 µg/individual with a very high standard deviation of 80.2 µg/individual, which can easily be explained by the strong asymmetry of the results distribution. Males and females seem equally chemically protected as the harmonine concentration did not significantly differ between sexes. This method is currently used to improve our comprehension of several key points of H. axyridis biology including aggregation behavior and aposematism.
1. Introduction
Commonly known as the multicolored Asian ladybird, Harmonia axyridis (Pallas) (Coleoptera: Coccinellidae) has been deliberately introduced in Europe and North America as a biological control agent against several insect pests including aphids. It has rapidly spread out in those territories and is now considered as a pest in several ways [1,2]. This invasive species seems to outcompete native coccinellids [3]. Hautier et al. [4] have shown significant predation on native European ladybirds by H. axyridis by studying exogenous alkaloids sequestration by this last species.
Mostly aphidiphageous, H. axyridis can nevertheless feed on several fruits including grapes. The direct impact of this feeding has not yet been quantified but this behavior is still problematic especially if fruits are meant to be pressed. When crushed with fruits, ladybirds release methoxypyrazines, alkaloids and other contaminants with low perception thresholds altering the quality of the product [5-7].
During the cold season, those insects can aggregate in houses by hundreds leading to annoyance and allergies [1].
Like a large number of coccinellids species H. axyridis is aposematic, warning potential enemies of its toxicity by using various signals. In this case, signals are visual (red and black elytra pattern) and olfactory (methoxypyrazines). Furthermore, it is now well established that many coccinellids owe their protection, at least in part, to the presence of repellent and, in some cases, toxic alkaloids in the hemolymph emitted during reflex bleeding [8,9]. The main defense compound in H. axyridis is the harmonine (Figure 1) [(17R,9Z)-1,17-diaminooctadec-9- ene], a linear alkaloid [10].
Unlike most aposematic insects, H. axyridis presents
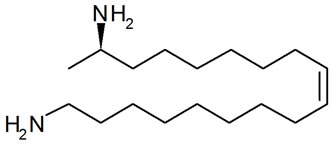
Figure 1. Harmonine [(17R,9Z)-1,17-diaminooctadec-9-ene], H. axyridis main defense alkaloid.
very variable signals. That variability is not not yet fully understood [1,2,11,12].
Few methods suitable to quantify harmonine in one single insect have been validated to date. They include a liquid/liquid purification (methanol or methanol/water 9:1/hexane) of the insect extract. This purified extract is then derivatized by different means (N-methyl-bis trifluoroacetamid; bis-(trimethylsilyl)-trifluoaroacetamid, …) to allow GC quantification [12-14]. Haulotte (2007) [15] proposed a harmonine purification process using alumina columns. To avoid liquid/liquid purification on such small samples, which could be tricky and cause losses, that last method has been chosen and adapted for quantitative extraction from one single insect. Derivatization by acetylation has been chosen for the great stability of the amide product formed.
This paper describes the validation, by accuracy profile, of an original fast-GC method allowing harmonine quantification in a single insect. The use of fast GC enables a ten-fold faster analysis than with classical GC. This method will be used in further studies aiming to improve our understanding of several key points of the biology of this ladybird species, including aggregation mechanisms, aposematism, and intraguild predation.
2. Material and Methods
2.1. Origin of Chemicals and Biological Material
2.1.1. Chemicals and Reagents
Dichloromethane (HPLC grade, stabilized by 0.4% methanol) and methanol (HPLC grade) were purchased from Acros Organics (Geel, Belgium). Acetone (HPLC grade), pyridine (99+ ACS reagent), n-tetracosane (approx. 99%) and 1,12-diaminododecane (98%) were purchased from Sigma-Aldrich (Bornem, Belgium). Ammonia (28%), nhexane (96%) and acetic anhydride were purchased from VWR (Leuven, Belgium).
2.1.2. Biological Material
H. axyridis used for harmonine standard production were collected aggregated during winter 2008-2009 in the vicinity of Gembloux (Belgium) and stored at –80˚C until use.
For the study, adults of H. axyridis were collected in surroundings of Gembloux and Louvain-la-Neuve (Belgium) on fields during spring. They were quickly placed in 1 mL of methanol, avoiding any loses of hemolymph and kept at 4˚C until sample preparation.
2.2. Harmonine Standard Production
At the present time harmonine is not commercially available. An extraction and purification method based upon [10,12,15-18] has therefore been set up to obtain calibration and validation standards. In order to ensure the nature and purity of that purified harmonine, it has been characterized by GC-MS and NMR prior to its utilization as a standard.
2.2.1. Harmonine Extraction and Purification
During the optimization of the method, the composition of the recovered fractions has been monitored by thin layer chromatography (TLC) using Polygram Alox N/UV254 (0.2 mm aluminium oxide with fluorescent indicator; Macherey-Nagel) eluted with a mixture of dichlorometha-ne/methanol/ammonia 7:3:0.2 v/v/v and Polygram Sil G/UV254 (0.25mm silica gel with fluorescent indicator, Macherey-Nagel) eluted with a mixture of ethyl acetate/methanol/ammonia 7:3:0.2 v/v/v. These TLC have been non-selectively revealed by iodine vapors. The iodine was then removed by a brief stay at 105˚C and the TLC was revealed again with the Dragendorff reagent (Stahl, 1969) for alkaloid detection.
Under these conditions, Rf of harmonine are of 0.85 and 0.86 for alumina oxide and for silica, respectively.
For each production batch, 100 ladybirds have been crushed in 10 mL methanol using an Ultra-turrax (IKA T18 Basic). The extract was then filtrated on fritted glass and the particles rinsed ten times by 10 mL methanol. The solvent was then evaporated at 50˚C under vacuum using a Büchi rotary evaporator.
The extract was then purified over 6g of neutral aluminium oxide (70 - 230 mesh, from Merck) previously conditioned overnight at 650˚C and packed in a glass column (1 cm I.D.; glass wool plug at the bottom) with dichloromethane. The extract was first eluted with dichloromethane (24 mL) until removal of all visible mobile pigments (mostly carotenoids). The column was then eluted by 40 mL methanol collected in 2 mL fractions. Composition of impurities varying from batch to batch, each fraction had to be analyzed by TLC under the conditions previously described. Positive and pure fractions were pooled and the solvent evaporated at 50˚C under vacuum using a Büchi rotary evaporator; other fractions were discarded.
This purified extract was then acetylated overnight at 60˚C by adding a mixture of pyridine/acetic anhydride 1:1 v/v (5 mL). The excess of reagent was then eliminated by adding 5 mL of distilled water. Crude N,Ndiacetylharmonine was extracted using five volumes of 5 mL of dichloromethane. The solvent was evaporated and the residue solubilized in 3 mL of ethyl acetate.
This solution has been purified a second time on 4 g of silica gel (70 - 230 mesh, Macherey-Nagel) packed in a glass column (1 cm I.D., glass wool plug on the bottom) with ethyl acetate. The solution was first eluted by 20 mL ethyl acetate; then by 50 mL ethyl acetate/methanol 9:1 v/v collected in 2 mL fractions. Each fraction has been analyzed by TLC and pure N,N-diacetylharmonine con taining fractions were pooled and evaporated at 50˚C under vacuum using a Büchi rotary evaporator.
2.2.2. N,N-Diacetylharmonine Characterization
Before being used as standard, purified N,N-diacetylharmonine has been characterized by mass spectrometry and nuclear magnetic resonance to ensure nature of the purified product.
2.2.2.1. GC-MS
The GC-MS analyses have been conducted on a 6890N Agilent GC system coupled with a 5973 Mass Selective Detector (Agilent Technologies) using the following conditions: injection: splitless at 320˚C, 1 µL injected; column: Varian FactorFour VF-5 ms 30 m × 0.25 mm DF = 0.25 µm; vector gas: He at 1.29 mL/min; temperature program: 40˚C held for 2 min, ramp at 10˚C/min to 320˚C held 20 min; MS conditions: EI mode at 70 eV, 200˚C, scanned mass range: m/z = 30 to m/z = 400.
The mass spectrum of N,N-diacetylharmonine is described in Table 1.
2.2.2.2. NMR
The NMR spectra (1H, 13C, COSY, HMBC, and HMQC) recorded in DMSO-d6 (Sigma Aldrich, 99.9%) at 600 MHz (1H) or 150 MHz (13C) with a Varian Unity 600 instrument, are reported in ppm on the δ scale and are referenced by the residual solvent peaks.
Data are reported in Figure 2: chemical shift, multiplicity (s: singlet, bs: broad singlet, d: doublet, q: quartet, m: multiplet), coupling constant in Hz.
2.3. Samples Preparation
The standard extraction and purification method has been adapted to the quantitative extraction of harmonine of one single insect.
The ladybird and its 1 mL storage methanol were first transferred in a sovirel tube and crushed finely.
The solution was then filtered on a glass wool plug placed in a Pasteur pipette. The crushing and filtering system were rinsed by two volumes of 1 mL and then three times using 0.5 mL of methanol. The two last rinsing fractions were GC harmonine-free and used only as security. Solvent was blown out the glass wool plug between each rinse. Filtrate and rinsing fractions have been collected in a 10 mL conical flask and the solvent evaporated at 50˚C under vacuum using a Büchi rotary evaporator.
The extract was then purified on 0.6 g aluminium oxide packed with dichloromethane in a Pasteur pipette with a plug of glass wool on the bottom. These little columns were closed until the beginning of the elution by pinning the top of the pipette in a little cork previously cleaned overnight in dichloromethane. Dry extract was solubilized in 200 µL dichloromethane and introduced on the column which was eluted by two times 1 mL dichloromethane, and two times 2 mL plus 1 mL of a mixture of
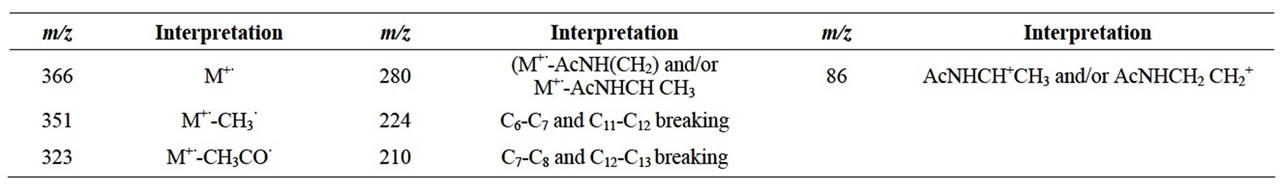
Table 1. N,N-diacetylharmonine MS fragmentation.
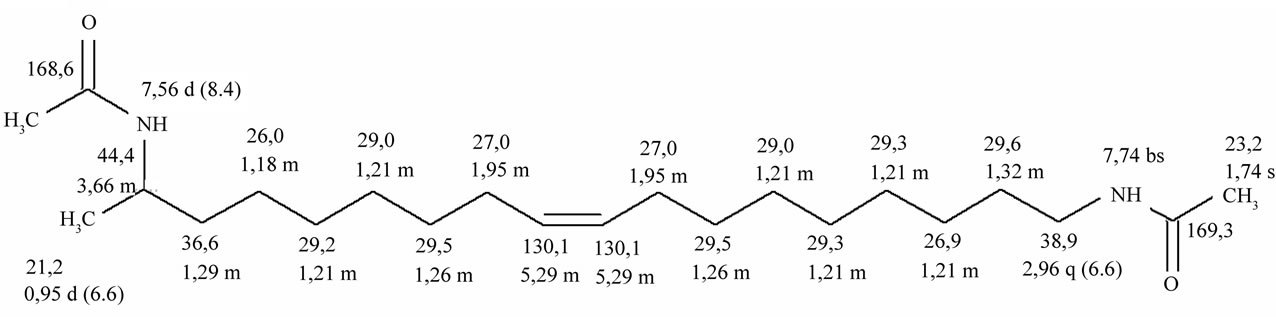
Figure 2. NMR data for N,N-diacetylharmonine. 1H (grey): chemical shift, multiplicity (s: singlet, bs: broad singlet, d: doublet, q: quartet, m: multiplet), coupling constant in Hz; 13C (black): chemical shift. For acquisition conditions, see text.
dichloromethane/methanol/ammonia 8:2:0.2 v/v/v. Before being used as eluent, each solvent fraction was first used to rinse the sample flask to collect any trace of harmonine possibly left. Dichloromethane fractions were discarded; other collected eluent were pooled and evaporated.
Dry residue was acetylated at 60˚C for at least 3 hours by adding a mixture of pyridine/acetic anhydride 1:1 v/v (200 µL). Previous experiments had shown that the reaction is complete in less than two hours (>99.9% of reagent acetylated) and the N,N-diacetylharmonine is stable in this reagent mix for at least three days.
The reagent excess was then eliminated by adding 200 µL methanol and all solvents were evaporated under a gentle stream of nitrogen.
Finally dry residue was solubilized in 1.5 mL acetone and 15 µL of internal standard solution were added (ntetracosane in hexane, 1 µg/µL). Samples were stored at 4˚C and analyzed within four days. Preliminary studies have shown stability of diacetylharmonine solutions in acetone at 4˚C for at least 12 days.
2.4. Samples Analysis
Samples were then analyzed using Fast GC, enabling analyses five to ten fold faster than classical GC without loosing resolution. Those analyses were conducted on a Thermo Ultra Fast Trace GC chromatograph operated with a split/splitless injector and a Thermo AS 3000 autosampler (Thermo Electron Corp., Interscience, Louvain-la-Neuve, Belgium). Analysis conditions were as follows: injection: splitless at 320˚C, 1 µL injected; column: Thermo Electron Corporation Ph 55 m × 0.1 mm DF: 0.1 µm; vector gas: He at 0.5 mL/min; temperature program: 60˚C held for 0.5 min, ramp at 80˚C/min to 320˚C held 1 min; Fast-FID: 320˚C, H2: 35 mL/min, Air: 350 mL/min, N2: 30 mL/min, sampling frequency: 300 Hz. These conditions have been optimized for a good resolution of harmonine and internal standard (IS).
Diacetylated 1,12-diaminododecane, structurally close to diacetylharmonine, was firstly tested as IS. Nevertheless its purity was not homogenous within a batch, its resolution was not satisfying, this compound being coeluted with frequently observed non target compounds, and under used analytical conditions, peaks were strongly tailing. n-Tetracosane has therefore been chosen as IS because of its good peak symmetry and its good resolution from all non target compounds left by the purification and the derivatization process.
Figure 3 shows a chromatogram obtained for harmonine standard with IS.
2.5. Fast-GC Method Calibration and Validation
2.5.1. Theoretical Basis
Validation has been performed using the accuracy profile concept on concentrations ranging from 10 µg/mL to 250 µg/mL in acetone; n-tetracosane being used as IS at 10 µg/mL for each level of validation and calibration concentration. This validation method widely described in the literature [19-23] can be summarized as follows:
• Analyzing at least three calibration series. Drawing calibration curves and verifying suitability of the chosen regression model on basis of the correlation coefficient (r²) as described in 2.5.2.
• Analyzing at least three validations series. Calculating concentrations using regression equation obtained in the first step.
• Determining the linearity of the method by plotting calculated validation concentrations versus theoretical concentration. The slope of the regression line and the correlation coefficient (r²) should be as close of one as possible.
• Estimating the trueness, i.e. determining the mean bias for each concentration level which corresponds to the systematic error.
• Calculating repeatability and intermediate precision for each concentration level which correspond to the random error.
• Calculating the tolerance limits (β-expectation tolerance interval) for the mean bias at each concentration level.
• Plotting the accuracy profile as the mean bias, the tolerance and acceptance limits in function of the concentration, in relative values. This accuracy profile summarizes in one plot every validation elements, giving a graphical representation of the error risk for each concentration on the validated range. This procedure gives a precise estimation of the accuracy of the analytical method and determines the LOQ according to the maximum error risk accepted. For further information on this validation method, please see references [19-23].
In order to allow comparisons with more “classical” validation methods, this method has also been validated by comparing LOD, LOQ, linearity, trueness and fidelity to widely accepted limits.
2.5.2. Validation
Three calibration series of three replicates at six concentration levels (see Table 2) were prepared on three separated days and analyzed using conditions described in paragraph 2.4. For each calibration series, curve was obtained by plotting the ratio of harmonine area/IS area versus theoretical harmonine concentration. The least square fit analysis has been used and the mathematical model obtained judged satisfactory when correlation coefficient (r²) was higher than 0.996.
Three validation series of three replicates of five concentration levels (see Table 2) were prepared on three
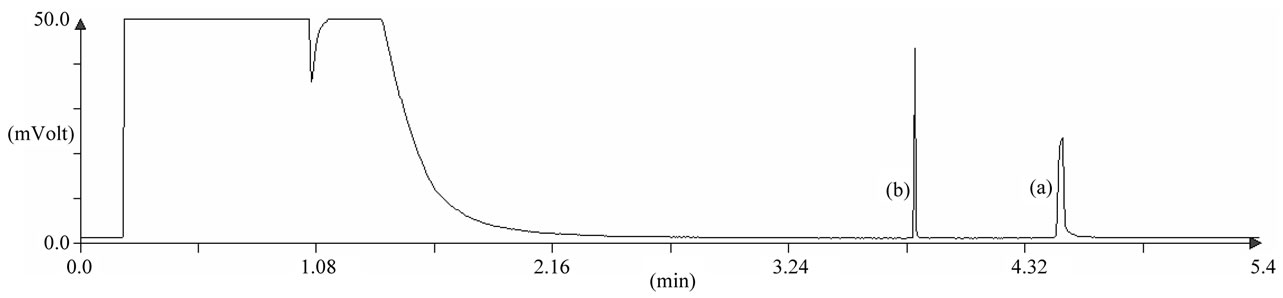
Figure 3. Chromatogram of (a) purified N,N-diacetylharmonine (50 µg/mL) and (b) internal standard (n-tetracosane, 10 µg/mL) analyzed with optimized fast GC method. For analysis conditions, see text.
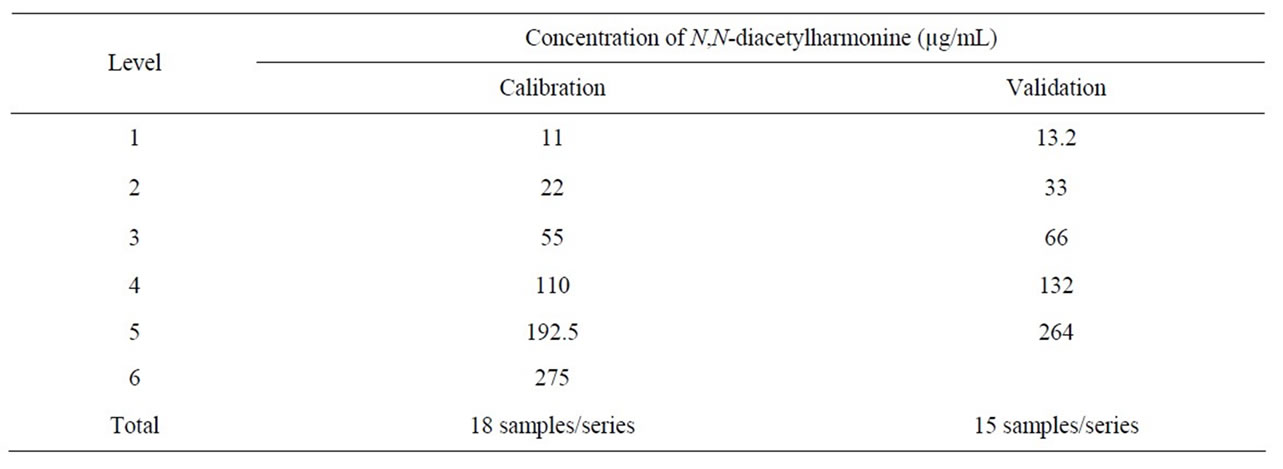
Table 2. Concentrations of calibration and validation standards for N,N-diacetylharmonine.
separated days and treated as real sample on fast GC.
On basis of those results, validation parameters were calculated.
3. Results and Discussion
In order to develop a novel harmonine quantification method by fast-GC, this alkaloid has firstly been extracted and purified from H. axyridis. This purified extract has first been characterized by GC-MS and NMR to ensure its nature and purity, then used as calibration and validation standard for a fast-GC quantification method. FastGC enables very short analysis times (less than five minutes). Using this method, harmonine has then been quantified in ladybirds collected in spring. This method will be used in further studies aiming to improve our understanding of several key points of the biology of this ladybird species, including aggregation mechanisms, aposematism, and intraguild predation.
3.1. Standard Production and Characterization
For each batch, about 4 mg of N,N-diacetylharmonine were produced with a GC-FID purity of 100% (Figure 3). These standards were stored at –20˚C until use.
Mass spectrometry and nuclear magnetic resonance analyses confirmed the identity of the standard compound (Table 1 and Figure 2).
3.2. Validation by Accuracy Profile Concept and Comparison with a Classical Method
3.2.1. Calibration Curve
For all calibration series, a calibration curve has been constructed using six concentration levels. Calibration data are shown in Table 3. The linear regression model has been selected and validated in each case with a correlation coefficient (r²) higher than the 0.996 limit. From 100 µg/mL, peaks width and asymmetry increase greatly. Nevertheless it does not seem to alter method performances as shown in next paragraphs.
3.2.2. Linearity
The linearity of an analytical method is the ability within a given range to obtain results that are directly proportional to the concentrations of analytes in the sample [20]. Here, linearity was determined by plotting calculated validation concentrations versus theoretical concentrations (Table 3). The adjusted regression line presented a correlation coefficient of 0.9985 and a slope of 1.0072 meaning that responses are strictly proportional to the introduced concentrations.
3.2.3. Estimation of Trueness
The trueness of an analytical method expresses the clo-
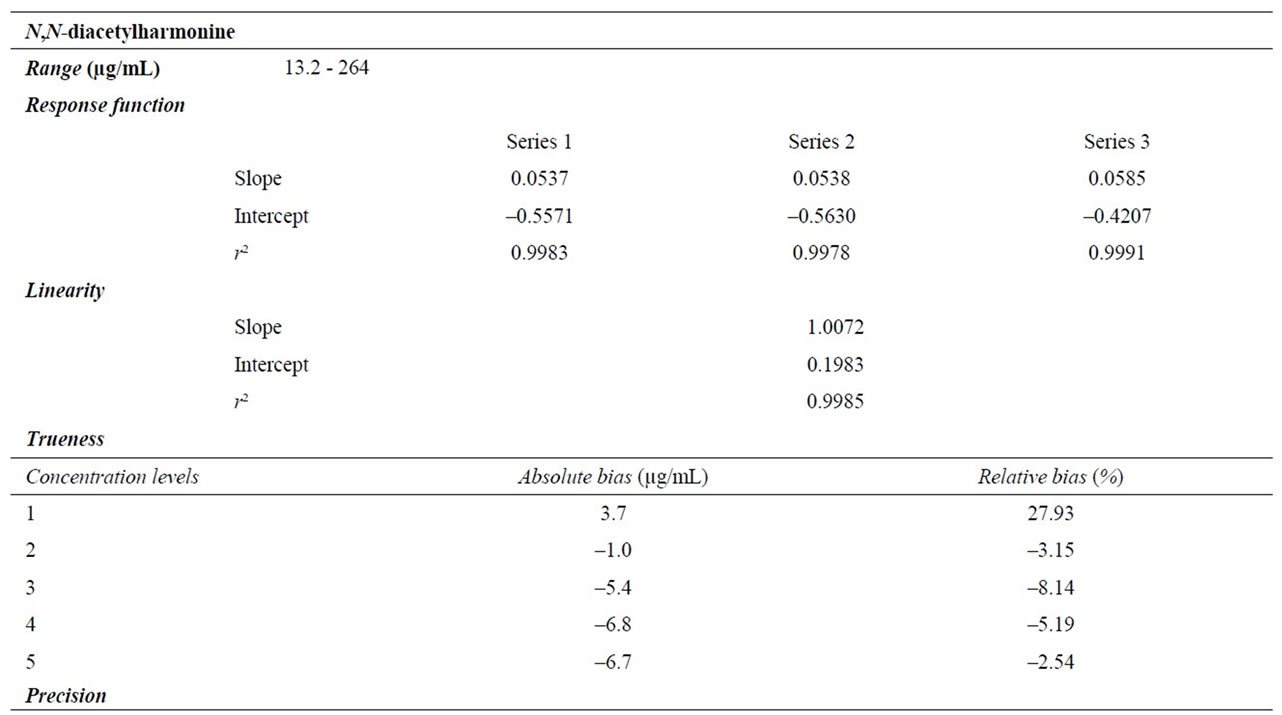
Table 3. Validation results.
seness of agreement between the mean value of a series of measurement and the reference value [20]. In this paper, trueness is expressed in term of absolute and relative bias. Observed values are shown in Table 3.
According to Roland [24], the relative bias must be smaller than 10% which is observed for all concentration levels except the first one, 13.2 µg/ml.
3.2.4. Estimation of Precision
The precision expresses the closeness of agreement between series of measurement of the same sample [20]. In this paper, precision is presented in terms of repeatability (same operator, same analytical procedure, and same day) and intermediate precision (same operator, same analytical procedure, and different day) expressed by relative standard deviations (RSDs %). Table 3 presents precision observed for each concentration level and AOAC (2006) acceptance limits. Obtained results are well below those limits within the tested range.
3.2.5. Accuracy Profile
The accuracy of an analytical procedure expresses the closeness of agreement between a single measured value and the reference value. The accuracy profile integrates in one simple graph in a statistically correct way all essential elements of a validation procedure i.e. bias, precision, maximal tolerated error and limits of quantification according to this accepted risk.
The accuracy profile is presented in Figure 4. The central solid line represents the relative bias. The two dashed lines are the 95% β-expectation limits. The risk that future expected results will fall outside these limits is below 5%. Finally, the two dotted lines are the acceptance limits, fixed at 20%. The method is considered as accurate when the β-expectation limits are comprised between the acceptance limits. The intersection between those curves is the limit of quantification (LOQ) for the accepted maximal error. This limit is of 28 µg/mL for acceptance limits fixed at 20%. This analytical method is therefore validated for concentrations ranging from 28 µg/mL to 264 µg/mL with a maximal error of 20%.
3.2.6. Limits of Detection and Quantification
The limit of detection is here defined as the lower concentration producing a signal higher than the dispersion of the signal of a blank sample multiplied by a security factor. In order to define LOD, 8 blank samples were analyzed. Mean retention time of harmonine and mean peak width at mid height have been determined from the analysis of nine 50 µg/mL samples. Signal has been measured on each blank chromatogram on a range of five times the mean peak width on either side of the mean retention time. Security factor used was 3. The LOD obtained was 9.5 µg/mL.
Conventionally the LOQ is defined as two times the LOD obtained by this way; which gives a LOQ of 19 µg/mL. This value is not accompanied with any information on the accuracy of the method at the LOQ. Moreover this LOQ is well below the LOQ found by the accuracy profile, which shows limits of classical validation procedures.
3.3. Quantification of Harmonine in H. axyridis Collected in Spring
Seventy seven ladybirds collected in spring have been analyzed. Figure 5 shows a typical chromatogram of purified H. axyridis extract. Results are presented on Figure 6. Ladybirds were sexed following McCornack method [25]. No significant differences have been observed between males and females (t-test, p-value = 0.964). Mean harmonine concentration was 106.6 µg/individual with a standard deviation of 80.2 µg/individual. However these parameters should be taken cautiously considering the strong asymmetry of the distribution (see Figure 5).
4. Conclusions
Fast-GC analyses have shown a great potential to rapidly and accurately quantify harmonine in ladybirds. The harmonine quantification method has been validated using the concept of accuracy profile proposed by the SFSTP guidelines for analytical methods and compared
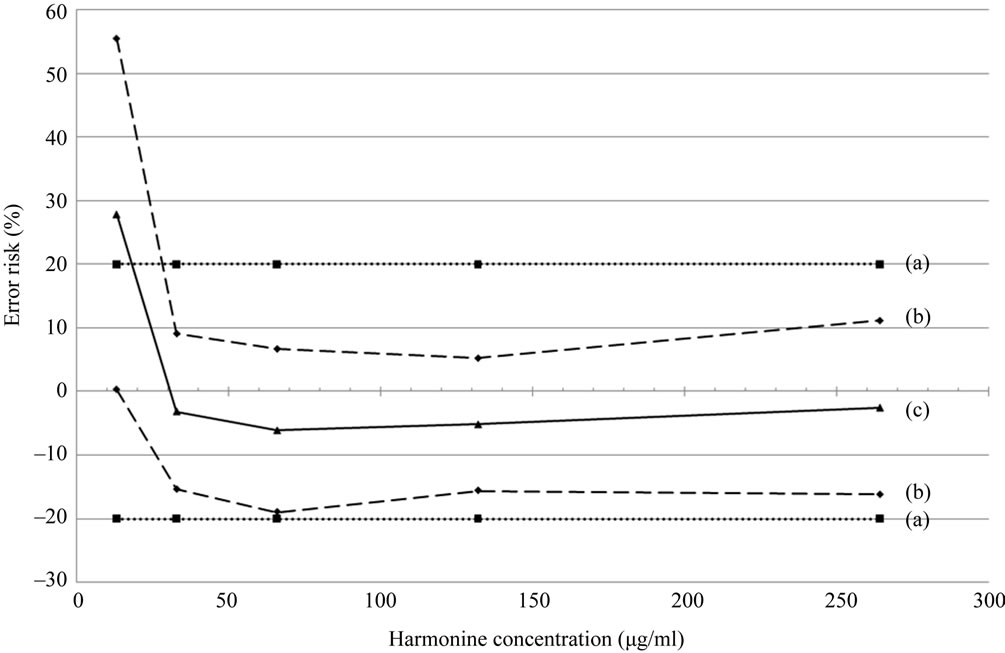
Figure 4. Accuracy profile of N,N-diacetylharmonine quantification method considering a linear regression model with a risk of 5%. (a) Acceptance limits; (b) 95% β-expectation limits; (c) relative bias.
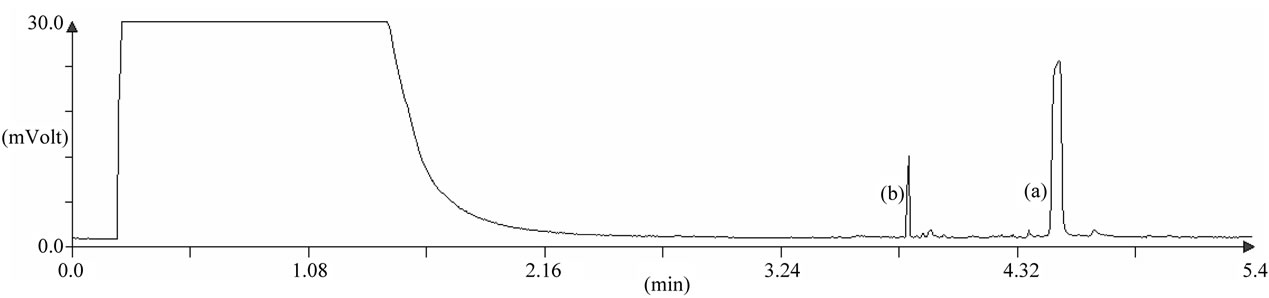
Figure 5. Chromatogram of purified H. axyridis extract analyzed with optimized fast GC method. (a) N,N-diacetylharmonine and (b) internal standard.
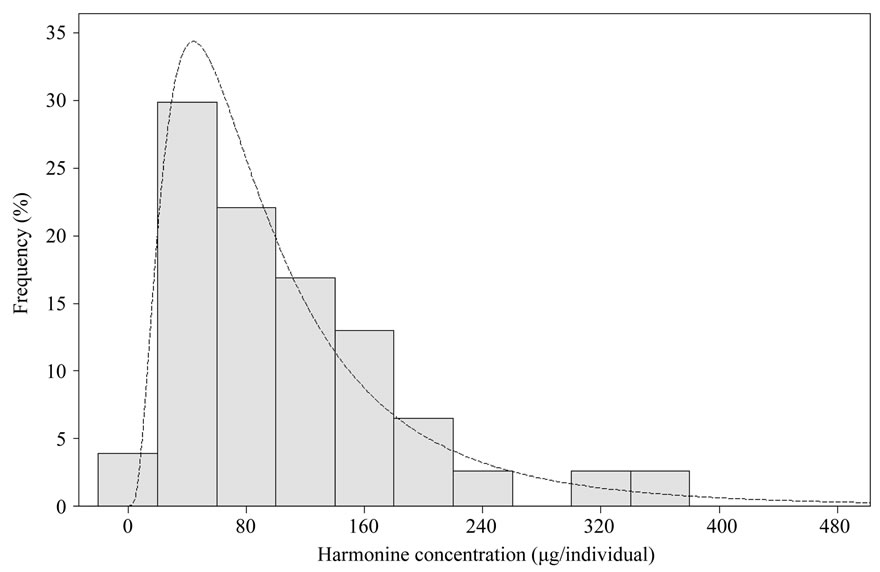
Figure 6. Distribution of harmonine concentration in 77 H. axyridis collected during spring. This distribution follows a lognormal distribution (dashed line).
to a more classical validation using widely accepted parameters. The accuracy profile concept revealed itself to be stricter than classical validation methods. This method presents the advantage of giving information about the maximal error risk and do not require the use of arbitrary norms.
This developed harmonine fast-GC quantification method has been used to analyze alkaloid content in Harmonia axyridis and will be used in further studies aiming to improve understanding of several key points of the biology of this ladybird, including aggregation mechanism, aposematism, and predation by other coccinellids.
5. Acknowledgements
The authors are grateful to P. Hacourt (BEAGx), V. Hote and D. Trisman (Department of General and Organic Chemistry, GxABT) for their precious technical contribution all along this research.
Christophe Fischer is financially supported by a PhD grant from the Fonds pour la formation à la Recherche dans l’Industrie et dans l’Agriculture (FRIA) (Belgium).
REFERENCES
- R. L. Koch, “The Multicolored Asian Lady Beetle, Harmonia axyridis: A Review of Its Biology, Uses in Biological Pest Control, and Non-Target Impacts,” Journal of Insect Science, Vol. 3, No. 32, 2003, p. 16.
- A. Pervez and Omkar, “Ecology and Biological Control Application of Multicoloured Asian Ladybird, Harmonia axyridis: A Review,” Biocontrol Science and Technology, Vol. 16, No. 2, 2006, pp. 111-128. doi:10.1080/09583150500335350
- J. K. Pell, J. Baverstock, H. E. Roy, R. L. Ware and M. E. N. Majerus, “Intraguild Predation Involving Harmonia axyridis: A Review of Current Knowledge and Future Perspectives,” Biomedical and Life Sciences, Vol. 53, No. 1, 2008, pp. 147-168.
- L. Hautier, J.-C. Grégoire, J. de Schauwers, G. San Martin, P. Callier, J.-P. Jansen and J.-C. de Biseau, “Intraguild Predation by Harmonia axyridis on Coccinellids Revealed by Exogenous AlkaloidSequestration,” Chemoecology, Vol. 18, No. 3, 2008, pp. 191-196. doi:10.1007/s00049-008-0405-4
- L. Cai, J. A. Koziel and M. E. O’Neal, “Determination of Characteristic Odorants from Harmonia axyridis Beetles Using in Vivo Solid-Phase Microextraction and Multidimensional Gas Chromatography-Mass Spectrometry-Olfactometry,” Journal of Chromatography A, Vol. 1147, No.1 , 2007, pp. 66-78. doi:10.1016/j.chroma.2007.02.044
- E. Cudjoe, T. B. Wiederkehr and I. D. Brindle, “Headspace Gas Chromatography-Mass Spectrometry: A Fast Approach to the Identification and Determination of 2- alkyl-3-methoxypyrazine Pheromones in Ladybugs,” Analyst, Vol. 130, No. 4, 2005, pp. 152-155. doi:10.1039/b410659h
- C. Ross, H. Fergusson, M. Keller, D. Walsh, K. Weller and S. Spayd, “Determination of Ortho-Nasal Aroma Threshold for Multicolored Asian Lady Beetle in a Concord Grape Juice,” Journal of Food Quality, Vol. 30, No. 6, 2007, pp. 855-863. doi:10.1111/j.1745-4557.2007.00135.x
- P. Laurent, J.-C. Braekman and D. Daloze, “Insect Chemical Defense,” Topics in Current Chemistry, Vol. 240, 2005, pp. 167-229.
- P. Laurent, J.-C. Braekman, D. Daloze and J. M. Pasteels, “Biosynthesis of Defensive Compounds from Beetles and Ants,” European Journal of Organic Chemistry, Vol. 2003, No. 15, 2003, pp. 2733-2743. doi:10.1002/ejoc.200300008
- N. Alam, I. S. Choi, K.-S. Song, J. Hong, C. O. Lee and J. H. Jung, “A New Alkaloid from Two Coccinellid Beetles Harmonia axyridis and Aiolocaria hexaspilota,” Bulletin of the Korean Chemical Society, Vol. 23, No. 3, 2002, pp. 497-499.
- T. Guilford, C. Nicol, M. Rothschild and B. P. Moore, “The Biological Roles of Pyrazines: Evidence for a Warning Odour Function,” Biological Journal of the Linnean Society, Vol. 31, No. 2, 1987, pp. 113-128. doi:10.1111/j.1095-8312.1987.tb01984.x
- A. L. Bezzerides, K. J. McGraw, R. S. Parker and J. Husseini, “Elytra Color as a Signal of Chemical Defense in the Asian Ladybird Beetle Harmonia axyridis,” Behavioral Ecology and Sociobiology, Vol. 61, 2007, pp. 1401- 1408. doi:10.1007/s00265-007-0371-9
- Y. Kajita, J. J. Obrycki, J. J. Sloggett and K. F. Haynes, “Intraspecific Alkaloid Variation in Ladybird Eggs and Its Effects on Conand Hetero-Specific Intraguild Predators,” Oecologia, Vol. 163, No. 2, 2010, pp. 313-322. doi:10.1007/s00442-009-1551-2
- J. J. Sloggett, J. J. Obrycki and K. F. Haynes, “Identification and Quantification of Predation: Novel Use of Gas Chromatography-Mass Spectrometric Analysis of Prey Alkaloid Markers,” Functional Ecology, Vol. 23, No. 2, 2009, pp. 416-426. doi:10.1111/j.1365-2435.2008.01492.x
- E. Haulotte, “Biosynthèse D’Alcaloïdes Défensifs de Coccinellidae,” PhD Dissertation, Université Libre de Bruxelles, Bruxelles, 2007.
- J. M. Pasteels, C. Deroe, B. Tursch, J.-C. Braekman, D. Daloze and C. Hootele, “Distribution et Activité des Alcaloïdes Défensifs des Coccinellidae,” Journal of Insect Physiology, Vol. 19, No. 9, 1973, pp. 1771-1779. doi:10.1016/0022-1910(73)90046-2
- M. Braconnier, J.-C. Braekman, D. Daloze and J. M. Pasteels, “(Z)-1,17-diaminooctadec-9-ene, a Novel Aliphatic Diamine from Coccinellidae,” Cellular and Molecular Life Sciences, Vol. 41, No. 4, 1984, pp. 519-520. doi:10.1007/BF01966179
- G. C. Lognay, J.-L. Hemptinne, F. Y. Chan, C. Gaspar, M. Marlier, J.-C. Braekman, D. Daloze and J. M. Pasteels, “Adalinine, a New Piperidine Alkaloid from the Ladybird Beetles Adalia bipunctata and Adalia decempunctata,” Journal of Natural Products, Vol. 59, No. 5, 1996, pp. 510-511. doi:10.1021/np960129f
- P. Hubert, P. Chiap, J. Crommen, B. Boulanger, E. Chapuzet, N. Mercier, S. Bervoas-Martin, P. Chevalier, D. Grandjean, P. Lagorce, M. Lallier, M. C. Laparra, M. Laurentie and J. C. Nivet, “The SFSTP Guide on the Validation of Chromatographic Methods for Drug Bioanalysis: From the Washington Conference to the Labratory,” Analytica Chimica Acta, Vol. 391, No. 2, 1999, pp. 135-148. doi:10.1016/S0003-2670(99)00106-3
- P. Hubert, J. Nguyen-Huu, B. Boulanger, E. Chapuzet, P. Chiap , N. Cohen, P. Compagnon, W. Dewe, M. Feinberg, M. Lallier, M. Laurentie, N. Mercier, G. Muzard, C. Nivet and L. Valat, “Validation des Procédures Analytiques Quantitatives: Harmonisation des Démarches,” STP Pharma Pratiques, Vol. 3, No. 13, 2003, pp. 101- 138.
- P. Hubert, J. Nguyen-Huu, B. Boulanger, E. Chapuzet, P. Chiap , N. Cohen, P. Compagnon, W. Dewe, M. Feinberg, M. Laurentie, N. Mercier, G. Muzard and L. Valat, “Validation des Procédures Analytiques Quantitatives: Harmonisation des Démarches. Partie II—Statistiques,” STP Pharma Pratiques, Vol. 1, No. 16, 2006, pp. 28-58.
- E. Rozet, “Improvement of the Predictive Character of Test Results Issued from Analytical Methods Life Cycle,” PhD Dissertation, Université de Liège, Liège, 2008.
- E. Rozet, A. Ceccato, C. Hubert, E. Ziemons, R. Oprean, S. Rudaz, B. Boulanger and P. Hubert, “Analysis of Recent Pharmaceutical Regulatory Documents on Analytical Method Validation,” Journal of Chromatography A, Vol. 1158, No. 1-2, 2007, pp. 111-125. doi:10.1016/j.chroma.2007.03.111
- L. Roland, “Etapes de Validation d’une Méthode de Dosage de Résidus par CPG ou HPLC,” Application Pratique de la Procédure Validana.P01, BEAGx, Gembloux, 2002.
- B. P. McCornack, R. L. Koch and D. W. Ragsdale, “A Simple Method for In-Field Sex Determination of the Multicolored Asian Lady Beetle Harmonia axyridis,” Journal of Insect Science, Vol. 7, No. 10, 2006, p. 12.
NOTES
*Corresponding author.