American Journal of Industrial and Business Management
Vol.08 No.03(2018), Article ID:83149,16 pages
10.4236/ajibm.2018.83037
The Influence of Brand Experience on People’s Revisit and Purchase Intention in the Context of China’s Museum
Boya Li
Graduate School of Chinese Academy of Social Science, Beijing, China

Copyright © 2018 by author and Scientific Research Publishing Inc.
This work is licensed under the Creative Commons Attribution International License (CC BY 4.0).
http://creativecommons.org/licenses/by/4.0/


Received: March 6, 2018; Accepted: March 17, 2018; Published: March 20, 2018
ABSTRACT
Brand experience has been considered a tactical tool that satisfies consumers’ needs and allows them to engage with the brands. Considering the global economic slowdown, China’s traditional museums are less visited and the sales of relevant products (e.g. souvenirs) are declining. With a combination of literature review and primary research, the study has drawn a positive conclusion that brand experience (sensory, affective, behavior and intellectual) can effectively motivate people’s intention to revisit and purchase in museums in China. Therefore, the study will give important implications to the insights of consumers’ experience preferences and will guide an upgraded marketing strategy for the development of museums.
Keywords:
Brand Experience, Revisit Intention, Purchase Intention, Visitor Behavior

1. Introduction
Due to the globalization and Internet development, people’s living styles have changed drastically with infiltration of multiple cultures. In nowadays China, museums, defined as institutions that “conserves a collection of artifacts and other objects of scientific, artistic, cultural, or historical importance and makes them available for public viewing through exhibits that may be permanent or temporary (Porter, 2007) [1] ”, are rarely visited and the relevant souvenirs are failing to increase sales. However, shifting from intangible culture to tangible monetary value, the sales of souvenirs can ensure museums a balance of payments and a part of maintaining fee. Few visitors have caused new challenges for museums in the field of marketing. Hence, advanced modern marketing approaches are required currently to attract more customers revisit and spend in the museum.
Today, the concept of brand experience has become of great interest in the field of marketing. Brand experience focuses on services and customer experiences instead of product-oriented sales module. It applies to all kinds of products and services because it allows people to engage and interact with brands. In comparison, traditional marketing concepts visualize customer as a rational decision-maker who thinks about the benefits and functionality features only, whereas brand experience considers human being a rational as well as an emotional decision-maker (Imran Khan & Zillur Rahman) [2] . In order to meet people’s demand for culture, culture institutions such as museums should not only provide visitors with a large quantity of high-quality cultural products, but also unique and memorable experiences.
Coal Museum of China, located in Taiyuan city, Shanxi Province, is the only national museum related to coal industry in China. Established in 1989, the museum has stored abundant of coal relics, specimen, literature and historical data. It is the center of coal science education as a full scene of the development and utilization of coal is displayed in the museum. There are seven exhibition halls in the museum, namely: coal production, coal exploitation, coal development and human being, contemporary coal industry in China, coal art, coal literature and coal trade. Besides, a simulated mine was built to let visitors fully experience coal exploitation (Coal Museum of China, 2017) [3] .
Thus, this study will take Coal Museum of China as an example, to explore whether brand experience is applicable in evoking visitors’ intention to revisit and purchase in museums. Relationship between revisit intention and purchase intention will be tested as well. Findings shall contribute a new scale to the marketing literature and could be utilized to formulate a winning branding strategy for the development of museums.
2. Literature Review
2.1. Brand Experience
In today’s life, experience is a central element. Customers are no longer only consuming products, but are more interested in the experiences provided by the products or services (Morrison and Crane, 2007) [4] . According to Schmitt (1999) [5] , there are five types of experiences: sense, feel, think, act and relate that help generate customer emotions. In 1982, Holbrook and Hirschman (1982) [6] introduced the concept of experience in the marketing literature and determined new consumption behaviors are “relate to the multi-sensory, fantasy, and emotive aspects of product use”. Since then, experience continued to influence multiple disciplines such as economics (Pine and Gilmore, 1998) [7] , consumer behavior (Addis and Holbrook, 2001) [8] , and marketing (Brakus et al., 2009) [9] .
The concept of brand experience is not a new phenomenon, it has attracted a renewed focus from academicians and practitioners of recent times (Brakus et al., 2009) [9] . Brakus (2009) [9] conceptualizes brand experience as “subjective, internal consumer responses (sensations, feelings, and cognitions) and behavioral responses evoked by brand-related stimuli that are part of a brand’s design and identity, packaging, communications, and environments.” Brand experience, while related, is quite different to concepts such as brand attitudes, brand personality, brand involvement and brand attachment (Brakus et al., 2009) [9] . Brand experience occurs when consumers use the brand, talk about the brand, seek out the brand information, promotions, events, and so on (Ambler et al., 2002) [10] . Considering the classification of experience proposed by Schmitt (1999) [5] , Brakus (2009) [9] then develops four dimensions of brand experience: Sensory, Affective, Behavioral and Intellectual experience, to visualize what customers actually experiences in relation to the brand.
・ Sensory dimension is related to sensory qualities and aesthetics, based on the five senses (sight, hearing, touch, taste and smell), e.g. the sound of activity in the open-air market, the taste of the food, the beauty of the city’s skyline, or the smell of the forest. Sensory experience can reach the rational part of a consumer’s brain and become memorable so that to create brand awareness and establish a brand image that relates to the customer’s identity, lifestyle, and personality (Hultén et al., 2009) [11] .
・ Affective dimension refers to customer feelings and emotions about a brand, such as fun, joy, pride, nostalgia or frustration. Being one dimension of brand experience, it can create emotions by making entertainment for customers, by allowing them to escape from the reality, by educating them and giving them aesthetic objects or places to see (Pine and Gilmore, 1998) [7] .
・ Behavioral dimension refers to physical actions, or bodily experience. It is about consumer behavior patterns in the long term and imitation of models and lifestyles. Möller and Herm (2013) [12] defined bodily experiences as “physical sensations evoked by the external world” and propose that they can shift metaphoric meaning to customers’ brand perceptions.
・ Intellectual dimension is about thought, stimulation of curiosity, analytical and imaginative thinking, e.g. a thought-provoking museum exhibit or economical souvenir purchase. In particular, curiosity is defined as an interest in engaging in thrilling experiences which motivates people to search for novel and unusual sensory experiences (Litman et al., 2005) [13] .
Brand experience can be positive or negative, short-lived or long-lasting. It can positively affect consumer satisfaction, brand loyalty and brand trust (Zarantenello and Schmitt, 2010; Ha and Perks, 2005) [14] [15] . When customers pay attentions to specific experience features, a long-lasting brand experiences would store in their memories and gradually affect their attitudes toward the brand (Oliver, 1997 and Reicheld, 1996) [16] [17] .
2.2. Visit Intention
Different people have different visit preference. Stoeck and Schraudy (2005) [18] think people visit a place because they think it a good way to get more information and communication function. Rittichainuwat and Mair (2012) [19] stated visitors may have a fundamentally different motivational orientation for attending and this is based on their leisure needs. In addition, visit experience can provide visitors with an emotionally, intellectually, physically and spiritually mixed feeling (Shaw and Ivens, 2002) [20] .
To evaluate customer’s visit intention, Falk and Dierking (1992) [21] proposed an interactive experience model of the visit experience. It indicates that visit experience is a dynamic process that consists of Before, During and After. This model suggests the necessity of predicting customers’ expectations before the visit as well as the importance of generating their interactions during the visit along with feedback evaluating after the visit. Robbins and Judge (2007) [22] supported this model by claiming that attitude is what people prefer and can be classified into pre-attitude and post-attitude. Aronson et al. (2007) [23] explained the attitude includes cognition, affection and action, and suggested pre-attitude is the main measurement related to action that can best predict consumers’ expectations.
Regarding the visiting environment, Brida et al. (2012) [24] think that environmental factors are “far more important to perpetuate brand meaning and uniqueness in the minds of visitors.” Visitors are more actively engaged in social and cultural endeavors and their experiences are the result of the interaction among personal, social and environmental contexts (Falk and Dierking, 1992) [21] .
2.3. Consumer Purchase Intention
The concept of consumer purchase intention has been widely studied in marketing and consumer behavior researches. Purchase intention is a variable of customer behavior that has generally been used to find out the external effects of perceived quality (Bitner, 1990; Boulding et al., 1993; Cronin and Taylor, 1992; Taylor and Baker, 1994; Woodside et al., 1989) [25] [26] [27] [28] [29] . It can be highly influenced by many factors, such as the price of products, the word-of-mouth (Kenyon and Sen, 2012) [30] etc. According to the theory of reasoned action (TRA) (Fishbein and Ajzen, 1975) [31] , purchase intentions are used to predict the actual behavior and consumer attitudes will directly influence their behavioral intention, which will affect their purchase behavior as well.
Emotional experiences were found to have positive effect on purchase intentions (Yang and He, 2011) [32] . Abbott (1955) [33] stated that “what people really want are not products but satisfying experiences”. A personal experience is helpful to connect consumers with a brand and it is the most powerful tool to win customer loyalty. This will probably lead consumers to make intelligent purchase decisions (Smith and Wheeler, 2002) [34] . Brand experience has been regarded as an important predictor of consumer behavior related constructs. Brakus et al. (2009) [9] stated that brand experiences create pleasurable outcomes and will affect future-oriented decision making: consumers are more likely to make repeat purchases and recommendations to others. Zarantonello and Schmitt (2010) [14] think that consumer’s attitude towards a brand can predict the purchase intention, and different experiential profiles of consumers have different reactions in attitudes toward the brand and purchase intention.
2.4. Research Gap and Justification
Numbers of literatures regarding the relationship between brand experience and purchase intention have been researched, however most of them focused on emotional experience (e.g., Babin, Darden and Griffin, 1994) [35] , related experience (e.g., Muniz and Guinn, 2001) [36] , brand satisfaction and loyalty (Zarantonello and Schmitt, 2010) [14] . In the field of people’s visiting behavior, Barnes et al. (2014) applied brand experience in the context of destination tourism and found that brand experience is a significant determinant of visitor outcomes, specifically satisfaction, intention to revisit and intention to recommend.
So far some of the existing researches have given empirical evidence in relation to their assertions, but few research discussed the relationship between individual brand experience scale and visitor behavior in the context of museum tour in China. In order to fill this gap, this study will extend the result of Brakus (2009) [9] on brand experience by integrating the constructs of consumer revisit intention and purchase intention, to investigate to what extent brand experience will facilitate people’s willingness to revisit and purchase in China’s traditional museums.
2.5. Summary
According to the literature studies, it is suggested that experience is playing a positive role in nowadays’ marketing activities and people believe brand experience would provide consumers with the design that emphasizes experiential, nonfunctional product characteristics. Scholars are keen to find out the dimensions of consumer experience as well as how to create compelling experiences for them. Considering the advantages of brand experience, to find out whether brand experience has positive impact on people’s revisit intention and purchase intention in the particular context of China’s museum would make it significant for readers who are interested in China’s culture and market.
3. Conceptual Development and Hypotheses
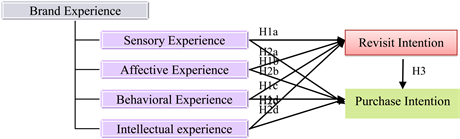
On the basis of literature review and Brakus’s four brand experience elements, this study will test if sensory experience, affective experience, behavioral experience and intellectual experience has impacts on people’s revisit intentions. The framework with three hypotheses has been developed.
H1: Brand experience (H1a. sensory, H1b. affective, H1c. behavioral, H1d. intellectual) has positive effect on people’s revisit intention.
H2: Brand experience (H2a. sensory, H2b. affective, H2c. behavioral, H2d. intellectual) has positive effect on people’s purchase intention.
H3: A positive revisit intention will promote visitor’s purchase intention.
A total of three hypotheses have been developed in order to see if brand experience has effect on consumer revisit and purchase intentions. To test the hypotheses, a multiple regression analysis is applied to analyze the linear relationship between independent variables and dependent variables. The Sig. value of 0.001 would be made as the standard to verify the hypotheses and the result of beta reflects the strength of each dimension, which means the hypothesis would be accepted when the Sig. value is <0.001 and the higher the beta is, the greater the independent variables’ impacts on dependent variables.
4. Methodology
Both primary research and secondary research are conducted in this study. Secondary research was done through reviewing the literature in relevant field. Primary research is set up by sampling, questionnaire, testing and analytical issues in order to understand the complex nature of feeling and emotions attached with customer revisit and purchase intentions. Data was analyzed by using software SPSS.
4.1. Research Design
The research of this study is designed under the guidance made by Malhotra (2009) [37] . A combination of exploratory research and descriptive research has been employed. In the first, literature review was collected and with its help, the hypotheses were developed. Second, quantitative research was used to examine the hypotheses by empirically testing the relationship between brand experience and people’s revisit intention along with purchase intention. In this study, data has been collected by using the survey method. A set of structured questionnaires have been conducted to collect data with the aim of testing the hypotheses as well as validating the conceptual model.
4.2. Sampling Design
There is no restriction in sample selection in this study because everyone is involved in culture and marketing world. Samples are people who are visiting Coal Museum of China and those who have visited this museum before. Though the initially estimated sample size was 300, finally 341 questionnaires were collected in case there would be invalid questionnaires. After screened out, some of the questionnaires were declared invalid due to the reasons of unfinished, lack of information, same answers for the entire questionnaire, etc. and being eliminated. Finally, 253 of the questionnaires were found useable for this study.
4.3. Questionnaire Design and Testing
A structured questionnaire was designed to collect data for statistical analysis. A pre-testing has been carried out in order to make the questions clear and logical. The structured questionnaire includes two parts. The first part consists of multiple choice questions related to demographic information (age and gender) and visitor’s frequency of visiting museum. The second part comprised totally 18 questions in the form of a Likert scale, where 1 refers to “Strongly Disagree” and 5 represents “Strongly Agree”. Photographs chosen from Coal Museum of China were given to help visitors memorise the exhibition and previous experience.
4.4. Analytical Issues
Data was collected by Sojump, an online survey software, distributed through email and social media platforms, and analyzed through the software package SPSS (Statistical Package for Social Science) Statistics 23. Based on the guidance of Maholtra (2009) [37] , Cronbach’s alpha, KMO Test, Correlation Analysis and Multiple Regression Analysis was applied to deal with statistical data.
5. Results and Analysis
5.1. Respondent Profile Analysis
A total of 253 valid respondents were analyzed (Figure 1), of whom, about 40% were males and 60% were females. Respondents aged 18 - 50 accounted for 90% of the sample size. Among them, more than half of respondents (54.5%) admitted they visit museums occasionally and 38% rarely visited museums (Figure 2).
5.2. Reliability Analysis
Reliability test is used to ensure stability and consistency of the measures as well

Figure 1. Respondent profile.

Figure 2. Frequency of visiting museum.
as the validity and reliability of the survey results. Ranges from 0 to 1, the higher the value is, the higher the reliability is. A Cronbach’s alpha greater than 0.60 is considered acceptable (Hair et al., 2006) [38] . The overall Cronbach’s Alpha value of this study is 0.737 > 0.6, reflects the strong reliability and validity of the constructed survey.

5.3. Validity Test
“Validity of a scale is defined as the extent to which differences in observed scale scores reflect the true differences among objects or the characteristics being measured” (Malhotra and Dash, 2011) [39] . In this study, Kaiser-Meyer-Olkin (KMO) test of sample adequacy and Bartlett test of sphericity were used to examine the validity of the factors. As suggested, KMO value over 0.5 indicates factor analysis is appropriate. Thus, factor loading with a value of more than 0.5 was set as a guideline in performing factor analysis. The results are shown below.
5.4. Descriptive Statistics and Correlations
5.4.1. Descriptive Statistics
According to the proposed conceptual framework, there are six constructs in total and a Likert scale ranging from 1 to 5 was adopted where 1 referred to “Strongly Disagree” and 5 represented “Strongly Agree”. Mean score and standard deviation of each individual construct in museums are given in Table 1.
According to the results, it can be seen that except affective experience (2.9750) and consumer purchase intention (2.6390), mean scores of other variables are higher than the middle point 3. The highest mean score is behavioral experience at 4.0764, follows with intellectual experience at the score of 3.9908. This means respondents had stronger feeling in behavioral and intellectual experience while visiting the museum.
5.4.2. Correlation Analysis
Correlation analysis (r-value) is a measure to test linear relationship between variables. The relationship will be strong when r-value is higher than 0.7 (or lower than −0.7) and weak when between 0 and 0.4 (or between −0.4 and 0). Table 2 below gives details of the correlation analysis and the results reflect moderate linear relations between variables.
5.5. Hypothesis Testing
To test the hypotheses, a multiple regression analysis is applied because it is “the appropriate technique to analyze the linear relationship between a dependent variable and multiple independent variables by estimating coefficients for the equation for a straight line” (Hair et al., 2006) [38] .
Table 1. Summary of mean and standard deviation of constructs in museums.
Table 2. Correlation matrix of museums.
GEN: Gender; MVF: Museum Visiting Frequency; SEN: Sensory Experience; AFF: Affective Experience; BEH: Behavioral Experience; INT: Intellectual Experience; CRI: Consumer Revisit Intention; CPI: Consumer Purchase Intention.
5.5.1. Relationship between Brand Experience and Consumer Revisit Intention (H1)
As can be seen in Table 3, the results of Sig. demonstrate positive relations between each element of brand experience and consumer revisit intention. In specific, behavioral experience has the most positive effect (beta = 0.473, p < 0.001) to motivate people’s revisiting willingness, follows by intellectual experience (beta = 0.433, p < 0.001), while affective experience (beta = 0.411, p < 0.001) is the least influenced factor.
5.5.2. Relationship between Brand Experience and Consumer Purchase Intention (H2)
Table 4 gives the coefficient result of Hypothesis 2. Compared with revisit intention, the value of beta suggests that brand experience contributes fewer stimulus to consumer purchase intention. In particular, the Sig. values indicate a weak relationship between affective experience (beta = 0.199, p = 0.002) and purchase intention. Sensory experience, with beta = 0.302, p < 0.001, is the strongest factor, ahead of intellectual experience (beta = 0.254, p < 0.001) and behavioral experience (beta = 0.241, p < 0.001).
Table 3. Coefficient analysis (H1).
a. Predictors: (Constant), Age, Gender; b. Predictors: (Constant), Age, Gender, Sensory Experience; c. Predictors: (Constant), Age, Gender, Affective Experience; d. Predictors: (Constant), Age, Gender, Behavioral Experience; e. Predictors: (Constant), Age, Gender, Intellectual Experience; f. Dependent Variable: Consumer Revisit Intention.
Table 4. Coefficient analysis (H2).
a. Predictors: (Constant), Age, Gender; b. Predictors: (Constant), Age, Gender, Sensory Experience; c. Predictors: (Constant), Age, Gender, Affective Experience; d. Predictors: (Constant), Age, Gender, Behavioral Experience; e. Predictors: (Constant), Age, Gender, Intellectual Experience; f. Dependent Variable: Consumer Purchase Intention.
5.5.3. Relationship between Consumer Revisit Intention and Purchase Intention (H3)
To test H3, people’s revisit intention was regarded as independent variable and the results are given in Table 5. Beta coefficient and significant p value at 0.000 < 0.01 implies 33.3% of people who would like to revisit the museum may have consumption action. This has proved the positive relation between consumer revisit intention and purchase intention.
5.6. Demographic Analysis
In terms of demographic information, mean score of each dimension varies according to different gender. Shown in Table 6, for both male and female, behavioral experience ranks in the first place with the score of 4.0980 and 4.0618 respectively and affective experience remains the last (3.0229 and 2.9426 respectively).
Comparing different age (see Figure 3), behavioral experience also is the top
Table 5. Coefficient analysis (H3).
a. Predictors: (Constant), Age, Gender; b. Predictors: (Constant), Age, Gender, Consumer Revisit Intention; c. Dependent Variable: Consumer Purchase Intention.
Table 6. Mean score of brand experience with different gender.
SEN: Sensory Experience; AFF: Affective Experience; BEH: Behavioral Experience; INT: Intellectual Experience.

Figure 3. Mean score of brand experience with different age.
element in different age group and mid-aged visitors (26 - 50) have relatively high score with brand experience.
6. Conclusions and Discussions
6.1. Conclusions
The survey results have given a better understanding of brand experience in the field of consumer visiting behavior. As a result of the study documented above, it can be concluded at least partial hypotheses were accepted (see Table 7).
The results of H1 - H2 proved the encouraging impact of brand experience on consumer revisit intention and purchase intention. In particular, behavioral experience is found to be the most effective factor for people’s willingness to revisit the museum and affective experience ranks in the last place. This can be implied that museum is a place which can arouse people’s thinking instead of emotional feeling. Thus, in other word, revisit intention is strongly affected by factors related to engagement and interaction in space, for example the simulated mine experience in the coal museum. In terms of people’s purchase intention, brand experience shows weaker influence. Sensory experience turns out to be the most functional element regarding people’s spending willingness whereas affective experience is not a significant factor. This suggests that visual, curiosity and innovation can evoke one’s interest to purchase, and rational visitors probably are able to control themselves from impulse spending.
The result of H3 demonstrates that a positive revisit intention can promote one’s purchase intention. The significant relationship between the two factors supports the findings from previous literature research (Zarantonello and Schmitt, 2010) [14] , the way consumers experience products, services and brands during a visit determines their reactions to purchase. In other word, personal experience will probably build connections between consumers and brands, and will guide consumers to make their intelligent purchasing decisions (Smith and Wheeler, 2002) [34] . Moreover, the beta value at 0.333 gives the conclusion that consumer purchase intention can be predicted by their revisit intention.
Demographic information was analyzed to see if age and gender differences influence people’s options. The result reflects a similar attitude for both sex and primary respondents in mid-age mark higher mean score in brand experience. In specific, behavioral experience is the factor that appeals most to visitors. This finding can be used to provide particular services and customize marketing campaign according to different age group.
Table 7. Hypotheses testing result.
6.2. Practical Social Significance
Practical Social Significance follow from the fact that brand experiences can arouse people’s emotional, intellectual, physically and spiritual feelings in visiting (Shaw and Ivens, 2002) [20] . As proved in conclusion, it is recommended that more exciting activities should be provided frequently to evoke people’s curiosities in revisiting museum. Innovative interactions and novelties are suggested to get displayed in order to get consumers immersed during the visit. For example, museums can organize special activities for the purpose of science education, which may leave impressions and arouse thinking in people’s subsequent memories. Once a person is willing to revisit the museum, they will be more likely to spend in the visiting place. Moreover, in order to generate visitor’s purchase intention, the result of this paper has suggested that it is better to provide visitors with sensory experience (e.g. sight, hearing, touch, smell and taste).rather than other factors. Hence, marketing campaigns such as dynamic exhibitions, product samples and foretaste are suggested to museums. As this study is based on customer’s perspective, it will play a crucial role in attracting more visitors and upgrading marketing strategy for museums in China.
6.3. Academic Significance
The study in first supports the past and present research of brand experience. As proved, brand experience is a modern branch of experience marketing that can facilitate people to get immersed in marketing activities. Also, the paper has contributed to the literature streams on brand experience and visitor behavior in China’s typical museum, which has developed a less-researched area in the marketing field, by examining how brand experiences have influenced consumers’ revisit and purchase intentions. It is hoped that by providing the research results of the relationship between variables and insights into demographic differences, the field of brand experience will receive more attention in order to fully understand its application on the development of China’s museums.
6.4. Limitations of the Study
There are several limitations in this study. First of all, due to the time and resource constraint, the sample size (253) was limited and most respondents were parents who cannot completely represent their kids’ opinions. Second, as Sniehotta et al. (2005) [40] suggested in the “intention-behavior gap”, intentions are not perfect predictors of behavior. Thus, respondents may have altered their real attitudes so that the personal opinions should have applied with care. Last but not the least, in the questionnaire, only ten typical photographs from Coal Museum of China were selected for previous visitors to remind them of their visiting experience. This may not reflect the entire attributes for the chosen space and may lead to biased opinions from respondents.
Cite this paper
Li, B.Y. (2018) The Influence of Brand Experience on People’s Revisit and Purchase Intention in the Context of China’s Museum. American Journal of Industrial and Business Management, 8, 563-578. https://doi.org/10.4236/ajibm.2018.83037
References
- 1. Porter, E. et al. (2007) Museums in Motion: An Introduction to the History and Functions of Museums. Rowman & Littlefield, Lanham, 29-37.
- 2. Khan, I. and Rahman, Z. (2015) Influence of Experiential Marketing on Customer Purchase Intention: A Study of Passenger Car Market. Management and Labor Studies. 39, 319-328.
- 3. Coal Museum of China. http://www.coalmus.org.cn/
- 4. Morrison, S. and Crane, F.G. (2007) Building the Service Brand by Creating and Managing an Emotional Brand Experience. Journal of Brand Management, 14, 410-421. https://doi.org/10.1057/palgrave.bm.2550080
- 5. Schmitt, B.H. (1999) Experiential Marketing: How to Get Customers to Sense, Feel, Think, Act and Relate to Your Company and Brands. The Free Press, New York, 88-96.
- 6. Holbrook, M.B. and Hirschman, E.C. (1982) The Experiential Aspects of Consumption: Consumer Fantasy, Feelings and Fun. Journal of Consumer Research, 9, 132-140. https://doi.org/10.1086/208906
- 7. Pine, B.J. and Gilmore, J.H. (1998) Welcome to the Experience Economy. Harvard Business Review, 76, 97-105.
- 8. Addis, M. and Holbrook, M.B. (2001) The Conceptual Link between Mass Customization and Experiential Consumption: An Explosion of Subjectivity. Journal of Consumer Behaviour, 1, 50-66. https://doi.org/10.1002/cb.53
- 9. Brakus, J.J., Schmitt, B.H. and Zarantonello, L. (2009) Brand Experience: What Is It? How Is It Measured? Does It Affect Loyalty? Journal of Marketing, 73, 52-68. https://doi.org/10.1509/jmkg.73.3.52
- 10. Ambler, T., Bhattacharya, C.B., Edell, J., Keller, K.L., Lemon, K.N. and Mittal, V. (2002) Relating Brand and Customer Perspectives on Marketing Management. Journal of Service Research, 3, 22-43.
- 11. Hultén, B., Broweus, N. and van Dijk, M. (2009) Sensorial Marketing. Palgrave Macmillan, London, 89-113. https://doi.org/10.1057/9780230237049
- 12. Möller, J. and Herm, S. (2013) Shaping Retail Brand Personality Perceptions by Bodily Experiences. Journal of Retailing, 89, 438-446. https://doi.org/10.1016/j.jretai.2013.05.004
- 13. Litman, J.A., Collins, R.P. and Spielberger, C.D. (2005) The Nature and Measurement of Sensory Curiosity. Personality and Individual Differences, 39, 1123-1133. https://doi.org/10.1016/j.paid.2005.05.001
- 14. Zarantonello, L. and Schmitt, B.H. (2010) Using the Brand Experience Scale to Profile Consumers and Predict Consumer Behavior. Journal of Brand Management, 17, 532-540. https://doi.org/10.1057/bm.2010.4
- 15. Ha, Y.H. and Perks, H. (2005) Effects of Consumer Perceptions of Brand Experience on the Web: Brand Familiarity, Satisfaction and Brand Trust. Journal of Consumer Behavior, 4, 438-452. https://doi.org/10.1002/cb.29
- 16. Oliver, R.L. (1997) Satisfaction: A Behavioral Perspective on the Consumer. McGraw-Hill, Boston, 285-286.
- 17. Reicheld, F. (1996) The Loyalty Effect: The Hidden Force behind Growth, Profits, and Lasting Value. Harvard Business School Press, Boston, 117-123.
- 18. Stoeck, N. and Schraudy, K. (2005) From Trade Show Company to Integrated Communication Service Provider. Gabler, Wiesbaden, 199-210.
- 19. Rittichainuwat, B. and MairVisitor, J. (2012) Visitors Attendance Motivations at Consumer Travel Exhibitions. Tourism Management, 33, 1236-1244. https://doi.org/10.1016/j.tourman.2011.11.002
- 20. Shaw, C. and Ivens, J. (2002) Building Great Customer-Experiences. Palgrave Macmillan, New York, 48-66. https://doi.org/10.1057/9780230554719
- 21. Falk, J. H. and Dierking, L. D. (1992) The Museum Experience. Whalesback Books, Washington DC, 12-35.
- 22. Robbins, S.P. and Judge, T. (2007) Essentials of Organizational Behavior. 9th Edition, Prentice Hall, New York, 46-58.
- 23. Aronson, E., Wilson, T.D. and Akert, R.M. (2007) Social Psychology. 6th Edition, Prentice Hall, Englewood Cliffs, NJ, 36-55.
- 24. Brida, M. (2012) Factors Influencing the Intention to Revisit a Cultural Attraction: The Case Study of the Museum of Modern and Contemporary Art in Rovereto. Journal of Cultural Heritage, 13, 167-174.https://doi.org/10.1016/j.culher.2011.08.003
- 25. Bitner, M.J. (1990) Evaluating Services Encounters: The Effects of Physical Surroundings and Employee Responses. Journal of Marketing, 54, 69-82. https://doi.org/10.2307/1251871
- 26. Boulding, W., Kalra, A., Staelin, R. and Zeithaml, V. (1993) A Dynamic Process Model of Service Quality: From Expectations to Behavioral Intentions. Journal of Marketing Research, 30, 7-27. https://doi.org/10.2307/3172510
- 27. Cronin, J. and Taylor, S. (1992) Measuring Service Quality: A Reexamination and Extension. Journal of Marketing, 56, 55-68. https://doi.org/10.2307/1252296
- 28. Taylor, S.A. and Baker, T.L. (1994) An Assessment of the Relationship between Service Quality and Customer Satisfaction in the Formation of Customers’ Purchase Intentions. Journal of Retailing, 70, 163-178. https://doi.org/10.1016/0022-4359(94)90013-2
- 29. Woodside, A.G., Frey, L.D. and Daly, R.T. (1989) Linking Service Quality, Customer Satisfaction, and Behavior Intentions. Journal of Health Care Marketing, 9, 5-17.
- 30. Kenyon, G. and Sen, K. (2012) A Model for Assessing Consumer Perceptions of Quality. International Journal of Quality and Service Sciences, 4, 175-188. https://doi.org/10.1108/17566691211232909
- 31. Fishbein, M. and Ajzen, I. (1975) Belief, Attitude, Intention and Behavior: An Introduction to Theory and Research. Addison-Wesley, Reading, MA, 106-128.
- 32. Yang, Z.Y. and He, L.Y. (2011) Goal, Customer Experience and Purchase Intention in a Retail Context in China: An Empirical Study. African Journal of Business Management, 5, 6738-6746.
- 33. Abbott, L. (1955) Quality and Competition. Columbia University Press, New York, 122-146.
- 34. Smith, S. and Wheeler, J. (2002) Managing the Customer Experience: Turning Customers into Advocates. British Library Cataloguing, London, 88-103.
- 35. Babin, B.J., Darden, W.R. and Griffin, M. (1994) Work and/or Fun: Measuring Hedonic and Utilitarian Shopping Value. Journal of Consumer Research, 20, 644-656. https://doi.org/10.1086/209376
- 36. Muniz, A.M. and Guinn, T.C. (2001) Brand Community. Journal of Consumer Research, 27, 412-432. https://doi.org/10.1086/319618
- 37. Maholtra, N.K. (2009) Basic Marketing Research: A Decision Making Approach. Pearson Education Limited, London, 74-91.
- 38. Hair Jr., J.F., Black, W.C., Babin, B.J., Anderson, R.E. and Tatham, R.L. (2006) Multivariate Data Analysis. 6th Edition, Pearson Education International, Upper Saddle River, NJ, 96-120.
- 39. Malhotra, N.K. and Dash, S. (2011) Marketing Research: An Applied Orientation. 6th Edition, Pearson-Dorling Kindersley, Delhi, 126-133.
- 40. Sniehotta, F.F., Scholz, U. and Schwarzer, R. (2005) Bridging the Intention-Behaviour Gap: Planning, Self-Efficacy, and Action Control in the Adoption and Maintenance of Physical Exercise. Psychology and Health, 20, 143-160.https://doi.org/10.1080/08870440512331317670