Natural Resources
Vol.4 No.1(2013), Article ID:29182,10 pages DOI:10.4236/nr.2013.41010
Development of Solar Ponds Optimization Model: Arab Potash Solar System—A Case Study
![]()
1Irrigation and Hydraulics Department, Ain Shams University, Cairo, Egypt; 2Resources and Environment Department, Dar Al-Handasah (Shair and Partners), Cairo, Egypt.
Email: hesham.badry@dargroup.com
Received May 3rd, 2012; revised August 11th, 2012; accepted September 14th, 2012
Keywords: Solar Pond; Solar Evaporation; Carnallite Production; Phase Chemistry
ABSTRACT
A steady state optimization model used to define the optimum salt to carnallite ponds area ratio in a solar pond system was developed. The model is based on material balance analysis using a cascade of complete-mix reactors model (cascade of CFSTR, continuous-flow stirred-tank reactor) prepared for the solar pond system. The basic material balance model shall use the basic phase chemistry relations and physical parameters of the solar pond system under optimization. The Arab Potash solar pond system data was used to examine the developed model where the Arab potash solar system was used as a Case Study. In the course of the model development, calibration and validation of the model is performed. Using this steady state model the optimum salt pond to carnallite pond area ratio is deduced. This optimum ratio is defined as the optimum area ratio that maximizes the carnallite production per the total pond system area. This term, which could be expressed as tons per km2, presents the best pond system efficiency. The results show that a 1.88 ratio of salt to carnallite ponds area is the optimum ratio.
1. Introduction
Solar ponds are simple pools of saltwater where it acts as a large scale solar thermal energy collector [1] or it is used for minerals extraction such as the production of concentrated brines and salt deposits [2-4]. Solar ponds operated as thermal energy collector are used in various applications, such as process heating, desalination, refrigeration, drying and solar power generation. As for the solar ponds constructed for salts deposits and heavy brine concentrates different salts are precipitated such as sodium chloride, sodium sulfate, carnallite, magnesium chloride, lithium salts and bromine.
Solar Ponds System considered under this article is a series of evaporation ponds that utilize the sea water or brine as a raw material under the effect of the solar energy to precipitate carnallite salt (MgCl2KCl·6H2O) as a product of the process. The system consists of two main types of ponds: 1) salt ponds where sodium chloride NaCl is precipitated and 2) carnallite ponds where carnallite is precipitated. The last portion of the salt ponds is a control pond where the brine in this pond is monitored carefully to define the carnallite point and to control the feed to the carnallite ponds.
The materials balance is a quantitative description of all materials that enter, leave, generate and accumulate in a system with defined boundaries. A materials balance is based on the law of conservation of mass (i.e., mass is neither created nor destroyed). The general word statement [5,6] of the materials balance is
 (1)
(1)
The mass rate of generation can be positive or negative where in most cases it has negative value. These material balance equations were first proposed for chemical substances in ponds and lakes in early 1960s [5].
In applying material balance two operation states can be considered; steady state and unsteady (transient) state. The primary requirement for steady state is that there is no accumulation within the system [5,6]. In other words the beginning and ending brine inventory within the ponds are essentially the same (same concentration and depth). This condition in natural system is applicable in case the system is subjected to a constant load for a long enough time [6]. In practice the conditions existing after three hydraulic detention times (pond volume/volumetric pond flow, V/Q) are often considered to be a satisfactory approximation of the steady state conditions [5].
The ponds and lakes behave like a continuously flow stirred tank reactor (CFSTR) (complete mix reactor) [7, 8]. In CFSTR reactions are instantaneous with no concentration gradient within the pond this is to say concentration are uniform throughout the pond [5-8]. The result is that the concentration of any material leaving the pond is exactly the same as the concentration at any point in the pond. As the pond system is composed of several ponds in series, cascade of CFSTR model can be used. A general computational framework for modeling such systems was developed by [9]. This model shows that starting from the first pond solutions of the entire system can be obtained by a recursive method [5].
Solar pond system is more efficient if the ponds are divided into several ponds [2,10] this is called the sequential pond theory. Sequential pond theory analysis [2] showed that ponds subdivision results in lower average pond brine concentrations. This results in higher evaporation which causes higher production. The analysis also showed that one pond divided into three ponds system is near to the best system economically since it provides relatively high production.
The depositing sequence of salts crystallized from the evaporation of sea water is well established from studies on solar ponds bitterns [11], many experimental tests and field observations of existing solar ponds [11]. The first salt to deposit is the CaCO3, Calcite, followed by CaSO4, Gypsum, and then NaCl, halite, [12].
In sea water solar ponds epsomite (MgSO4·7H2O) is the next salt to crystallize after halite, and with cold weather it can happen early and massively, [11]. Kanite (KCl·MgSO4·2.75H2O) crystallizes next with epsomite and halite. Under favorable conditions these salts can contain as much as 60% kanite, 25% epsomite and 15% halite.
Carnallite (KCl·MgCl2·6H2O) and halite are usually the last salts to crystallize and deposit with small amount of MgSO4·6H2O, this normally represents the end point of sea water evaporation.
The above mentioned sequence of crystallization is very dependent on the brine temperature. This in turn is determined by the concentration of the sea water bitterns, the ambient day-night temperature cycle, wind conditions, bitterns depth and the evaporation rate. Pan evaporation provides the basis for the mass balance calculation of evaporation [13]. As observed from solar ponds studies with deep bodies (2 - 6 m) the brine normal day-night temperature is flattened-out and the salts crystallize in a slower, colder, more isothermal manner. Alternatively, for shallower bodies (<2 m) the evaporation is more rapid and day-night crystallization effects are more noticeable, [11].
The objective of this study is to develop a tool for sizing of salt and carnallit ponds with the aim of increasing the production of carnallite salt deposits. Through this study, a steady state material balance model using cascade complete-mix reactor model is developed. The model utilizes the basic material balance relations for both the salt and carnallite ponds. The model was further used to estimate the optimum salt to carnallite pond area ratio for the Solar Pond System developed at the Arab Potash Company.
2. Material Balance at Steady State
The intent of this section is to discuss the fundamentals of the material balance in the solar pond system. Figure 1 shows the basic streams of a solar pond system.
These basic streams are:
1) The feed brine, which is expressed in tons.
2) Evaporation from the pond area, which is a function of the evaporation rate, and the pond surface area available for evaporation. The evaporation is expressed in mm/day.
3) Salts which represent the deposited salts in the pond, which is expressed in tons.
4) Entrainment which represents the brine that is lost within the salt deposits. As the salt crystals grow or accumulate on the pond floor, there are voids created and some brine is trapped therein. The quantity of entrainment is a function of the quantity and type of salt deposited. The entrainment is generally expressed as a weight percent of the salt deposited.
5) Leakage is the brine lost through seepage towards groundwater. The quantity of leakage is usually described in mm/day and is a function of the pond area.
6) Exit brine is the brine leaving the pond either to the following pond or the point out of the system.
Generally, the brine concentration throughout the pond is uniform and equal to the exit brine concentration. This is a key assumption for the CFSTR model used.
From the above we can develop the balance equations, where these equations include the brine flow balance and material balance equations of the brine constituents.
2.1. Salt Ponds Material Balance
The salt pond system consists of a series of pond system rather than a single pond system. Figure 2 illustrates the entire setup of the salt pond balance.
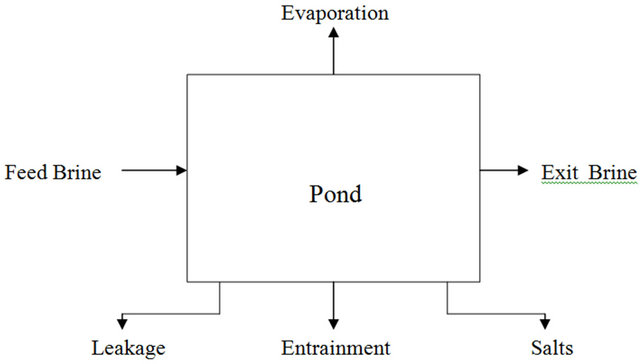
Figure 1. Basic system material balance.
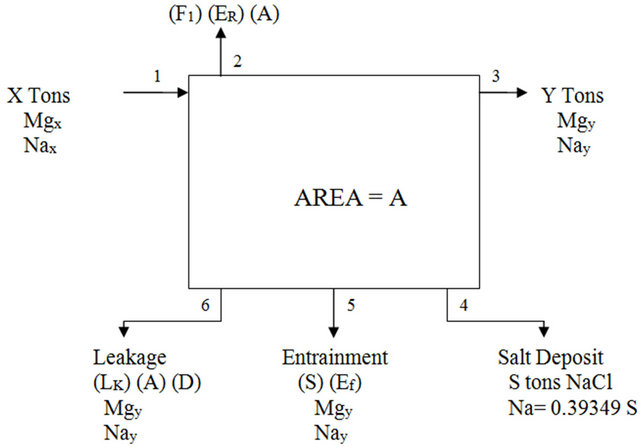
Figure 2. Salt pond material balance.
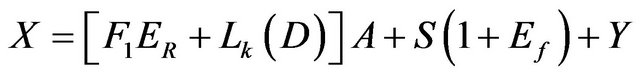
Following the basic solar ponds streams shown in Figure 2 the following balance equations are deduced:
Mass:
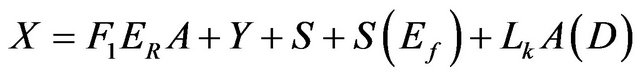 (2)
(2)
Magnesium:
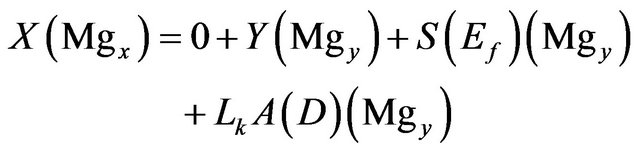 (3)
(3)
Sodium:
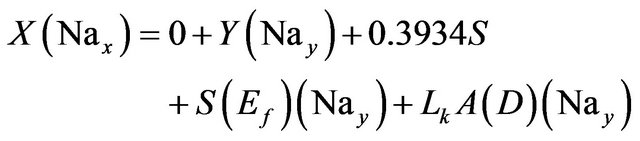 (4)
(4)
where:
• X is the input feed in tons.
• Mgx is the weight fraction of Mg in the input feed.
• Nax is the weight fraction of Na in the input feed.
• Y is the exist brine in tons.
• Mgy is the weight fraction of Mg in the exist brine.
• Nay is the weight fraction of Na in the exist brine.
• S is the NaCl salt deposit in tons.
• Ef is the entrainment factor as percent of the salt deposit.
• 0.3934 is the Na percent weight in NaCl.
• Lk is the seepage rate in m/yr.
• A is the pond area.
• D is the brine density.
• F1 is the evaporation scale factor.
• ER is the evaporation rate in m/y.
For the first pond the following are the known parameters:
• The area A.
• The Mg and Na concentrations at the feed brine X and the exist brine Y.
• The evaporation rate ER.
• The leakage rate Lk.
• The entrainment factor Ef.
• The pond brine density D.
• The evaporation factor F1.
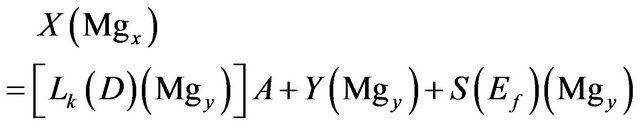
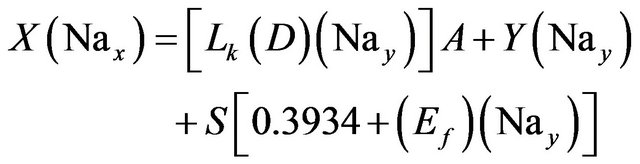
This implies that the input feed X, the pond exit brine Y and the deposited salt S as the three unknown parameters. The above three relations are regrouped to lead to the following relations:
Mass:
 (5)
(5)
Magnesium:
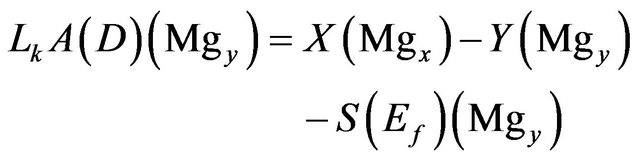 (6)
(6)
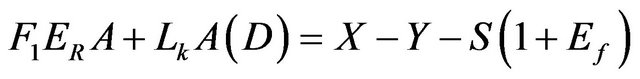
Sodium:
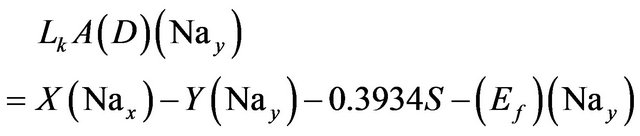 (7)
(7)
Solving the above three relations, the three unknowns X, Y, and S are calculated.
The exit brine from the first pond is considered as the input feed to the second pond, this implies that the input feed, X, to the second pond is known, and accordingly the balance is changed to evaluate how big the area should be to concentrate the input brine to a set Mg concentration.
The following are the known parameters in the balance relations for the second salt pond:
• The input feed brine X (equal to the exist feed of the first pond).
• The Mg and Na concentrations at the feed brine X and the exist brine Y.
• The evaporation rate ER.
• The leakage rate Lk.
• The entrainment factor Ef.
• The pond brine density D.
• The evaporation factor F1.
While the unknown parameters are the pond area A, the exit brine, Y, and the NaCl salt deposited, S. The main material balance relations could be regrouped again to show the following relations:
Mass:
 (8)
(8)
Magnesium:
 (9)
(9)
Sodium:
 (10)
(10)
Solving the above three relations, the three unknowns A, Y and S are calculated.
The same procedure presented for the second salt pond is used for ponds 3 to 6 till the pre-carnallite pond (PC). Calculation for the PC pond yields the value of exit brine, Y, which is the tonnage of brine available to enter the first carnallite pond.
2.2. Carnallite Ponds Material Balance
As previously shown the NaCl is only deposited in the salt ponds, however in the carnallite ponds potassium and magnesium (as carnallite) are deposited along with sodium. Accordingly, a new unknown appears in the material balance relations, this new unknown require defining a new material balance relation. This new relation tracks the carnallite deposited in the carnallite ponds. Figure 3 illustrates the different balance streams involved.
Following the balance streams shown in Figure 3 the following balance equations are deduced:
Mass:
 (11)
(11)
Magnesium:
 (12)
(12)
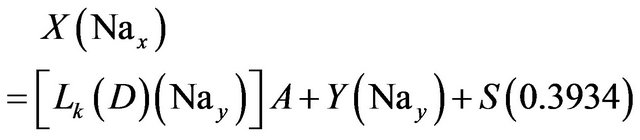
Sodium:
 (13)
(13)
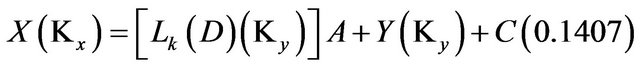
Potassium:
 (14)
(14)
Where• Kx is the weight fraction of K in the input feed.
• Ky is the weight fraction of K in the exist brine.
Figure 3. Carnallite pond material balance.
• 0.0875 is the Mg percent weight in carnallite (MgCl2KCl·6H2O).
• 0.1407 is the K percent weight in carnallite (MgCl2KCl·6H2O).
The calculations of the last salt pond (pre-carnallite) leads to the quantity of brine leaving PC pond and entering as an input feed to the first carnallite pond.
The known parameters for the material balance of the carnallite ponds are:
• The input feed brine X (equal to the exist feed of the PC pond).
• The Mg, Na and K concentrations at the feed brine X and the exist brine Y.
• The evaporation rate ER.
• The leakage rate Lk.
• The pond brine density D.
• The evaporation factor F1.
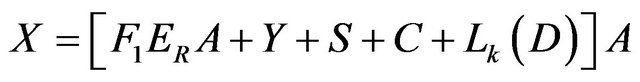
While the unknown parameters are; the pond area A, the exist brine Y, the NaCl salt deposited, S, and the carnallite salt deposited, C. The main material carnallite ponds balance relations could be regrouped to show the following relations:
Mass:
 (15)
(15)
Magnesium:
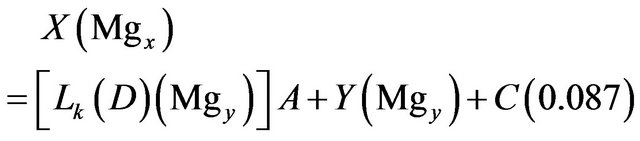 (16)
(16)
 (17)
(17)
Potassium:
 (18)
(18)
Solving the above four relations, the four unknowns A, Y, S and C are obtained.
The same procedure presented above for the first carnallite pond is used for ponds 2 to 6 till the last pond from where the exit brine is discharged to the waste channel.
2.3. Basic Phase Chemistry and Physical Relations
The above material balance equation developed shows that the salt and carnallite pond is a function of pond area, evaporation rate, different flow streams and brine chemistry. Experience has shown that the behavior of any pond system brine chemistry can best be illustrated on a concentration path diagram. Through the solar pond system studied, only potassium K and sodium Na are precipitated in the pond system while calcium Ca and Magnesium Mg do not precipitate. In this sense all concentration paths is deduced as a function of Mg or Mg and Ca.
These relationships are deduced using field data collected for the specific solar pond system. For new systems the basic relations should be estimated based on experiments to be performed prior the solar pond system design. The relations should cover density, evaporation, sodium, potassium, and evaporation as a function of Mg or Mg + Ca.
Other major inputs as area, entrainment factor, seepage leakage factor and evaporation factor are physical parameters that should be estimated based on field measurements. Entrainment factor depends on the type of salt deposited as it is directly related to the voids and porosity in the deposited salt. Seepage factor and evaporation factor are two parameters that are difficult to estimate as they require extensive measurements and field investigations. Both parameters are deduced based on material balance model calibration.
Evaporation rate is temperature sensitive and a single relation is difficult to be defined accordingly averages for the evaporation rate over the year should be considered while developing the steady state model.
Also Potassium is a temperature sensitive and a single relation for the concentration path of potassium is difficult to define. Through the steady state model development the data for the months of summer months should be used. This is due to the fact that the most evaporation and carnallite production are during these months. It is important to note here that it is not possible to define an optimum ratio of the salt to carnallite pond area that is applicable during all the year. Thus the study uses the period of the year where most of the carnallite is produced in the development of the Potassium concentration path diagram.
3. Model Development
Estimating these phase chemistry relations and physical relations the optimization model is developed.
The solar pond system consists of two main sections with different operating objectives. The first section, the salt ponds, is operated to provide the maximum amount of carnallite point brine to the first carnallite pond. The second section, the carnallite ponds, is fed by the flow of the carnallite point brine produced by the salt ponds. There are three critical brine concentrations that need to be known. One is the feed brine concentration, the second is the Carnallite Point concentration, and the third is the concentration at the point where brine will be discarded. The optimization model requires the definition of these three locations chemical analysis.
The optimization model was developed based on the material balance relations presented previously and the deduced phase chemistry and physical parameters relations. The model has 6 salt ponds and 6 carnallite ponds. This selection of ponds system is arbitrary. Enough ponds must be chosen to satisfy the sequential pond theory. The sequential pond theory proves that as we increase the number of ponds the performance of the ponds improves. Usually this is satisfied with about 4 ponds.
To start the model calculation, the area of the first salt pond will arbitrarily be set at 10,000 square meters (1 hectare) and the Magnesium concentration in the brine in each pond will be divided equally from the concentration at the Feed brine to the concentration at the carnallite point. For example, the carnallite point occurs at say 6.1% magnesium and the Feed brine is at say 2%. Each pond will have a successive jump of (6.1 − 2)/6 or 0.683%. Based on this assumption the Magnesium concentrations in the brine entering the pond (Mgx) and leaving the pond Mgy are known values.
Using the developed relations for the density, evaporation, sodium and magnesium, the values of evaporation, density, Nax, Nay, Kx and Ky are evaluated.
A simple spreadsheet is developed to solve the model relations and calculate the unknown parameters. However it is important to note here that the model results depend on the input parameters and the calibration of the different parameters involved in the calculations.
The best indicator of pond efficiency is the tons of carnallite per square kilometer of total pond area where this value is maximized for the optimum salt ponds area to carnallite ponds area ratio to be reached.
The model should be run for different salt to carnallite ponds area cases and a relation between the area ratio and the tons of carnallite per unit area is developed. From this relation the optimum area ratio is deduced.
4. Arab Potash Solar Pond System Analysis: A Case Study
The Arab Potash solar pond system is located to the south of the Dead Sea the lowest point at the surface of the earth with an area of about 112 km2 [3]. The main aim of the solar ponds system at the Arab Potash Company is to precipitate carnallite (KClMgCl2·6H2O) which is the raw material for the potash production. The brine used in the solar ponds is pumped from the Dead Sea. This brine is rich in potassium chloride. The Arab Potash solar pond system is composed of two parts the salt ponds and the carnallite ponds.
The model developed in the previous section was used to optimize the Arab Potash Solar Pond System (APC). The data available for a stretch of 6 years during the period 1997 to 2002 were used for this case study [14-19]. This optimization for the Arab Potash Solar Pond System was appreciated by the Company as the Arab Potash Company was studying the expansion of the solar ponds system and as such would like to define the optimum salt to carnallite ponds areas.
The following sub-sections present the basic phase chemistry relations and the physical parameters relations. This is followed by model calibration and validation. The optimum salt to carnallite ponds area ratio is then deduced.
4.1. Basic Mathematical Relationships
The following sub-sections define the composition of the pond brines in term of concentration paths. Other parameters necessary to the APC solar pond model development are also presented.
4.1.1. Density
The relation for the density (ton/m3) as a function of magnesium is developed based on the high carnallite production period data for the years 1997 to 2002. There are three distinct groupings of points that are fitted by a polynomial as presented in Figure 4. It should be noted that the correlation is fairly consistent for the entire year.
It is needless to mention that the density is needed in material balance calculations to convert from volume to mass.
4.1.2. Evaporation
To develop a relation between the evaporation rate and the magnesium two steps are performed. First a relation between evaporation rate and density is developed, then magnesium is substituted for the density based on the density relation developed above.
Figure 5 shows a plot of evaporation as a function of density. The data is extracted from experiments using five evaporation pans [12]. The five pans are in operation with densities at 1.00, 1.26, 1.31, 1.34, and 1.36. The summer months average evaporation rates were used in Figure 5. From the plot it is can be deduced that the last four pans provide data that lie neatly on a straight line. A straight line was fitted to this data and the relation is presented in Figure 5. Since only the straight-line portion of the curve is needed it does not matter how the remainder of the curve to the water pan is shaped.
If we substitute the density versus magnesium relation presented in Figure 4 in the evaporation versus density relation presented in Figure 5 the evaporation rate versus magnesium relation is deduced.
4.1.3. Sodium
Figure 6 shows the concentration path of sodium as a function of magnesium. Most of the evaporation activity occurs during the months of June, July, August and September. The plot presents these months but sodium is not
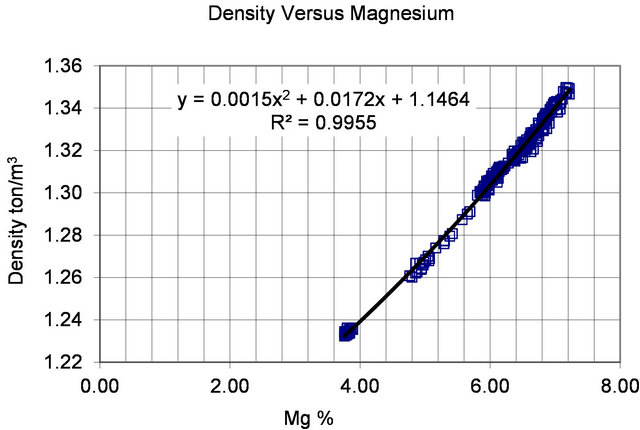
Figure 4. Density versus Magnesium relation.
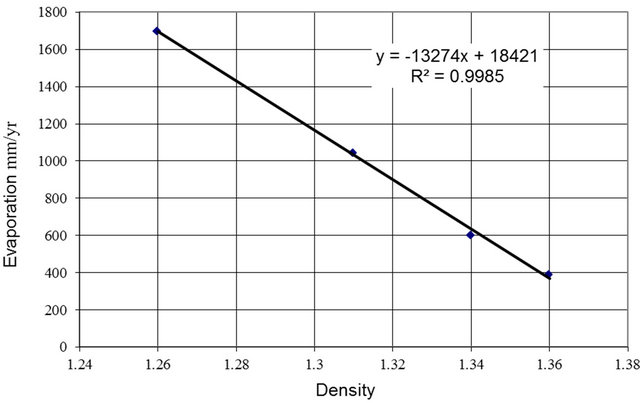
Figure 5. Evaporation rate versus density.
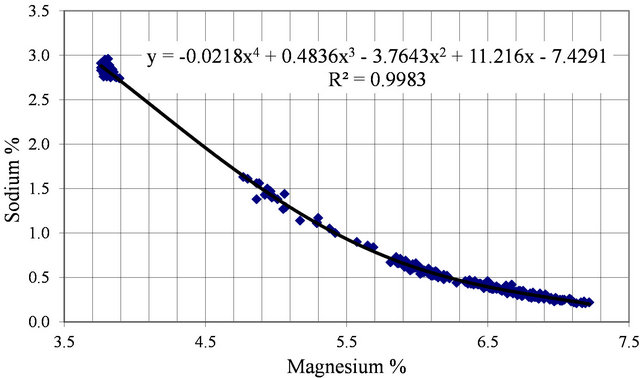
Figure 6. Sodium versus Magnesium relation.
temperature sensitive and the plot for other months does not vary much.
Sodium shows an expected falling path with some scatter, however this is explained by the fact that sodium is the hardest component to determine and often it is calculated by difference which accounts for data scatter.
4.1.4. Potassium
Potassium and magnesium concentrate at the same ratio up to the carnallite point. Both are soluble up to that point in winter or summer. After the carnallite point, potassium is temperature sensitive and therefore a yearly plot will show scatter, this is well presented in Figure 7. Figure 7 presents the data for period April to November during the years 1997-2002.
The scatter is very high and if an attempt to use this data to fit a relation, a low regression coefficient will result.
The data for the period June-September (high carnallite production period) are used to fit a polynomial relation as shown in Figure 8.
It should be noted here that the data for the high carnallite production period is consistent and it presents fairly coherent envelop.
4.1.5. Entrainment Factor
The entrainment factor is expressed as percent by weight of the salt deposited in the pond. This is presented as
 in tons.
The entrainment factor is directly related to the voids/ porosity of the deposited salt. For the sodium chloride salt, the value of the entrainment factor is assumed as 0.33. This value is an estimate based on the experience gained from several pond systems [10].
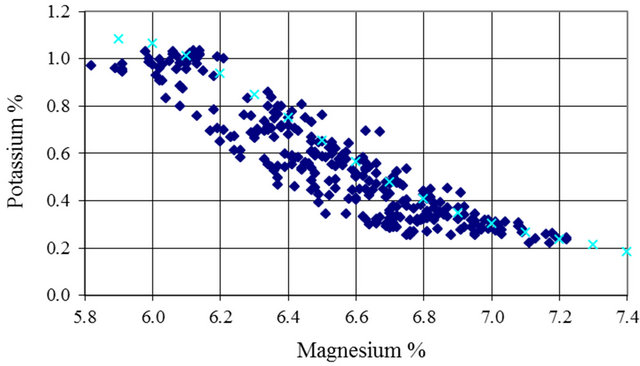
Figure 7. Potassium versus Magnesium 1997-2002 (AprilNovember).
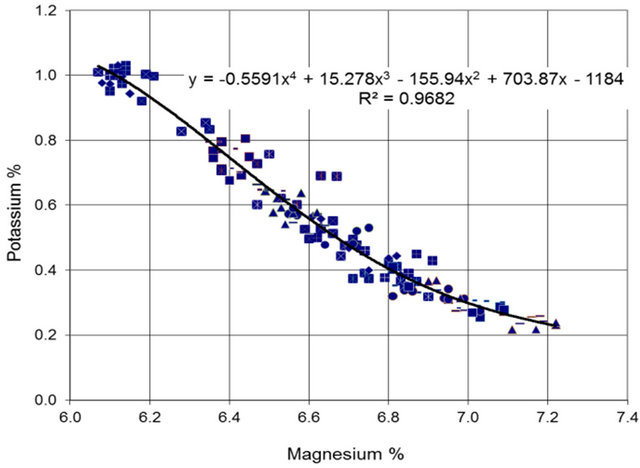
Figure 8. Potassium versus Magnesium relation (June-September).
4.1.6. Seepage/Leakage Relation
The leakage rate, defined as the seepage through soil in mm/day, is very difficult to estimate. Many factors should be included while evaluating the seepage. Type of soil in the ponds area, the existence of sink-holes, lenses of permeable soils or lenses of impermeable soils are some of these unknown parameters/information.
As a crude assumption, if we assume that the soil underneath the ponds is silty soil, the leakage factor would be expected to range between 0.1 mm/d to 10 mm/d. Study performed at APC revealed that a value of 0.25 mm/d could be assumed [20].
An overall mass balance could help in fine tuning this parameter using data for as many years as available. This could be done by evaluating the total amount of potassium pumped into the ponds from the Dead Sea over the defined period. This value should be compared to the total amount of potassium produced in the product KCl and the amount of potassium returned to the Dead Sea through the truce canal. The difference is the potassium lost. From the amount of potassium lost, an estimate of leakage can be made.
This parameter is used as a calibration parameter while calibrating the model.
4.1.7. Evaporation Factor
APC performed several studies [20] to define the evaporation scale factor. These studies revealed that the evaporation scale factor ranges between 0.68 and 0.8.
This parameter is also used as a calibration parameter while calibrating the model.
4.2. Model Calibration
In the previous sub-section it was mentioned that two variables are left for the calibration these are the evaporation factor and the leakage factor. Trying to evaluate these factors the actual data for the years 1998 through 2002 is used.
This data was evaluated before it is used in the calibration. The evaluation of these data revealed the following:
• APC started to fill expansion pond SP-0A during the year 1998.
• The pond SP-0A was under operation for the years 1998 to 2000.
• A trial fill to expansion pond SP-0B started in the year 2001.
Based on the actual data analysis the regular operation year for the solar pond system was the year 2002. Accordingly the data for this year is used for the calibration while the other years’ data are used for the validation of the model.
The input data to the model are as follows:
• Area for the salt ponds used is 58.852 km2 as shown in the APC 2002 yearly plan report [6].
• Area of the carnallite pond used is 26.51 km2.
• Dead Sea brine Mg concentration used is 3.804, which is the average value for the year 2001.
• Mg concentration at the carnallite point used is 6.033, which is the average of the actual Mg concentration at the pre-carnallite pond PC2 for the year 2002.
• The exit pond (C-7) Mg concentration used is 6.868 which is the average of the actual Mg concentration at the C-7 pond for the year 2002.
• Entrainment factor used is 0.33.
The calibration involves the evaluation of the evaporation factor and the leakage/seepage factor. The following runs are done to define the calibrated parameters:
• The evaporation factor is assumed to be 0.75, while a value of 0.1 mm/day for the leakage factor results from the model. The results of this run compared to the actual results are shown in Table 1.
• The evaporation factor is assumed to be 0.8, while a value of 0.11 mm/day for the leakage factor results. Also the results of this run are presented in Table 1.
• The evaporation factor was assumed to be 0.7. This run results to a value of 0.085 mm/day for the leakage factor. Again the results of this run are presented in Table 1.
Analyzing the results of the calibration runs presented in Table 1 show the following:
• The variation in the value of Lk is not much where it varies from 0.11 to 0.085 with an average value of 0.1.
• Run No. 3 results are way off from the actual data.
• Run No. 1 gives a very close carnallite production result while the Dead Sea feed and the C-3 feed were off by some 11%.
• Run No. 2 gives a carnallie production result that is off by 7.3% while the Dead Sea feed and the C-3 feed were off by 5%.
Experience shows that a 10 to 15 percent off in the model flow results and a 5 to 10 percent off in the model carnallite production results is considered good approximation to the actual conditions. Accordingly values considered in Runs No. 1 and 2 were further validated based on the data for the year 2000.
Runs No. 4 and 5 used the data for year 2000 with the values of evaporation factor and leakage factor as assumed for Runs No. 1 and 2. The model results are presented in Table 2. The results show that the carnallite pond area for run No. 4 and 5 is 26.47 km2 which some 0.1% off the actual pond area.
Analyzing the results of the calibration runs presented in Table 2 show the following:
• Since APC was filling the expansion pond SP-0A the values of the Dead Sea feed were way off from the actual results.
• The combination of F1 = 0.8 and Lk = 0.11 mm/day gives better C-3 feed results and better carnallite production results.
It is concluded that the Combination F1 = 0.8 and Lk = 0.11 mm/day is a better overall assumption for these values.
4.3. Model Validation
Using the values deduced during the calibration subsection, the model is validated using the data of the years 1998 to 2001. The results of these runs are presented in Table 3.
Table 1. Calibration results year 2002.
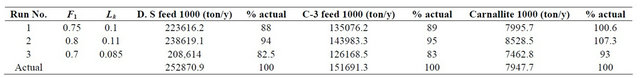
Table 2. Calibration results year 2000.
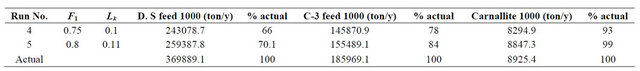
Table 3. Validation results.
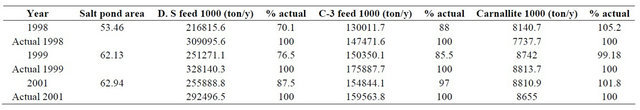
Examining the validation results data confirm the calibration conclusions where it shows the following:
• The Dead Sea feed are way off from the actual results. This is due to the fact that APC was pumping water to the SP-0A and SP_0B.
• The salt pond area for the year 1998 is very small and the production is relatively small, this is explained by the fact that during this year the salt ponds were covered by salt mushrooms that were blocking or restricting the brine flow in the ponds [3]. APC started dredging activities during the following years and the conditions of the salt ponds were improved.
• The Dead Sea feed results for the year 2001 are close to actual since only for a short period of time the APC were feeding the SP-0B pond. The results for C-3 feed and the carnallite production values for the year 2001 are very close to the actual, which show that the calibration values used are correct.
4.4. Optimum Salt Pond to Carnallite Pond Area Ratio
Using the year 2002 input data the evaluation of the optimum salt area to carnallite area ratio is performed.
Both Figure 9 and Table 4 present the results of the salt to carnallite area ratio versus the tons of carnallite per km2. It shows that the optimum ratio is in the range 1.85 to 1.92 with the optimum ratio is 1.88. The respective Mg% concentration is 6.99% to 7.02%, with the optimum value of 7.006% (Figure 10).
If no leakage is assumed, the optimum case results in 102,346 ton/km2 carnallite and if entrainment is zero, 103,255 tons/km2 is made. All of this depends on the reliability of the correlations made through this study and the APC data.
5. Conclusions
The study conclusions are summarized in the following points:
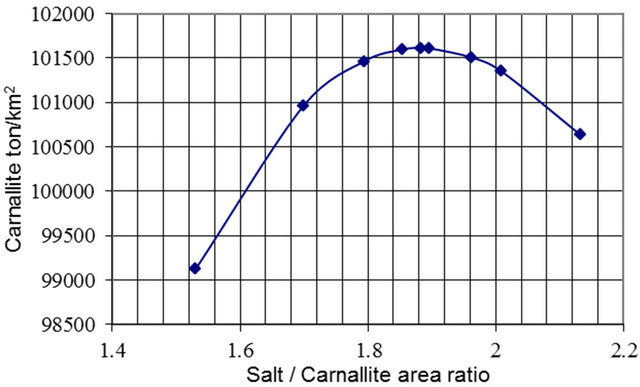
Figure 9. Salt pond to carnallite pond area ratio versus carnallite production.
Table 4. Optimum salt to carnallite area ratio.
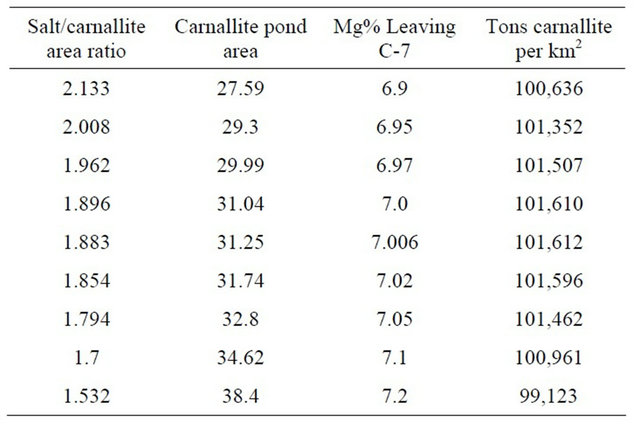
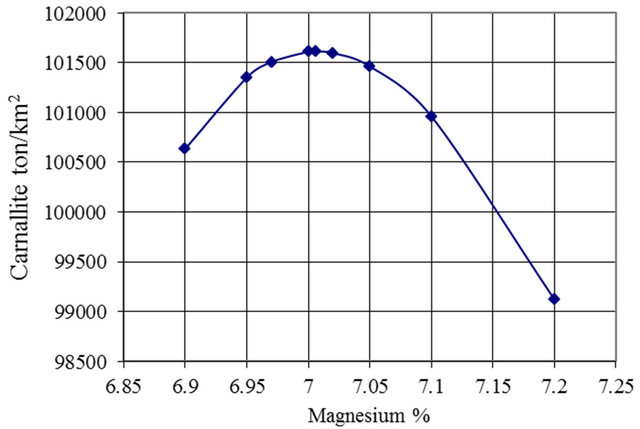
Figure 10. Mg% Concentration versus carnallite production per km2.
• A steady state optimization model was developed to define the salt to carnallite ponds area ratio in a solar pond system.
• The model is based on material balance analysis using a cascade of complete-mix reactor.
• The Arab Potash solar pond system was used as a case study where all the phase chemistry and physical parameters relations were developed using APC data for the period from 1997 to 2002.
• The optimum salt area to carnallite area ratio is 1.88 where a range from 1.85 to 1.92 showed negligible difference from the optimum.
• Under the present assumptions, APC could produce up to 101,612 tons of carnallite per square kilometer of solar pond area if a salt to carnallite area ratio of 1.88 to 1 is adopted. If entrainment is released from the salt deposits with dredgers, and if it is assumed that leakage is less than 0.11 mm per day, carnallite production will increase to 103,255 tons/km2 or a 1.6% increase in production from the optimum value of 101,612 tons/km2.
• Brine concentration discharged to the waste discharge canal and concentrations at the carnallite point are very sensitive to optimum design and more research efforts need to be conducted to fully understand the complex behavior and trends.
• The model also assumes that evaporation of all brines is correctly represented however its accuracy is not well examined. The optimization is highly dependent on evaporation rates especially in case of having a magnesium range of 6.5 to 7.5, and at the carnallite point.
• The model was developed based on yearly average data; a more comprehensive monthly or even daily model is required for proper analysis of the solar pond system.
• The model results could be used to upgrade the solar pond system and enhance the carnallite production.
6. Acknowledgements
Acknowledgment is due Dar Al-Handasah, a leading multi-disciplinary consultant firm in the Middle East, for providing data & logistics needed to accomplish the paper.
REFERENCES
- F. Suarez, et al., “A Fully Coupled, Transient DoubleDiffusive Convective Model for Salt Gradient Solar Ponds,” International Journal of Heat and Mass Transfer, Vol. 53, No. 9-10, 2010, pp. 1718-1730. doi:10.1016/j.ijheatmasstransfer.2010.01.017
- D. Butts, “Final Report of the Lecture Series on Solar Pond Technology,” Unpublished Lecture Notes, 1986.
- Z. Halasah, “Utilization of Satellite Image to Improve Solar Pond Production,” 24th AFA International Technical Fertilizers Conference and Exhibition, Amman, 22-24 November 2011, pp. 69-78.
- A. Tamimi and K. Rawajfeh, “Lumped Modeling of Solar-Evaporative Ponds Charged from the Water of the Dead Sea,” Desalination, Vol. 216, No. 1-3, 2007, pp. 356-366.
- T. Tchobanoglous and E. Schroeder, “Water Quality,” Addison-Wesley Publishing Company, Boston, 1987.
- C. Steven and H. Kenneth, “Engineering Approaches for Lake Management: Mechanistic Modeling,” Vol. 2, Butterworth Publishers, Boston, 1984.
- S. C. Chapra and K. H. Reckhow, “Engineering Approaches for Lake Management: Mechanistic Modeling,” Vol. 1, Butterworth Publishers, Boston, 1984.
- R. A. Vollenweider, “Input-Output Models with Special Reference to Phosphorus Loading Concept in Limnology,” Schweizerische Zeitschrift fur Hydrologie-Swiss Journal of Hydrology, Vol. 37, 1975, pp. 53-84.
- D. J. O’Connor and J. A. Muller, “Water Quality Model of Chlorides in Great Lakes,” Journal of the Sanitary Engineering Division, Vol. 96, No. 4, 1970, pp. 955-975.
- D. Butts and C. McCleary, “Computer Program for Solar Pond System,” GSL Solar Consultants Report, 1988.
- D. Garrett, “Potash: Deposits, Processing, Properties and Uses,” Chapman & Hall, London, 1996.
- G. Baseggio, “The Composition of Sea Water and Its Concentration,” Fourth Symposium on Salt, Northern Ohio Geological Society, Vol. 2, 1974, pp. 351-358.
- M. Coleman, “Review and Discussion on the Evaporation Rates of Brines,” 2000. http://www.actis.com.au/evaporation_rate_of_brines.pdf
- APC Technical Office, “Carnallite Production Plan for Year 1997,” APC Technical Document, 1997.
- APC Technical Office, “Carnallite Production Plan for Year 1998,” APC Technical Document, 1998.
- APC Technical Office, “Carnallite Production Plan for Year 1999,” APC Technical Document, 1999.
- APC Technical Office, “Carnallite Production Plan for Year 2000,” APC Technical Document, 2000.
- APC Technical Office, “Carnallite Production Plan for Year 2001,” APC Technical Document, 2001.
- APC Technical Office, “Carnallite Production Plan for Year 2002,” APC Technical Document, 2002.
- GSL Solar Consultants, “An Evaluation of the Solar Pond Carnallite Production Capacity at the Arab Potash Company,” Arab Potash Company Technical Report, 1984.