Theoretical Economics Letters
Vol.4 No.6(2014), Article
ID:46928,11
pages
DOI:10.4236/tel.2014.46056
Space Research of China’s Industry Structure and Employment Structure Coordination Degree
Jiangjuan Shan, Tianqing Miao*
City and Environment College, Jiangsu Normal University, Xuzhou, China
Email: jiangjuanshan@163.com, *mtq01@126.com
Copyright © 2014 by authors and Scientific Research Publishing Inc.
This work is licensed under the Creative Commons Attribution International License (CC BY).
http://creativecommons.org/licenses/by/4.0/


Received 28 March 2014; revised 28 April 2014; accepted 15 May 2014
Abstract
The coordination of industry structure and employment structure is a sign and the guarantee of healthy development of the national economy. This paper analyzes the industry structure and employment structure coordination degree’s evolution and spatial pattern with deviation index. In conclusion, the relationship between industry structure and employment structure of the first industry in China is inharmonious; and the more developed economy does not mean that the relationship between the industrial structure and employment structure is more harmonious.
Keywords
China, Industry Structure, Employment Structure, Coordination Degree

1. Introduction
Coordination degree is a measure of internal elements between systems or systems in the development process of the degree of harmony with each other, reflecting the system by the disorder to order trends and is a quantitative indicator of coordination condition. Accordingly, we can learn that the industry structure and employment structure coordination degree is also a quantitative indicator, which is used to measure different stages of a country or area’s economic development, and the relationship between regional employment structure and industrial structure. It describes an asymmetric state of industrial structure and employment structure. The smaller absolute deviation structure indicates that industrial structure and employment structure are more balanced.
In the process of economic development, industry structure and employment structure have a very close relationship. In the research on industrial structure and employment structure, as early as 1940, William Petty & Colin Clark found that with the development of economy, the relative proportion of national income and labor force decreases in primary industry; the second industry and the third industry have the opposite trend [1] . Simon Kuznets (1957) thought that the proportion of primary industry output value and the proportion of labor force in the national income are tending to decline with the development of modern economy [2] . H. C. Hennery Syruguin (1986) pointed out that in developing country, at the beginning stage of industrialization, the employment structure is relatively lag behind the development of the industrial structure, and only after the per capita national income reaches to $1500, they will realize synchronous progress [3] .
On the basis of that, domestic scholars also have carried on the empirical analysis on the relationship between the industrial structure and employment structure. Du Lin (2013) combined data of 1978-2011 years, using deviation index of industrial structure and employment structure and studied industrial structure and employment structure coordination status in Guizhou province [4] . Mingdou Zhang (2011) used structure deviation index and concluded that the first and third industry changes on employment changes have a tendency to increase; the second industry changes on employment variation have a tendency to reduce [5] . Qingfeng Wang (2010) arranged the theory of industry structure and employment structure coordinated development, and concluded that China’s industry structure and employment structure are in a state of imbalance, and have the characteristics of inconsistency at present [6] . Huaizhong Mu (2009) analyzed the trends and changes in industrial structure and employment structure coordination degree and the condition of industrial structure and employment structure in northeast, and then concluded uncoordination of industrial structure and employment structure [7] .
Through the above research literature, it is found that there are many explanations on industrial structure and employment structure coordination degree, more from the times series to illustrate the coordination condition between the industrial structure and employment structure, few studies on spatial difference of the industry structure and employment structure coordination degree. Therefore, this paper is on the basis of domestic and foreign scholars’ research, making an empirical analysis on spatial pattern and evolution of the industrial structure and employment structure coordination degree in China and each province, and expects to have a more comprehensive understanding on China’s industrial structure and employment structure coordination degree.
2. Spatial Pattern of China’s Industry Structure and Employment Structure Coordination Degree
China’s industry structure and employment structure coordination degree continuously improve, while the spatial pattern characteristics are gradually revealed.
2.1. The Status Quo of Spatial Pattern of China’s Industry Structure and Employment Structure Coordination Degree
By collecting Chinese 31 provinces, municipalities and autonomous regions in three installments industry the composition of GDP and employment for 2012, and to paraphrase formula:
Industry structure and employment structure deviation = (industry proportion of GDP/industry proportion of employment) − 1, calculated China’s three industries industry structure and employment structure deviation. Then calculate total deviation. Using ArcGis9.3 software, maps out China’s industry structure and employment structure coordination degree spatial distribution maps (see Figure 1).
From the Figure 1, spatial difference of China’s industry structure and employment structure coordination degree is very obvious, and presents “east, middle and west” pattern. Specifically, the colors of coordination degree in the Inner Mongolia, Xinjiang, Yunnan and other western region deeper than central region as Jiangxi, Anhui, Hunan, etc. This means that the industry structure and employment structure coordination situation of western region worse than midland region; Jiangxi, Anhui, Hunan, Hubei and other provinces in central region, the industry structure and employment structure deviation is bigger than the eastern coastal provinces, that is to say, the industry structure and employment structure coordination in central province worse than the eastern province; Jiangsu, Zhejiang, Guangdong and other economically developed eastern region, the industry structure and employment structure relationship has reached a very harmonious level. However, the coastal city, Liaoning and Hainan has a big gap with Zhejiang and Jiangsu province. Mainly because the relationship between the secondary industry industrial structure and employment structure of these two regions aren’t very harmonious. Through continuous optimization and adjustment, Guangdong, Fujian and other provinces, the coordination of

Figure 1. The provincial industry structure and employment structure deviation degree in 2012. Source: China statistical year book: 1999-2013.
industry structure and employment structure is also rising.
2.2. Evolution of the Spatial Pattern of China’s Industry Structure and Employment Structure Coordination Degree
Into the 21st century, industry structure and employment structure coordination situation in economically developed eastern coastal areas of China has been better than most cities in the midwest. In 2000, spatial difference has been initially formed in industry structure and employment structure, in general, eastern is superior to midland, midland better than the western (see Figure 2). In 2006, space difference pattern of “Eastern, Central and Western” has gradually highlights in China’s two regions—in addition to Sichuan, Ningxia, the industry structure and employment structure total coordination is relatively small, the other provinces are large (see Figure 3). And in central region of China, in addition to Jiangxi province’s industry structure and employment structure coordination degree is slightly higher than the eastern coastal areas, the rest of the central region is worse than the eastern coastal province. In 2012, space difference in industry structure and employment structure coordination degree has been fully appeared. In addition to three northeast provinces’ industry structure and employment structure coordination degree is low, the rest of eastern are higher than the western region of China. Coordination degree of central region is higher than the western region (see Figure 3).
2.3. Spatial Pattern of China’s Three Industry Industrial Structure and Employment Structure Coordination Degree
With the formation of China’s industry structure and employment structure coordination degree, industry structure and employment structure coordination degree in each industry and region has new development characteristics.
2.3.1. Spatial Difference of China’s First Industry Industrial Structure and Employment Structure Coordination Degree
With the push of urbanization, in 2012, the eastern coastal region’s first industry industrial structure and employment structure coordination degree has been significantly improved, and the gap between central region is
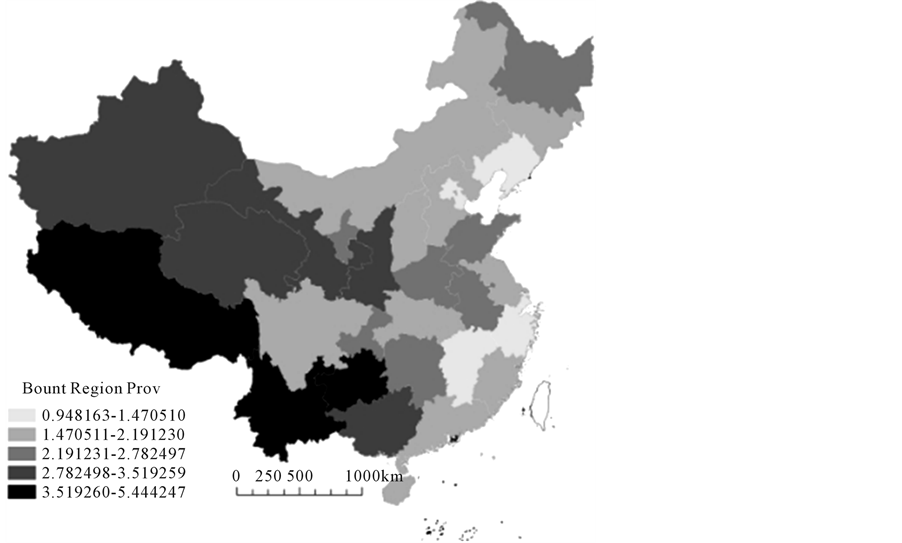
Figure 2. The provincial industry structure and employment deviation degree in 2000.
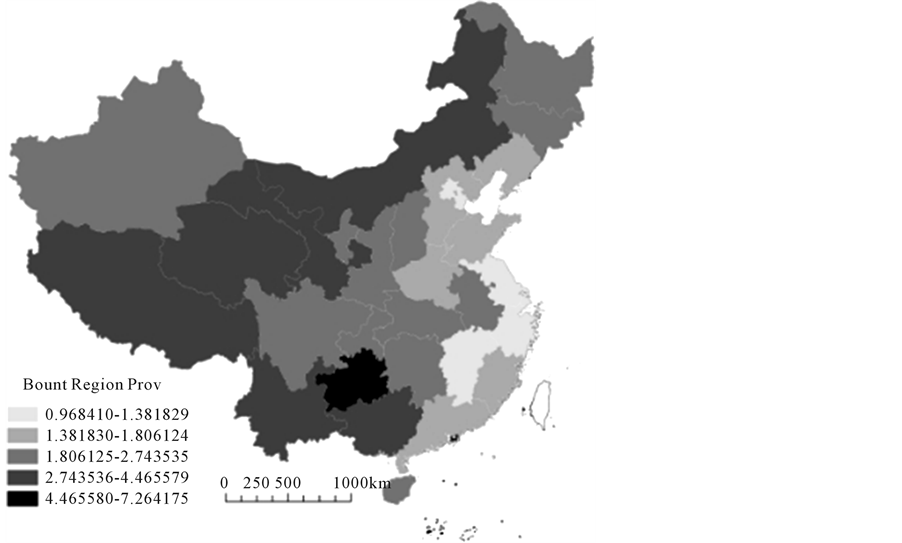
Figure 3. The provincial industry structure and employment structure deviation degree in 2006.
narrowing down (see Figure 4). Shanxi, Anhui, Hubei and most other central areas, the first industry industrial structure and employment structure coordination degree tend to fall. Inner Mongolia and other western areas, the first industry industrial structure and employment structure coordination degree has been significantly lower
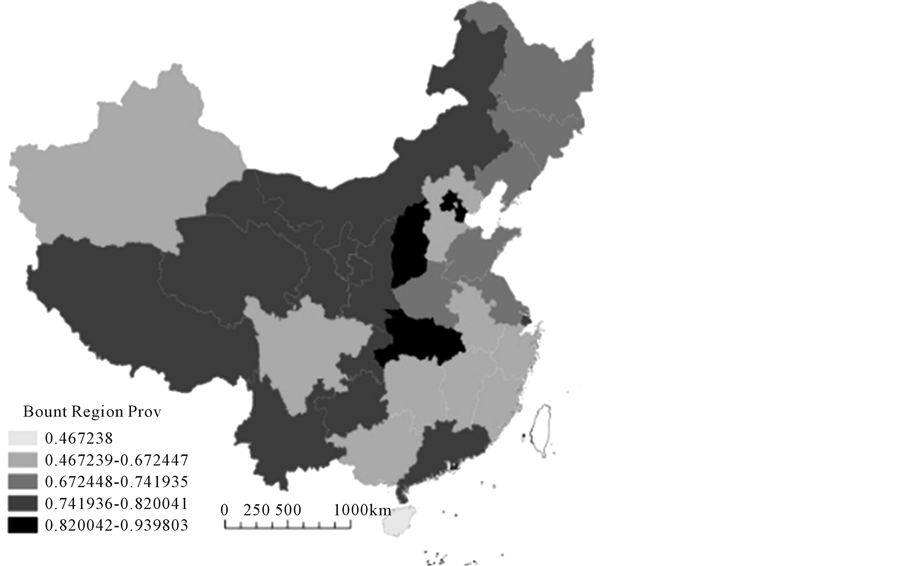
Figure 4. The provincial first industry industrial structure and employment structure coordination degree in 2012. Note: the deeper the color, the bigger the deviation.
than in the past ten years.
Generally speaking, in 2000, spatial difference of China’s first industry industrial structure and employment structure coordination degree is the coastal area lower than the midwest; midwest is no significant difference (see Figure 5). In 2006, spatial difference of China’s first industry industrial structure and employment structure coordination degree is shown as the pattern of “middle, west, and east”. Industry structure and employment structure coordination degree of Inner Mongolia, Gansu, Guizhou and other west region has been greatly reduced compared to 2000 (see Figure 6). In 2012, spatial difference of China’s first industry industrial structure and employment structure coordination degree shown as the pattern of “middle, east, and west”. Most of the western region’s industry structure and employment structure coordination degree is lower than eastern and central provinces, central region, in addition to a lower degree of Shanxi and Hubei, the rest are higher than the eastern coastal provinces. The eastern region of the industrial structure and employment structure coordination degree has significantly higher than the past decade, and many parts of the midwest the coordinated relationship between industry structure and employment structure has been destroyed. Investigate its reason, on the one hand the accelerating process of urbanization in coastal cities, a large number of surplus rural labor transfers to city, and engaged in the second or the third industry; on the other hand, with the development of economy, the adjustment of industrial structure, Zhejiang, Guangdong and other places appeared a large amount of “labor shortage”; a large number of rural employment-age population in the midwest flocked to these labor shortages in the economically developed cities and engaged in the production of live. According to the 2010 census report shows that Hubei, Guizhou, Anhui the proportion of population working out of the province more than half of the total population was 20.98%, 27.96%, 23.48%. The registered proportion of Guangdong, Zhejiang and Jiangsu population whose accounts registered in other province’s population were 58.41%, 59.41%, 58.41%. That is to say, Hubei and other midwest region become a net outflow of population, and bring out “population hollow” phenomenon, resulting in the absence of the subject vacancy of rural construction. The first industry industrial structure and employment structure coordination degree improve in the eastern region and decrease in the midwest, promoted the formation of spatial difference of China’s industry structure and employment structure coordination degree.

Figure 5. The provincial first industry industrial structure and employment structure coordination degree in 2006. Note: the deeper the color, the bigger the deviation.
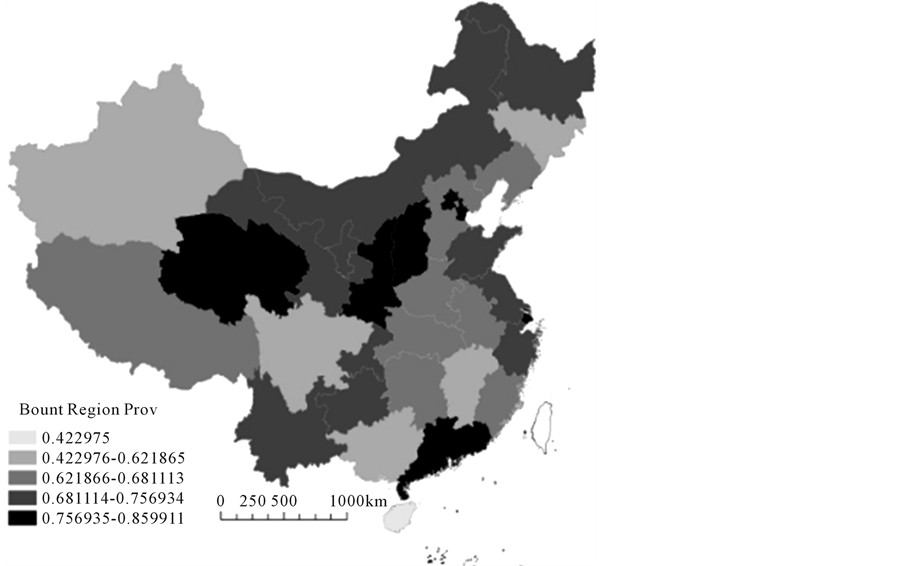
Figure 6. The provincial first industry industrial structure and employment structure coordination degree in 2000. Note: the deeper the color, the bigger the deviation.
2.3.2. Spatial Difference of China’s Second Industry Industrial Structure and Employment Structure Coordination Degree
Along with the accelerated process of industrialization, most of China’s eastern coastal provinces have entered the later period of industrialization, the second industry industrial structure and employment structure coordination degree continuously improved. And signs of improvement in midwest regions are not yet clear (see Figures 7-9). At present, spatial difference of the second industry industrial structure and employment structure coordination degree is still remains huge.
In 2000, the second industry in China, the spatial difference of industry structure and employment structure coordination degree has been formed, specific performance for the east is better than central, central is better than the west. Heilongjiang, Xinjiang, Tibet, Yunnan, Guangxi and other regions the second industry industrial structure and employment structure coordination degree was significantly higher than the rest of the 26 Chinese provinces (see Figure 7). The main reason is that the industrial structure and employment structure does not match, a large number of surplus labors do not transfer, industrial underdevelopment, and has not gave fully play to the role of absorbing labor force. In the same year, the second industry industrial structure and employment structure deviation degree in eastern coastal city is relatively small (see Figure 7). In 2006, the second industry industrial structure and employment structure coordination degree has improved to a certain extent in most regions of China, but spatial differences like this still exist—the east is better than the midwest, central region is better than the west, and there is a trend to gradually expand (see Figure 8). In 2012, after a decade of development, in addition to Inner Mongolia, Yunnan, and Guizhou’s industry structure and employment structure coordination degree had a significantly reduced than in the past ten years and the rest region has greatly improved (see Figure 9). Anhui, Henan, Hunan, and other central region whose economy is relatively backward, the second industry industrial structure and employment structure coordination degree higher than the western region, but significantly lower than the eastern coastal economic developed areas. The main reason is that the second industry in central region occupies absolutely big share of the economy, but only absorbed less than a third of the employment, and agriculture is the main force of the job creation. As of 2012, Jiangsu, Zhejiang, Guangdong and other areas, the industrial structure and employment structure has been very harmonious. Such
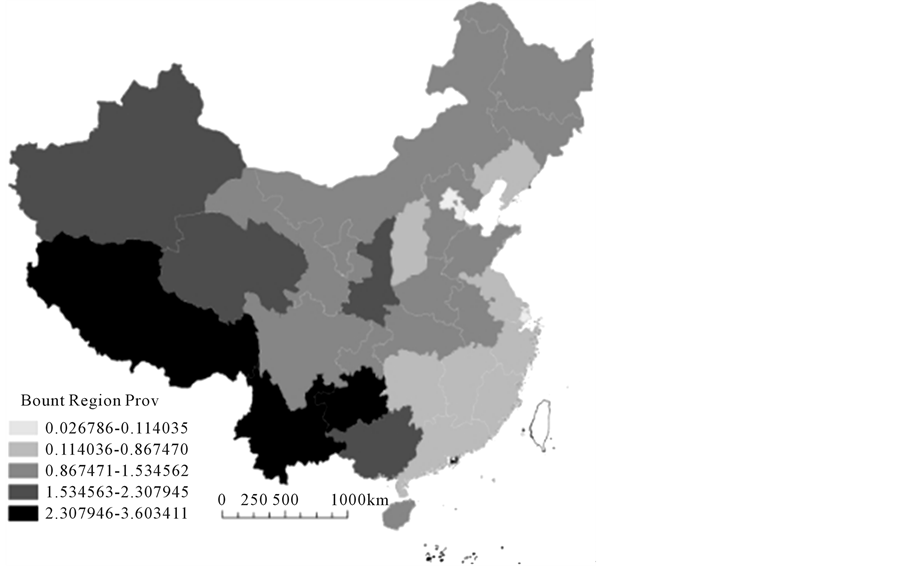
Figure 7. Provinces second industry industrial structure and employment structure coordination degree in 2012. Note: the deeper the color, the bigger the deviation.
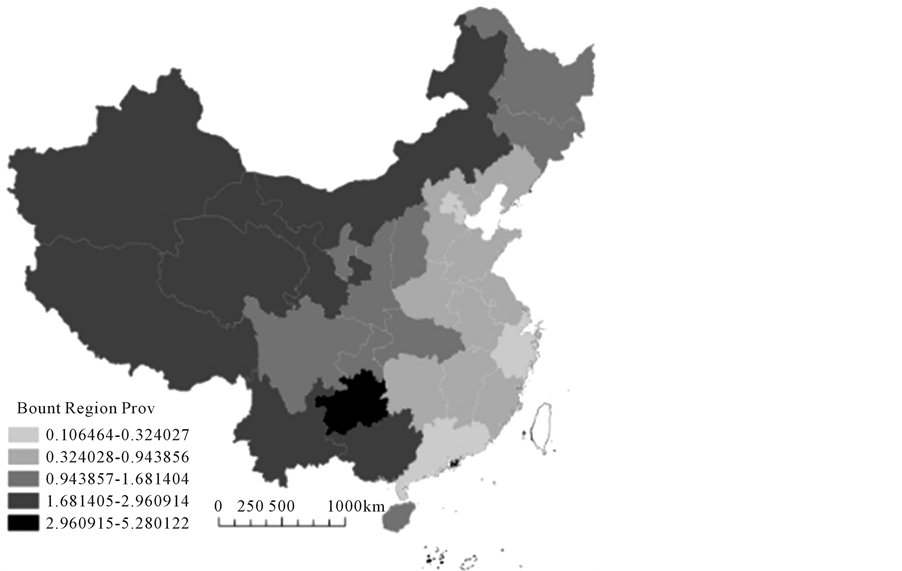
Figure 8. Provinces second industry industrial structure and employment structure coordination degree in 2006. Note: the deeper the color, the bigger the deviation.
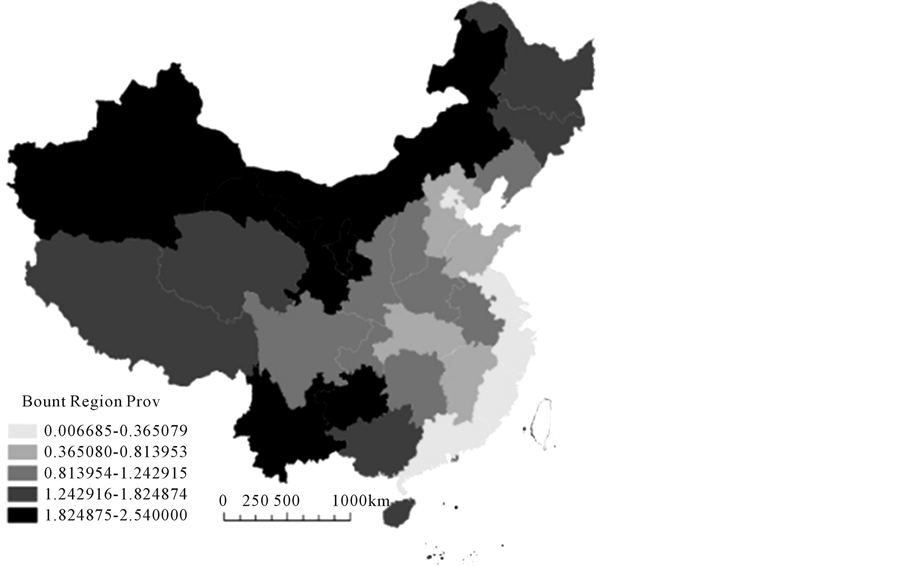
Figure 9. Provinces second industry industrial structure and employment structure coordination degree in 2000. Note: the deeper the color, the bigger the deviation.
as Zhejiang province, in 2012, its industry structure and employment structure coordination degree was only 0.0067, industry structure and employment structure highly coordinated. Thus, the development of second industry conforms to the general laws of economic development, the eastern region of the industrial structure and employment structure more coordination than the midwest region, and midwest region more coordination than the western region.
2.3.3. Spatial Difference of China’s Tertiary Industry Industrial Structure and Employment Structure Coordination Degree
The development of the tertiary industry in China started late, so that the spatial differences of China’s tertiary industry industrial structure and employment structure coordination degree is not obvious, has not yet formed a certain spatial pattern. At this stage, the speed of absorbing labor force is accelerating of the tertiary industry, and industry structure and employment structure optimized constantly.
In 2000, China’s tertiary industry industrial structure and employment structure is highly unharmonious regions major in Tibet, Yunnan and Hunan (see Figure 10). The main reason is that a large number of workingage population retention in rural and rural labor abundance, the tertiary industry did not fully play the role of absorbing labor force. In 2006, Xinjiang, Yunnan, Hunan industry structure and employment structure coordination degree had declined obviously compared to 2000 (see Figure 11). The main reason is that these regions economically underdeveloped and the proportion of output and employment are relatively small that form the phenomenon of industry structure and employment structure coordinated. In 2012, the relationship between China’s tertiary industry industrial structure and employment structure had further coordination. And form the spatial difference: north region is higher than south region, western region is lower than eastern region and central region, and central region is higher than eastern region (see Figure 12). Industrial structure and employment structure coordination degree of most central region, such as Jiangxi, Anhui, Hunan, and Henan is higher than the economically developed areas such as Zhejiang, Jiangsu. In spite of this, the third industry isn’t well developed in these areas, output value is relatively low, and the ability to absorb employment is also quite limited. Therefore, coordinated relationship between the regional industrial structure and employment structure is a
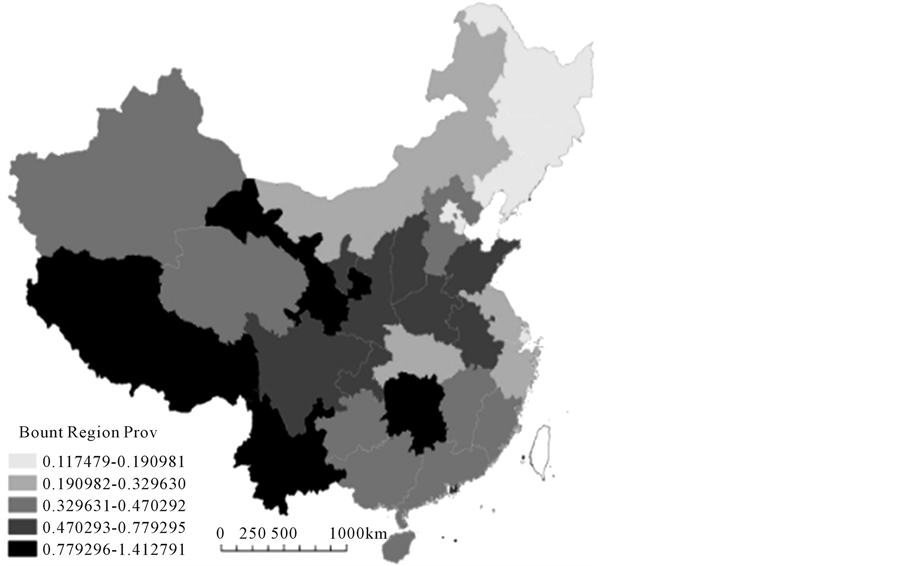
Figure 10. Provinces tertiary industry industrial structure and employment structure coordination degree in 2000. Note: the deeper the color, the bigger the deviation.
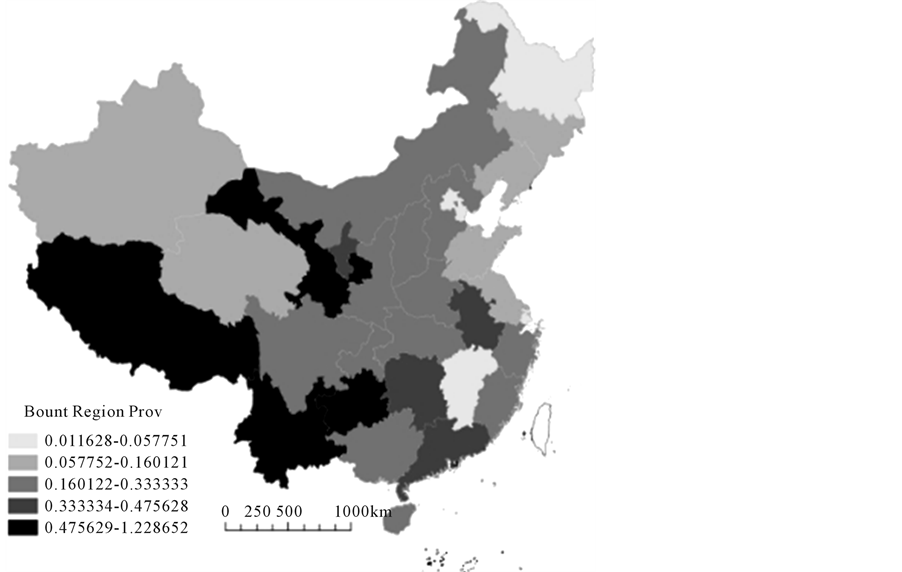
Figure 11. Provinces tertiary industry industrial structure and employment structure coordination degree in 2006. Note: the deeper the color, the bigger the deviation.
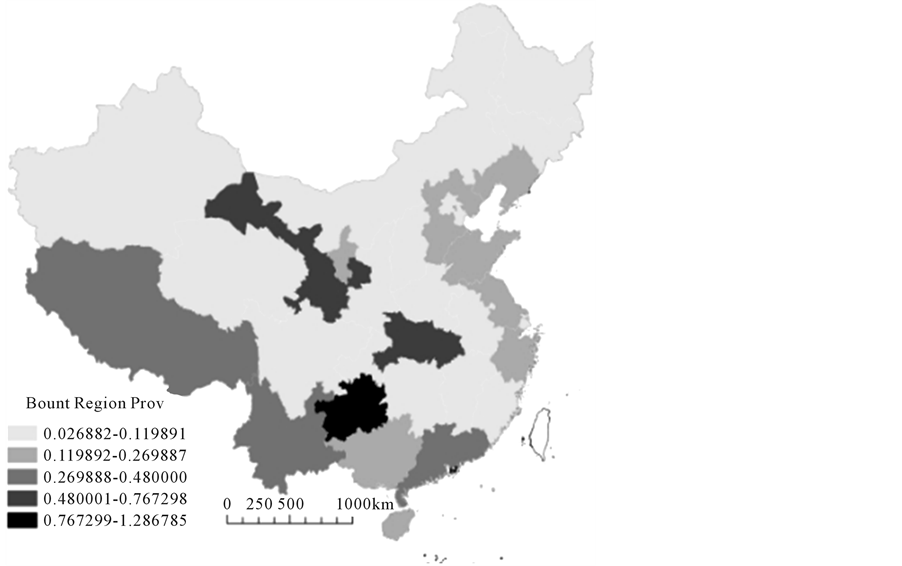
Figure 12. Provinces tertiary industry industrial structure and employment structure coordination degree in 2012. Note: the deeper the color, the bigger the deviation.
low-level, low-quality. China’s tertiary industry industrial structure and employment structure coordination degree of the northeast and northwest is higher than the southwest region. The main reason is that the ability to absorb the labor force of the tertiary industry, the northern is superior to the southwest. In 2010, Jilin, Xinjiang the percentage of tertiary industry to absorb labor force is 41.34, 36.19, Yunnan and Guangxi is 27 and 27.14, the gap is enormous.
3. Conclusions
From the above analysis, at present stage, China’s industry structure and employment structure evolution accords with the general rules of modern economic development; the relationship between industry structure and employment structure tends to be coordinated. From the industry perspective, the relationship between first industry’s industrial structure and employment structure owes to coordinate, and its development trend is still improving the level of industrialization and transfer of surplus labor; the spatial pattern of China’s second industry’s industrial structure and employment structure coordination degree has been formed; the tertiary industry is the main driver of economic development and will be the strongest industry to absorb labor in China. From the region perspective, the more developed economy does not mean that the relationship between industrial structure and employment structure is more harmonious, especially in the primary industry. The first industry’s industrial structure and employment structure coordination degree is higher in the midwest than that in the east; the second industry’s industrial structure and employment structure coordination degree is higher in the east than that in the midwest. The tertiary industry coordination degree has a weak relationship between economic developments and has not yet formed spatial pattern. From the temporal sequence of view, a large number of rural labors still accumulate in rural; the secondary industry of eastern coastal areas to absorb the labor force is shrinking; and tertiary industry should become the new direction to transfer labor force.
From the above analysis summary, while ensuring rapid economic growth, speeding up the transformation of economic development, optimizing industrial structure, achieving employment structure optimization in economic restructuring, reasonable allocation of labor resources, promoting industrial structure and employment structure’s coordinated development, ultimately achieve economic and employment synchronization growth.
Restricted by many factors, the text isn’t perfect and needs some further study, as follows:
1) Due to poor data availability, time series index system is not perfect and may be biased to evaluation results; further in-depth studies are needed combining with relevant scientific methods.
2) Evaluation method needs to be improved. This article only applied GIS evaluation model; although it achieved a satisfactory evaluation result, do not try to combine with other advanced technologies and it can’t be compared to the optimal model.
References
- Colin, C. (1940) The Conditions of Economic Progress. Macmillan & Co. Ltd., London, 395.
- Kuznets, S. (1957) Quantitative Aspects of the Economic Growth of Nations. Economic Development and Culture Change, 4, 3-111.
- Chenery, H., et al. (1986) Industrialization and Growth: A Comparative Study. Oxford Press, Oxford.
- Lin, D. and Zhang, H. (2013) Coordination of the Industrial Structure and Employment Structure in Guizhou and Countermeasures. Economic Perspectives, 82-83.
- Zhang, M.D. (2011) Evolution of Industry Structure and Employment Structure Dynamic and Interactive Efficiency Research Based on Case Analysis of Sichuan Province. Industrial Technology Economy, 41-44.
- Wang, Q.F. (2010) The Coordinated Development of Industry Structure and Employment Structure in China. Donghua Economic Management, 146-149.
- Mu, H.Z. (2009) Empirical Study of Industrial Structure and Employment Structure Coordination Degree in Northeast. Economic Perspectives, 18-20.
NOTES

*Corresponding author.