Open Journal of Animal Sciences
Vol.3 No.3(2013), Article ID:34249,9 pages DOI:10.4236/ojas.2013.33031
Sugar concentration influences decision making in Apis mellifera L. workers during early-stage honey storage behaviour
![]()
1Department of Biology and Biochemistry, University of Bath, Bath, UK; *Corresponding Author: m.k.greco@bath.ac.uk
2INVERT Group, Department of Electrical and Electronic Engineering, University of Bath, Bath, UK
3Department für Klinische Veterinärmedizin, Vetsuisse-Fakultät, Universität Bern, Bern, Switzerland
4Swiss Bee Research Institute, Agroscope Liebefeld-Posieux Research Station (ALP), Bern, Switzerland
5Institute for Zoology at the Karl-Franzens-Universität Graz, Austria
Copyright © 2013 Mark K. Greco et al. This is an open access article distributed under the Creative Commons Attribution License, which permits unrestricted use, distribution, and reproduction in any medium, provided the original work is properly cited.
Received 23 March 2013; revised 26 April 2013; accepted 20 May 2013
Keywords: Honey; Floral Constancy; Nectar; Foraging Behaviour; Decision Making
ABSTRACT
Decision making in honeybees is based on information which is acquired and processed in order to make choices between two or more alternatives. These choices lead to the expression of optimal behaviour strategies such as floral constancy. Optimal foraging strategies such as floral constancy improve a colony’s chances of survival, however to our knowledge, there has been no research on decision making based on optimal storage strategies. Here we show, using diagnostic radioentomology, that decision making in storer bees is influenced by nectar sugar concentrations and that, within 48 hours of collection, honeybees workers store carbohydrates in groups of cells with similar sugar concentrations in a nonrandom way. This behaviour, as evidenced by patchy spatial cell distributions, would help to hasten the ripening process by reducing the distance between cells of similar sugar concentrations. Thus, colonies which exhibit optimal storage strategies such as these would have an evolutionary advantage and improve colony survival expectations over less efficient colonies and it should be plausible to select colonies that exhibit these preferred traits.
1. INTRODUCTION
Many factors influence the evolutionary fitness of honeybees Apis mellifera (Hymenoptera: Apidae). Factors like foraging strategies are mediated by natural selection [1-4] and, as a consequence of net energy efficiencies, decision making strategies in individual bees which better exploit optimum food vs. energy expenditure ratios, such as floral constancy, develop over time and impact on the long term survival of colonies [5-9]. Bees gain most of their energy from simple carbohydrates when ingesting nectar or honeydew. Honeydew is a sweet exudate produced by various sap-sucking insects, mainly in the order Hemiptera, such as scale insects (Coccoidea) and aphids (Aphidoidea) [10]. The carbohydrates serve for metabolic processes, flight and normal activity and are converted to glycogen or fat for storage in repositories called fat bodies during times of excess energy intake and honey storage [11-15]. The predominant constituents of nectars, produced by floral and extra-floral nectaries on plants, are the sugars sucrose, glucose and fructose [15-18]. On occasions when nectar or honeydew are not available, bees collect sweet juices from mature fruit that is open or weeping and from other natural plant exudates [15,16,19,20]. Nectar, honeydew, juices and exudates vary in the amount and type of sugars (and therefore energy) they contain, depending on the plant and insect species from which they are derived [21] and the amount of water present in them differs with temperature and time of day [22,23]. Bees can detect various food constituents such as amino acids and cations [24-27] and will avoid foraging on unsuitable nectar such as from onions, which contain high concentrations of potassium ions [24,28-30].
Optimal foraging strategies such as floral constancy [31-33] improve a colony’s chances of survival however, although there has been significant research on nectar processing and trophallaxis [34-37] there has been only limited research on nectar storage [38-41] and to our knowledge, none on decision making for optimal storage strategies. The benefits for optimisation strategies such as efficient honeybee foraging behaviour have been demonstrated by mathematical modeling and computer simulations [42-44]. If optimal storage strategies exist, decision making would be performed by storage bees that take food from incoming foragers, honey processing bees and from storage sources inside the hive [45-49]. Natural selection would favour bees with more efficient/optimal honey storage behaviour therefore colonies whose individuals exhibit efficient honey storage behaviour will have better chances of survival. For example, if bees were to store nectar of similar sugar concentrations in cells that were close to each other the dehydration phase of the ripening process would be more efficient than for that in groups of cells that contained nectar of varying concentrations (Pers comm., Tom Seeley, 2010). Thus, colonies which exhibit optimal storage behaviour would conserve energy and have an evolutionary advantage and improved colony survival expectations over less efficient colonies.
In a previously unrelated Diagnostic Radioentomology (DR) experiment, where liquid food was labeled with radiographic contrast and placed in a feeder inside the hive, we observed that storer bees were depositing honey in groups of cells which formed patterns in the combs. Some groups of cells contained only unlabeled honey, some groups of cells contained only labeled honey and some groups of cells contained a mixture of both. From another experiment conducted by [50] we know that only young bees collect and store liquid food which is placed inside the hive. The bees were between 18 and 28 days old (1st and 3rd quartile), and they were older than nurse bees and younger than forager bees (Fisher’s least significant difference, p < 0.05). The experiment showed that the bees belonged to the caste of food storer bees, both with respect to their tasks (storing and distributing food) and to their age. Thus there are only two theoreticcal pathways possible for only labeled honey to enter cells (from feeder to storer bees to cell), two pathways possible for only unlabelled honey to enter cells (from feeder to storer bees to cell) and 60 pathways possible for a mixture of labeled and unlabelled honey to enter the same cell (from feeder to processor bees to storer bees to cell). For a detailed description of how honey is processed prior to final storage refer to [45-49] and see Figure 1 for a description of the pathways involved.
It follows that if this storage process occurs at random and if there are no behavioural influences on the storage distribution by the bees, then the theoretical honey storage frequency ratio for the cells containing the three different honey types would be 1:30:1. Thus, the random

Figure 1. A schematic diagram of the three possible pathways as evidenced by the empirical data. There are only two pathways possible for either labeled (green) or unlabeled (blue) nectar to enter a cell unmixed (a) and sixty pathways possible for a mixture of labeled and unlabeled nectar to enter a cell (b). The random theoretical multinomial probabilities distribution of these pathways gives a cell ratio of 1:30:1 for the three categories of stored nectar. Abbreviations: (C/R/P/D/S) Collector/Receiver/Processor/Donor/Storer bees.
honey storage frequency ratio is 1:30:1. Decision making by workers during honey storage behaviour would alter this ratio. Therefore more efficient honey storage behaviour has the potential to reduce energy expenditure, improve the honey ripening process and ultimately impact on a colony’s chances of long term survival. In this study we explore, using DR [51], the honey storage behaviour of bees from nine Apis mellifera colonies that were fed solutions with three different sugar concentrations.
2. MATERIALS AND METHODS
2.1. Hive Preparation
Nine colonies containing one mated/physogastric, actively laying queen and approximately 1000 workers aged between 1 and 28 days in Apidae hives (Transidea AG, Dentenbergstrasse 50, 3076, Worb, Switzerland) were prepared by removing brood and honey combs and then adding only foundation combs and labeled and unlabeled food inside the hives. The hives were closed during daylight hours, to prevent bees foraging on external food sources, and opened for one hour after sunset for hive hygiene. The food was liquid sucrose solutions in feeders that had a separator to prevent labeled and unlabeled food from mixing Figure 2. Solutions were labeled with Visipaque 320 radiographic contrast agent (GE Healthcare Inc., 3135 Easton Turnpike Fairfield, CT 06828-0001 United States).
The internal feeders in hives 1, 2 & 3 contained solutions with Treatment-1 (T1): 30% sucrose solution— 10% Visipaque 320 and Control: 50% sucrose, hives 4, 5 & 6 contained solutions with Treatment-2 (T2): 50% sucrose solution—10% Visipaque 320 and Control: 50% sucrose and hives 7, 8 & 9 contained solutions with Treatment-3 (T3): 70% sucrose solution—10% Visipaque 320 and Control: 50% sucrose. Workers tested for food acceptance showed no preference between 50% sucrose solution—10% Visipaque 320 or 50% sucrose solution and there was no toxic effect of Visipaque 320 for concentrations of up to 20% on adult worker bees (unpublished data).
2.2. Diagnostic Radioentomology (DR)
The labeled food enabled the bees’ honey storage behaviour to be traced and mapped using DR [52] on a Philips Brilliance CT 16-slice scanner (Philips Healthcare, 5680 DA Best, The Netherlands). Each cell containing honey was allocated vector co-ordinates (υ1, υ2 and υ3) using BeeView 3D visualisation software (Disect Systems Ltd., Suffolk, United Kingdom) and the Hounsfield Units (HU) for the honey in the cell was recorded using eFilmLite version 1.5.0.0—DICOM (Digital Imaging and Communications in Medicine NEMA). Scans were performed at 48 hours after introduction of bees, combs and food. This enabled time for the bees to construct cells and commence honey storage. Scans performed after three days showed that, although there was still space available on the combs the bees stopped storing honey, probably because the food was readily available from the feeders inside the hive. Workers in small
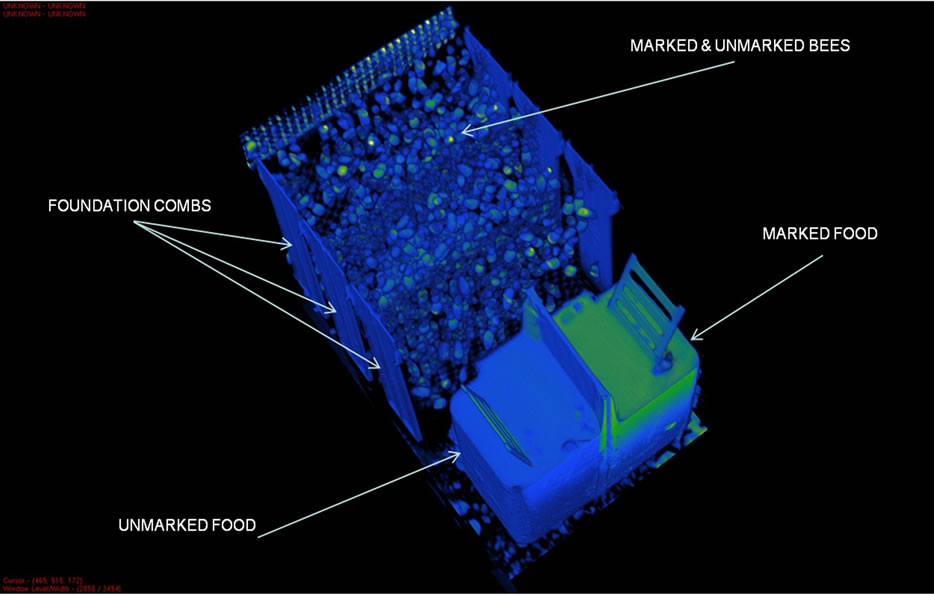
Figure 2. A 3D DR scan of an Apidae hive as prepared for mapping the in-hive honey distribution patterns. This scan was performed at the start of the experiment, just before the bees commenced building cells.
colonies have been observed behaving similarly with 50% sugar solutions placed inside Apidae hives (pers comm., Laurent Gautier 2010).
2.3. Statistics
2.3.1. Honey Storage Frequency Ratios
In utilizing the standard curve which was generated for this and future experiments Figure 3, each honey storage cell was allocated one of the three HU categories: Category-1 (C1) = 0 - 400 HU, category-2 (C2) = 401 - 700 HU and category-3 (C3) = 701 - 1500. Therefore, C1 cells contained honey without contrast, C2 cells contained honey with a combination of non-contrast and contrast honey and C3 cells contained only honey with contrast. We compared the frequencies of cells for C1, C2 and C3 to the theoretical random honey storage frequency ratio (1:30:1) for the nine hives.
2.3.2. Distribution of Storage Cells on Combs
We also tested the distribution of labelled and unlabelled honey containing radiographic contrast (as meas
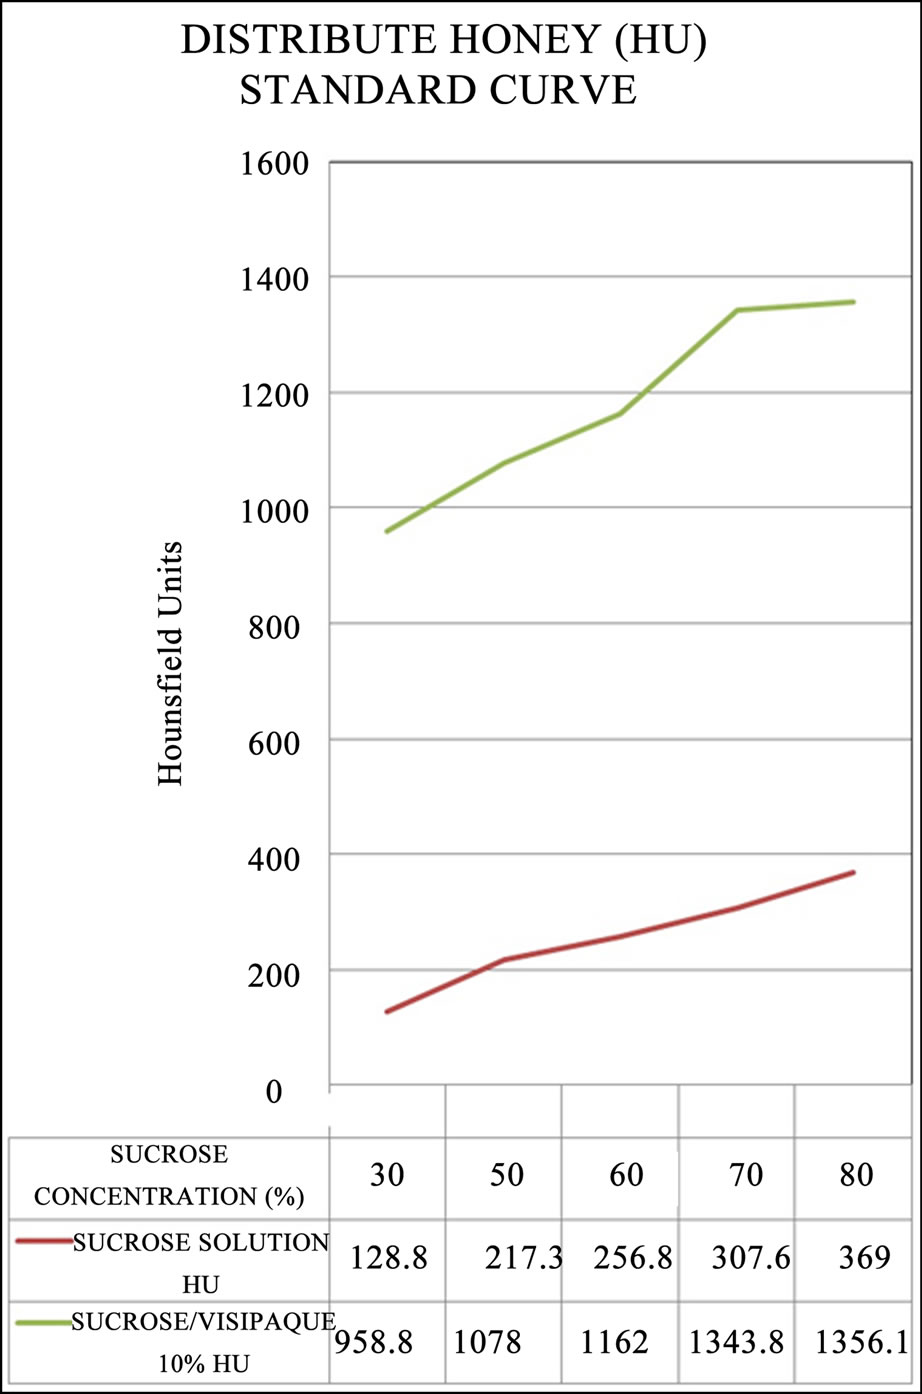
Figure 3. The standard curve produced for this experiment plotting Hounsfield Units (HU) according to sugar concentrations, without 10% Visipaque contrast agent (red) and with 10% Visipaque contrast agent (green).
ured by the HU’s) on combs from the nine hives for uniformity (within treatment groups). The “uniformity” here was not the statistical uniform distribution HU-U (min, max). The uniformity tested was given by the null hypotheses that the HU of the honey is the same in each cell (plus a random fluctuation). This in fact is the case for a normal distribution with constant mean µ and variance σ2. Therefore the null hypothesis reads H0: HU-N (µ, σ2) and the tests performed were tests on normal distribution of HU (Shapiro-Wilk, Anderson-Darling and Kolmogorov-Smirnov-Lilliefors). We also tested the distribution of labelled and unlabelled honey containing radiographic contrast (as measured by the HU’s) on combs from the nine hives for uniformity (within treatment groups). The “uniformity” here was not the statistical uniform distribution HU-U (min, max). The uniformity tested was given by the null hypotheses that the HU of the honey is the same in each cell (plus a random fluctuation). This in fact is the case for a normal distribution with constant mean µ and variance σ2. Therefore the null hypothesis reads H0: HU-N (µ, σ2) and the tests performed were tests on normal distribution of HU (Shapiro-Wilk, Anderson-Darling and Kolmogorov-SmirnovLilliefors).
2.3.3. Sugar Concentration versus Distance from Brood Centre
We then tested correlations between sugar concentrations (HU) within the honey containing cells and their Euclidean vector distances 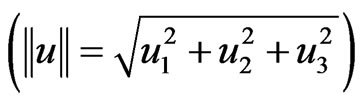 from the brood centre. Brood centre was established by locati ng the centre of the three dimensional brood (on-screen) and allocating 0, 0, 0 values for the x, y and z broodcentre coordinates respectively. The brood centre coordinates and u1, u2 and u3 were acquired with BeeView’s on screen linear calipers. Spearman correlations and Kruskal-Wallis tests for T1, T2, T3 and pooled results were performed to compare the honey sugar concentrations in cells with Euclidean vector distances and their components u1, u2 and u3 from brood centre.
3. RESULTS
3.1. Honey Storage Frequency Ratios
The theoretical polynomial distribution of honey storage frequency ratio for this experiment was (1:30:1) for (C1:C2:C3). The honey storage frequency ratios recorded from the empirical data for T1, T2 and T3 were statistically different from (1:30:1) at, 1:2:1, 3:1:3 and 1:2:4 respectively (Table 1). This was confirmed by Chi-square tests for T1, T2 and T3 being, χ2: 128.8, 226.3, and 9358.9 respectively, with 2 df and p values of < 0.001 for all three treatments Table 1. Thus, the null hypothesis that the honey storage distribution ratio of the three treatments follows the polynomial (1:30:1) distribution was rejected. Therefore, the honey storage frequency for all three treatments was not random.
3.2. Distribution of Storage Cells on Combs
The null hypothesis, H0: HU-N (µ, σ2), that the sugar concentration of the honey was the same in each cell (plus a random fluctuation) was not rejected for T1, which could be related to smaller sample size leading to low power for the test for T1, however the null hypothesis was rejected for T2 and T3. Therefore, at least for T2 and T3 the labeled food was not deposited randomly by the bees. In addition, Figure 4 shows the distribution of cells containing honey of differing concentrations to have localized, patchy spatial distributions. The patchy cell distribution was not evidenced for T2 (50% labeled

Table 1. Honey storage frequency ratios and χ2 test statistic for Treatment-1 (T1), Treatment-2 (T2) and Treatment-3 (T3) were (1:2:1), (3:1:3) (1:2:4), and 128.881, 226.314, 9358.977 respectively. The random theoretical (expected) honey storage frequency ratio was (1:30:1). Therefore the storage bees did not distribute honey at random.
50% unlabeled) indicating, as expected, that the bees could not detect differences in sugar concentrations in T2 and also that they did not show preferences for labeled or unlabeled food.
3.3. Sugar Concentration versus Distance from Brood Centre
The honey sugar concentrations in cells for T2 and T3 were statistically different and there were cells grouped together that contained honey with similar sugar concentrations for all three treatments Figure 4. There were some significant correlations between honey sugar concentrations within cells and their Euclidian distances from the brood centre for the three treatments Table 2 however the correlations were very week. These results indicate that, at least for this experiment, there were no significant relationships between honey sugar concentrations and a cell’s distance from the brood centre.
4. DISCUSSION
Our results suggest that decision making in storer bees is influenced by nectar sugar concentrations and that the bees store carbohydrates in groups of cells with similar sugar concentrations in a nonrandom way within the first 48 hours of collection. This behaviour, as evidenced by the patchy spatial cell distributions, would help to hasten the ripening process (Pers comm., Tom Seeley, 2010) by reducing the distance between cells of similar sugar concentrations. Indeed, storing nectar of similar sugar concentrations (and therefore water content) in cells that are close to each other would make the dehydration phase of the honey ripening process more efficient for those cell groups (Pers comm., Tom Seeley, 2010). Thus, colonies which exhibit optimal storage behaviours such as these would have an evolutionary advantage and improved colony survival expectations over less efficient colonies.
When storing honey from the internal feeders, the
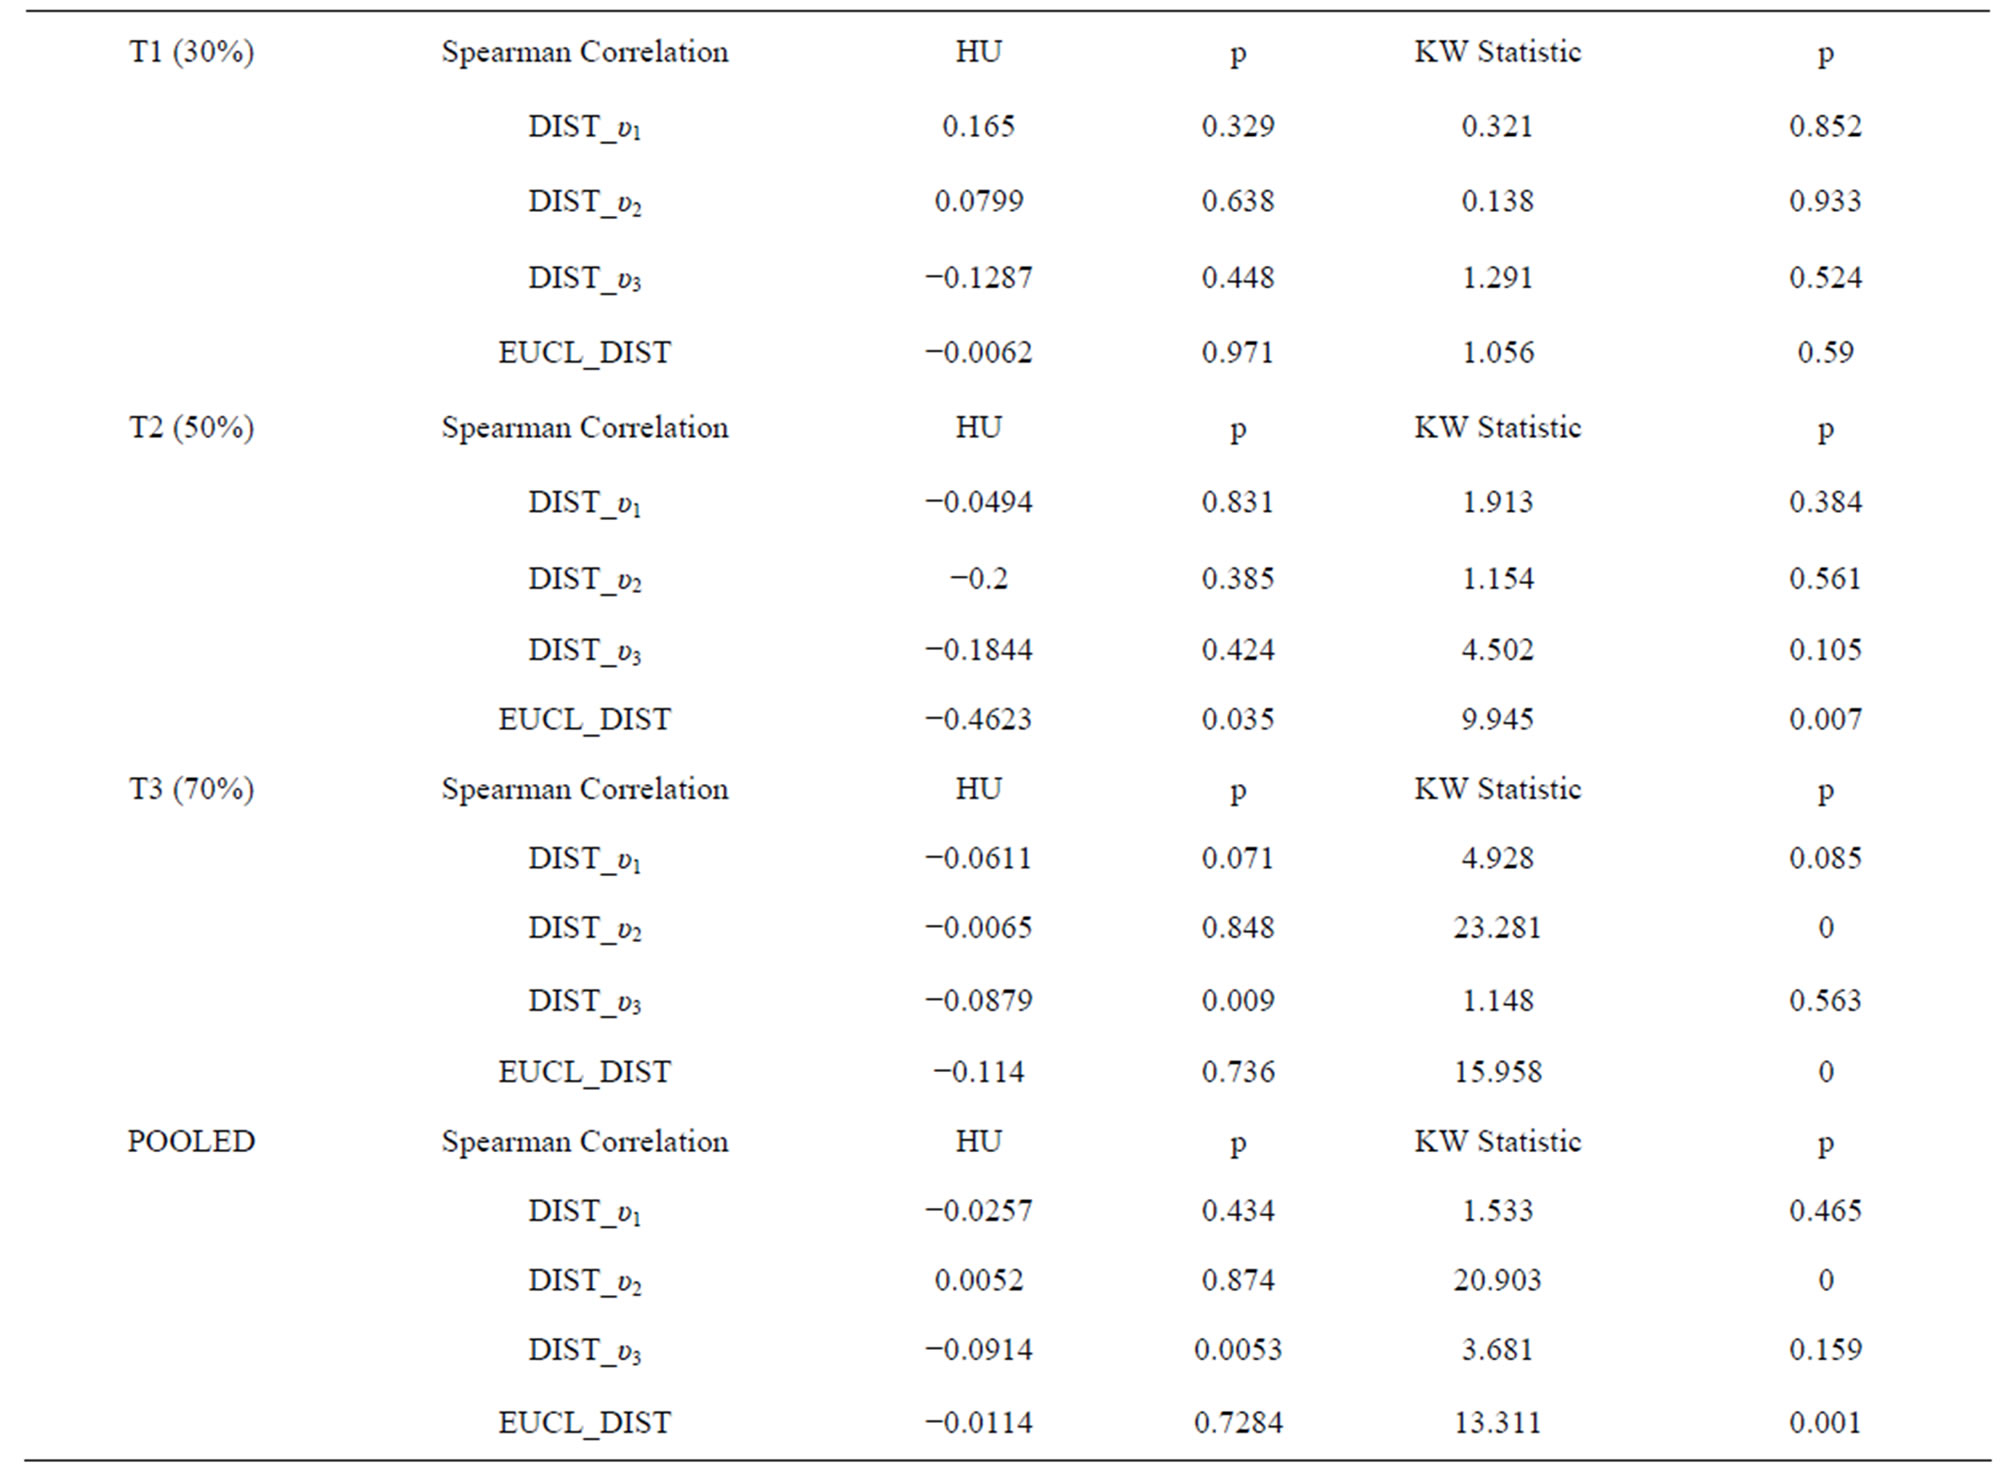
Table 2. Spearman Correlations of Hounsfield units (HU) vs. distance measures and kruskal-wallis tests on C1, C2, and C3 for T1, T2, T3 and pooled result to compare the honey sugar concentrations, as measured in HU from standard curve (Figure 3), in cells with distance from brood centre. There were some significant, but very weak, correlations betweem honey sugar concentrations in cells and their distances from the brood centre.
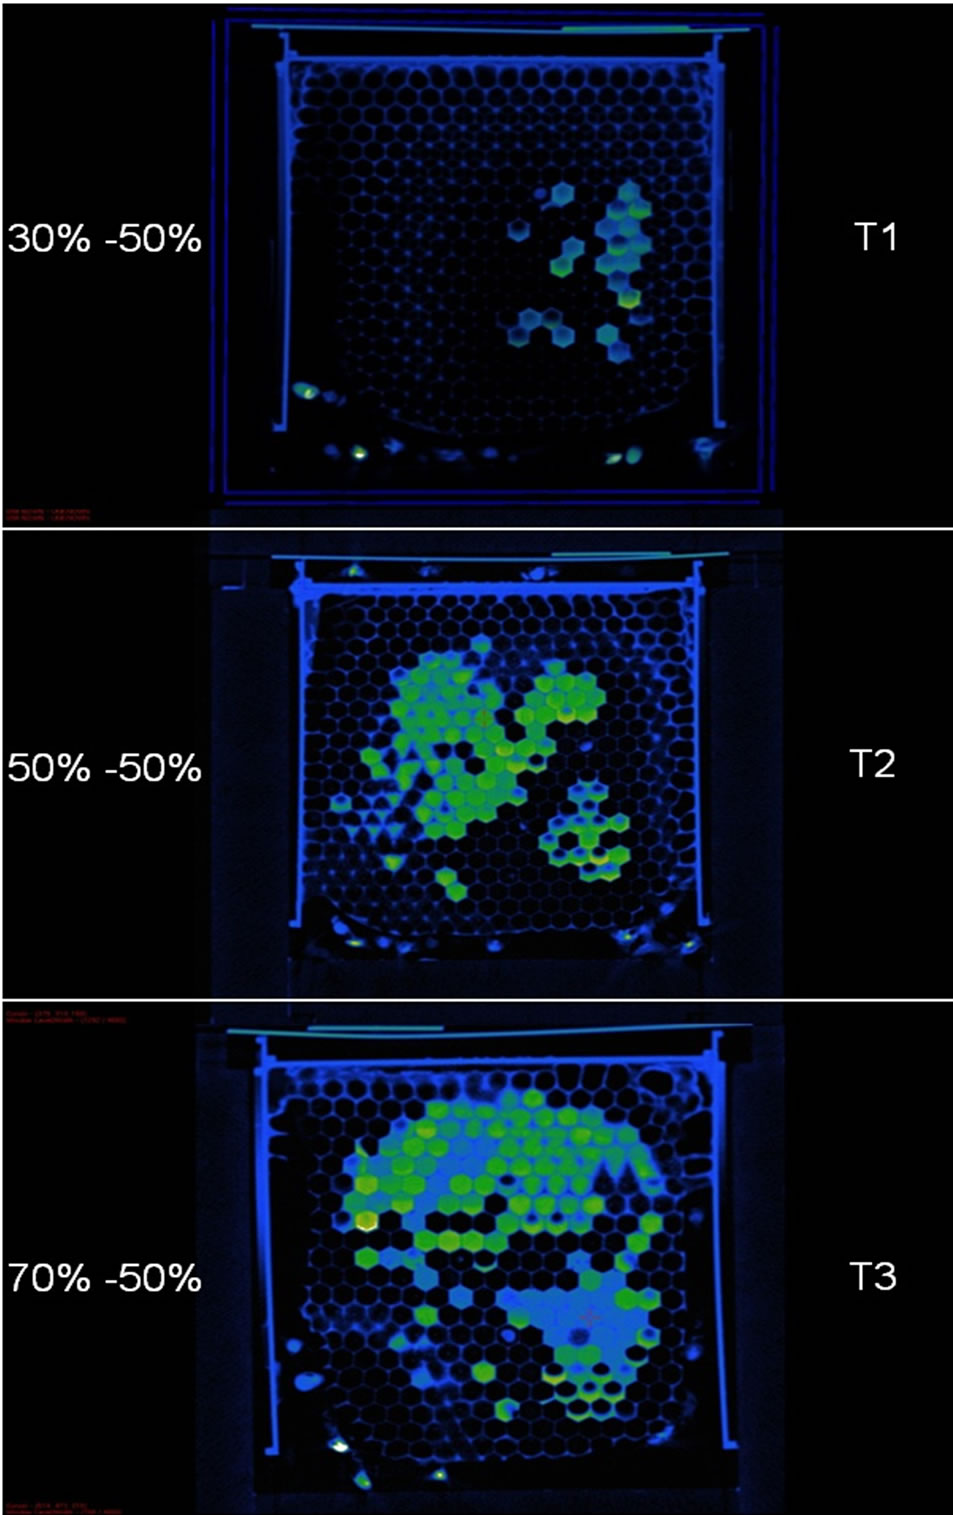
Figure 4. A 2D DR scan showing patchy distribution of cells containing honey with differing sugar concentrations (T1 & T2) and uniform distribution of cells containing honey with similar sugar concentrations (T2). The sugar concentration of Treatment 1 (T1) food was 30% labeled (green) and 50% unlabeled (blue), Treatment 2 (T2) food was 50% labeled (green) and 50% unlabeled (blue) and Treatment 3 (T3) food was 70% labeled (green) and 50% unlabeled (blue).
bees in our experiment had three foraging-storage pathways to follow Figure 1. Therefore, assuming that there were no behavioural influences acting on these pathways, the random theoretical multinomial probabilities distribution for C1:C2:C3 would follow a honey storage frequency ratio of 1:30:1 for the three categories. However, the honey storage frequency ratios for C1:C2:C3, as calculated from the empirical data in this experiment, were significantly different from this random theoretical multinomial probabilities distribution as follows:
T1 (30% - 50%) had a honey storage frequency ratio for C1:C2:C3 of 1:2:1 (p < 0.001);
T2 (50% - 50%) had a honey storage frequency ratio for C1:C2:C3 of 3:1:3 (p < 0.001);
T3 (70% - 50%) had a honey storage frequency ratio for C1:C2:C3 of 1:2:4 (p < 0.001).
The significant differences in these ratios suggest that there were behavioural influences, such as decisions on where to place honey of similar concentrations, occurring. It is therefore likely that the bees were depositing nectar according to contextual information [53], such as the location of other cells in the hive containing honey of similar sugar concentrations. Therefore, behaviours influencing the honey storage frequency ratios are most probably based on decisions for achieving optimal storage strategies. [54] suggested that the honey storage patterns in honeybees were random. Although there were no significant relationships between honey sugar concentrations and a cell’s distance from the brood centre in this experiment our data indicate, as do those of [55] and [56], that honeybees show a preference for storing honey according to sugar concentrations in the nectar. In another study, [57] found that, up to 24 hours after introduction of labelled nectar, honeybees stored at least 20% of unlabeled nectar separately. In addition, although [58] discussed search time for foragers unloading to receivers, the principle follows that when using sugar concentration as a cue, search time for nectar deposition would be a consequence of storing bees returning to a cell patch containing nectar of similar sugar concentrations. Therefore, one optimal storage strategy would be for storer bees to return to cell patches containing cells that contained similar sugar concentrations until all the cells in those patches were full. This strategy would reduce search time and thus increase storing behaviour efficiency. The DR images in this study clearly show that honeybees are producing such cell patches that contain similar sugar concentrations Figure 4.
It is plausible that storing honey in cell patches has benefits other than for those of ripening honey. Nectars collected by honeybees from different foraging patches (either natural or agricultural patches) can have differing sugar concentrations simply because the plants in these patches are growing under different local ambient conditions. In light of the current trend in global colony losses, it is crucial to mention here that the nectar from these plants might also contain other differences in constituents such as lethal or sub-lethal levels of toxins from agrochemicals and other sources [59-61]. Decision making in honeybees is based on information which is acquired and processed in order to make choices between two or more alternatives [62]. Honey storage strategies, like those shown in this experiment, would be based on information such as sensing the sugar concentrations in incoming nectar and that of the ripening honey in the cells. Although it is not clear whether honeybees can detect agrochemicals in nectar or honey, as was shown in this experiment, they might store toxin-containing nectars separately from toxin-free nectars indirectly by way of sensing the nectars’ differing sugar concentrations. This would be an effective way to prevent all the honey from being contaminated and it would reduce widespread toxin contamination in the hive and thus help prevent bee losses. [63] also suggests that honeybees store pollen with high levels of chlorothalonil separately in entombed cells which might be a phenomenon similar to the honey storage pattern behaviour shown in this experiment. In addition, there are plants in several genera from at least 11 families [64,65] that naturally produce nectars which contain constituents that have varying degrees of toxicity to bees (and humans) and there are plants that produce toxic pollen [66,67]. Foragers bring these naturally occurring nectars and pollens back to the hive. It is feasible that the naturally occurring toxins in pollen and nectar have provided the selective pressure for honeybees to improve their food storage strategies. Thus colonies that exhibit storage strategies which separate toxic from non-toxic food would have an evolutionary advantage over colonies whose bees store food indiscriminately.
We used DR to analyze results from this study and it is important to note that we applied statistics (2790 data points) to verify results that were nonetheless immediately visible using DR prior to applying the statistical tests. It is also important to note that although bees were marked with Visipaque 320, we were not able to accurately establish the number of marked and unmarked bees because of bee movement errors. Nevertheless, research on overcoming these DR limitations to enable fast (full hive scans that take less than 20 sec) and accurate results for future entomological experiments continues. For example, as with medical radiologists who use human visual pattern recognition techniques to diagnose pathology such as tumors or calculi, radio-entomologists will be able to diagnose pathology (AFB, EFB, Nosema etc.) or behavioural patterns Figure 4 by visual diagnosis. Similarly, as with medical radiologists, radio-entomologists will be able to view the results instantaneously and perform diagnoses without the need to run extensive statistics on each case.
It is clear that more DR research is now required to further explore honey storage patterns and determine if the honey storage frequency ratios shown in this study have significant efficiencies of scale as do other honeybee behaviour optimization strategies such as floral constancy. If they do, then these efficiencies will have important evolutionary implications for the long term survival of honeybee colonies and beekeepers will be able to select colonies that exhibit these preferred traits.
5. ACKNOWLEDGEMENTS
The authors wish to thank Vincent Dietemann for his help with experimental design and manuscript preparation.
REFERENCES
- Emlen, J.M. (1966) The role of time and energy in food preference. American Naturalist, 100, 611-617. doi:10.1086/282455
- MacArthur, R.H. and Pianka, E.R. (1966) On the optimal use of a patchy environment. The American Naturalist, 100, 603-609. doi:10.1086/282454
- Waddington, K.D. and Holden, L.R. (1979) Optimal foraging: On flower selection by bees. The American Naturalist, 114, 179-196. doi:10.1086/283467
- Charlton, N.L. and Houston, A.I. (2010) What currency do bumble bees maximize? PLoS ONE, 5, e12186. doi:10.1371/journal.pone.0012186
- Betts, A.D. (1935) The constancy of the pollen-collecting bee. Bee World, 16, 111-113.
- Wells, H. and Wells, P.H. (1983) Honey bee foraging ecology: Optimal diet, minimal uncertainty or individual constancy? Journal of Animal Ecology, 52, 829-836. doi:10.2307/4457
- Slaa, E.J., van Nieuwstadt, M.G.L., Pisa, L.W. and Sommeijer, M.J. (1997) Foraging strategies of stingless bees (Apidae, Meliponinae): The relation between precision of recruitment, competition and communication. Acta Horticulturae, 437, 193-198.
- Hassell, M.P. and Southwood, T.R.E. (1978) Foraging strategies of insects. Annual Review of Ecology and Systematics, 9, 75-98. doi:10.1146/annurev.es.09.110178.000451
- Kobayashi-Kidokoro, M. and Higashi, S. (2010) Flower constancy in the generalist pollinator ceratina flavipes (Hymenoptera: Apidae): An evaluation by pollen analysis. Psyche, 2010, 891906. doi:10.1155/2010/891906
- Eickwort, G. and Ginsberg, H. (1980) Foraging and mating behaviour in apoidea. Annual Reviews of Entomology, 25, 421-426. doi:10.1146/annurev.en.25.010180.002225
- Gmeinbauer, R. and Crailsheim, K. (1993) Glucose utilisation during flight of honeybee workers, drones and queens. Journal of Insect Physiology, 39, 959-967. doi:10.1016/0022-1910(93)90005-C
- Panzenböck, U. and Crailsheim, K. (1997) Glycogen in honeybee queens, workers and drones (Apis mellifera carnica). Journal of Insect Physiology, 34, 155-165. doi:10.1016/S0022-1910(96)00079-0
- Romoser, W. S. and Stoffolano, J. G. (1998) The science of entomology. McGraw Hill, Singapore.
- Suarez, R.K., Darveau, C.A., Welch, Jr., K.C., O’Brien, D.M., Roubik, D.W. and Hochachka, P.W. (2005) Energy metabolism in orchid bee flight muscles: Carbohydrate fuels all. Journal of Experimental Biology, 208, 3573-3579. doi:10.1242/jeb.01775
- Standifer, L.N. (2007) Honeybee nutrition and supplemental feeding. Beekeeping in the United States.
- Roubik, D.W. (1995) Pollination of cultivated plants in the tropics, FAO. Bulletin of Agricultural Services, 118, 1-194.
- Somerville, D. (2005) Fat bees—Skinny bees. A manual on honey bee nutrition for beekeepers. Australian Government Rural Industries Research and Development Corporation, Goulburn, 1-142.
- Brodschneider, R. and Crailsheim, K. (2010) Nutrition and health in the honeybee (Review). Apidologie, 41, 278-294. doi:10.1051/apido/2010012
- Michener, C.D. (2000) The bees of the world. The John Hopkins University Press, Baltimore.
- O’Toole, C. and Raw, A. (2004) Bees of the world. Cassell Illustrated, London.
- Percival, M.S. (1961) Types of nectar in Angiosperms. New Phytologist, 60, 235-281. doi:10.1111/j.1469-8137.1961.tb06255.x
- Bartareau, T. (1996) Foraging behaviour of Trigona carbonaria (Hymenoptera: Apidae) at multiple-choice feeding stations. Australian Journal of Zoology, 44, 143-153. doi:10.1071/ZO9960143
- de Bruijn, L.L.M. and Sommeijer, M.J. (1997) Colony foraging in different species of stingless bees (Apidae, Meliponinae) and the regulation of individual nectar foraging. Insectes Sociaux, 44, 35-47. doi:10.1007/s000400050028
- Waller, G.D. (1972) Evaluating responses of honey bees to sugar solutions using an artificial-flower feeder. Annual Review of Entomology, 65, 857-862.
- Dress, W.J., Newell, S.J., Nastase, A.J. and Ford, J.C. (1997) Analysis of amino acids in nectar from pitchers of Sarracenia purpurea (Sarraceniaceae). American Journal of Botany, 84, 1701-1706. doi:10.2307/2446468
- Inouye, D.W. and Waller, G.D. (1984) Responses of honey bees Apis mellifera to amino acid solutions mimicking nectars. Ecology, 65, 618-625. doi:10.2307/1941424
- Alm, J., Ohnmeiss, T.E., Lanza, J. and Vriesenga, L. (1990) Preference of cabbage white butterflies and honey-bees for nectar that contains amino-acids. Oecologia, 84, 53-57. doi:10.1007/BF00665594
- Williams, I.H. and Free, J.B. (1974) The pollination of onion (Allium cepa L.) to produce hybrid seed. Journal of Applied Ecology, 11, 409-418. doi:10.2307/2402194
- Gary, N.E., Witherell, P.C., Lorenzen, K. and Marston, J.M. (1977) Area fidelity and intra field distribution of honey bees during the pollination of onions. Environmental Entomology, 6, 303-310.
- Kumar, J. and Gupta, J.K. (1993) Nectar sugar production and honey bee foraging activity in three species of onion (Allium species). Apidologie, 24, 391-396. doi:10.1051/apido:19930405
- Grant, V. (1950) The flower constancy of bees. The Botanical Review, 16, 379-398. doi:10.1007/BF02869992
- Waser, N.M. (1986) Flower constancy: Definition, cause and measurement. The American Naturalist, 127, 596- 603. doi:10.1086/284507
- Slaa, E.J., Tack, A.J.M. and Sommeijer, M.J. (2003) The effect of intrinsic and extrinsic factors on flower constancy of stingless bees. Apidologie, 34, 457-468. doi:10.1051/apido:2003046
- Free, J.B. (1957) The transmission of food between worker honeybees. Brazilian Journal of Animal Behaviour, 5, 41-47. doi:10.1016/S0950-5601(57)80023-9
- Free, J.B. (1959) The transfer of food between the adult members of a honeybee community. Bee World, 40, 193- 201.
- Ribbands, C.R. (1953) Food sharing. In: Ribbands, C.R., Ed., The Behavior and Social Life of Honeybees, Bee Research Association, Ltd., London, 191-194.
- Crailsheim, K. (1998) Trophallactic interactions in the adult honeybee (Apis mellifera L.). Apidologie, 29, 97- 112. doi:10.1051/apido:19980106
- Park, W. (1925) The storing and ripening of honey by honeybees. Journal of Economic Entomology, 18, 405- 410.
- Seeley, T.D. (1992) The tremble dance of the honey bee: Message and meanings. Behavioral Ecology and Sociobiology, 47, 311-316.
- Grueter, C. and Farina, W.M. (2007) Nectar distribution and its relation to food quality in honeybee (Apis mellifera) colonies. Insectes Sociaux, 54, 87-94. doi:10.1007/s00040-007-0915-z
- Johnson, B.R. and Baker, N. (2007) Adaptive spatial biases in nectar deposition in the nests of honey bees. Insectes Sociaux, 54, 351-355. doi:10.1007/s00040-007-0953-6
- Schmickl, T. and Crailsheim, K. (2008) TaskSelSim: A model of the self-organization of the division of labour of honeybees. Mathematical and Computer Modelling of Dynamical Systems, 14, 101-125. doi:10.1080/13873950701846662
- Thenius, R., Schmickl, T. and Crailsheim, K. (2008) Optimisation of a honeybee-colony’s energetics via social learning based on queuing delays. Connection Science, 20, 193-210. doi:10.1080/09540090802091982
- Schmickl, T., Thenius, R. and Crailsheim, K. (2010) Swarm-intelligent foraging in honeybees: Benefits and costs of task-partitioning and environmental fluctuations. Neural Computing and Applications, 21, 251-268. doi:10.1007/s00521-010-0357-9
- Nunez, J.A. (1966) Quantitative beziehungen zwischen den eigenschaften von futterquellen und dem verhalten von sammelbienen. Zeitschrift für Vergleichende Physiologie, 53, 142-164.
- Farina, W.M. (1996) Food-exchange by foragers in the hive z—A means of communication among honey bees? Behavioral Ecology and Sociobiology, 38, 59-64. doi:10.1007/s002650050217
- De Marco, R.J. and Farina, W.M. (2001) Changes in food source profitability affect the trophallactic and dance behavior of forager honeybees (Apis mellifera L.). Behavioral Ecology & Sociobiology, 50, 441-449. doi:10.1007/s002650100382
- Pirez, N. and Farina, W.M. (2004) Nectar-receiver behavior in relation to the reward rate experienced by foraging honeybees. Behavioral Ecology & Sociobiology, 55, 574- 582. doi:10.1007/s00265-003-0749-2
- Grüter, C. and Farina. W.M. (2007) Nectar distribution and its relation to food quality in honeybee (Apis mellifera) colonies. Insectes Sociaux, 54, 87-94. doi:10.1007/s00040-007-0915-z
- Brodschneider, R., Hrassnigg, N., Vollmann, J., Petz, M., Riessberger-Gallé, U. and Crailsheim, K. (2007) Liquid nutrition within a honeybee colony—Who feeds? Apidologie, 38, 492.
- Greco, M.K., Hoffmann, D., Dollin, A., Duncan, M., Spooner-Hart, R. and Neumann, P. (2009) The alternative pharaoh approach: Stingless bees mummify beetle parasites alive. Naturwissenschaften, 97, 319-323. doi:10.1007/s00114-009-0631-9
- Greco, M., Spooner-Hart, R. and Holford, P. (2005) A new technique for monitoring Trigona carbonaria nest contents, brood and activity using X-ray computerized tomography. Journal of Apicultural Research, 44, 97-100.
- Seeley, T.D. (1998) Thoughts on information and integration in honey bee colonies. Apidologie, 29, 67-80. doi:10.1051/apido:19980104
- Camazine, S. (1991) Self-organizing pattern-formation on the combs of honey bee colonies. Behavioral Ecology & Sociobiology, 28, 61-76. doi:10.1007/BF00172140
- Free, J.B. and Williams, I.H. (1974) Factors determining food storage and brood rearing in honeybee (Apis mellifera) comb. Journal of Entomology, 49, 47-63.
- Johnson, B.R. and Baker, N. (2007) Adaptive spatial biases in nectar deposition in the nests of honey bees. Insectes Sociaux, 54, 351-355. doi:10.1007/s00040-007-0953-6
- De Grandi-Hoffman, G. and Hagler, J. (2000) The flow of incoming nectar through a honey bee (Apis mellifera L.) colony as revealed by a protein marker. Insectes Socieux, 47, 302-306. doi:10.1007/PL00001720
- Seeley, T.D. and Tovey, C.A. (1994) Why search time to find a food-storer bee accurately indicates the relatives rates of nectar collection and nectar processing in honey bee colonies. Animal Behaviour, 47, 311-316. doi:10.1006/anbe.1994.1044
- Sur, R. and Stork, A. (2003) Uptake, translocation and metabolism of imidacloprid in plants. Bulletin of Insectology, 56, 35-40.
- Rogers, M.A., Krischik, V.A. and Martin, L.A. (2007) Effect of soil application of imidacloprid on survival of adult green lacewing, Chrysoperla carnea (Neuroptera: Chrysopidae), used for biological control in greenhouse. Biological Control, 42, 172-177. doi:10.1016/j.biocontrol.2007.05.006
- Cloyd, R.A. and Bethke, J.A. (2010) Impact of neonicotinoid insecticides on natural enemies in greenhouse and interiorscape environments. http://wileyonlinelibrary.com/
- Seeley, T.D. (2010) Honeybee democracy. Princeton University Press, Princeton.
- vanEngelsdorp, D., Evans, J.D., Donovall, L., Mullin, C., Frazier, M., Frazier, J., Tarpy, D.R., Hayes J. Jr. and Pettis, J.S. (2009) Entombed pollen: A new condition in honey bee colonies associated with increased risk of colony mortality. Journal of Invertebrate Pathology, 101, 147-149. doi:10.1016/j.jip.2009.03.008
- Adler, L.S. (2001) The ecological significance of toxic nectar. Oikos, 91, 409-420. doi:10.1034/j.1600-0706.2000.910301.x
- Robertson, L.M., Edlin, J.S. and Edwards, J.D. (2010) Investigating the importance of altitude and weather conditions for the production of toxic honey in New Zealand. New Zealand Journal of Crop and Horticultural Science, 38, 87-100. doi:10.1080/01140671003781702
- Kevan, P.G. and Ebert, T. (2005) Can almond nectar and pollen poison honey bees? American Bee Journal, 145, 507-509.
- Mesquita, L.X., Maracaja, P.G., Sakamoto, S.M. and Soto-Blanco, B. (2010) Toxic evaluation in honeybees (Apis mellifera) of pollen from selected plants from the semi-arid region of Brazil. Journal of Apicultural Research, 49, 265-269. doi:10.3896/IBRA.1.49.3.06