Open Journal of Statistics
Vol.4 No.1(2014), Article ID:43214,4 pages DOI:10.4236/ojs.2014.41010
Exponential Ratio Type Estimators of Population Meanunder Non-Response
Lovleen Kumar Grover*, Parmdeep Kaur
Department of Mathematics, Guru Nanak Dev University, Amritsar, India
Email: *lovleen_2@yahoo.co.in
Copyright © 2014 Lovleen Kumar Grover, Parmdeep Kaur. This is an open access article distributed under the Creative Commons Attribution License, which permits unrestricted use, distribution, and reproduction in any medium, provided the original work is properly cited. In accordance of the Creative Commons Attribution License all Copyrights © 2014 are reserved for SCIRP and the owner of the intellectual property Lovleen Kumar Grover, Parmdeep Kaur. All Copyright © 2014 are guarded by law and by SCIRP as a guardian.
Received November 22, 2013; revised December 22, 2013; accepted December 30, 2013
ABSTRACT
This paper proposes some exponential ratio type estimators of population mean under the situations when certain observations for some sampling units are missing. These missing observations may be for either auxiliary variable or study variable. The biases and mean square errors of the proposed estimators have been derived, up to the first order of approximation. The proposed estimators are compared theoretically with that of the existing ratio type estimators defined by [1]. It has been found that the proposed exponential ratio type estimators perform better than the mean per unit estimator even for the low positive correlation between study variable and auxiliary variable. Moreover, we obtained the conditions for which our proposed estimators are better than the corresponding ratio type estimators of [1]. To verify the theoretical results obtained, a simulation study is carried out finally.
Keywords: Auxiliary Variable; Bias; Mean Square Error; Non-Response; Simple Random Sampling without Replacement; Study Variable
Mathematical Subject Classification: 62 D 05
1. Introduction
In survey sampling situations, auxiliary information is generally used to improve the precision or accuracy of the estimator of unknown population parameter of interest under the assumption that all the observations in the sample are available. But in many survey sampling situations, this assumption is not true. This is the case of incomplete information which may arise due to some non-response in the given sample. There are various practical reasons for this incomplete information due to non-response like1) unwillingness of the respondent to answer some particular questions2) accidental loss of information caused by unknown factors3) failure on the part of investigator to collect correct information, etc.
Such type of incomplete information is very common in the studies related to medical research, market research surveys, opinion polls, socio economic investigations, etc.
In survey sampling, when information about all the sampling units is available then it is conventional to estimate unknown population mean of study variable using ratio estimator provided that there is a positive correlation between study variable and auxiliary variable (see [2]). But, when information about all the units is not available then the traditional complete data estimating procedures could not be used straight forwardly to analyze the data. [3] discussed the situation that certain incomplete information may occur on either study variable or auxiliary variable or both of these variables. In the early investigation with non-response situations of survey sampling, [1,4-6] considered the problem of estimation of population mean. Further investigation is carried out from various angles recently by many authors viz. [7-24], etc.
We have seen that [1] considered various ratio type estimators of population mean, under different situations, when some of the observations on either the study variable or auxiliary variable are missing. In this paper, we have assumed the same situations of non-response as considered by them. In Section 2, we have proposed the corresponding exponential ratio type estimators of population mean for these situations. In Section 3, we have obtained the expressions for the biases and mean square errors (MSE) of the proposed estimators. In Section 4, the comparisons (with respect to biases and mean square errors) have been made for the proposed estimators with the corresponding existing estimators of [1]. Finally, in Section 5, a simulation study has been performed to support the theoretical results obtained earlier in this paper.
2. Notations and the Proposed Estimators
Let  and
and  denote the positive valued study variable and positive valued auxiliary variable respectively.
Assume that there is a positive correlation between  and
and . Let
. Let 
 denote the values of bivariate
  on the
  unit of population of size
 . Consider a sample, say “
 ”, of size
  is drawn with simple random sampling without replacement (SRSWOR) from this population. Now, the problem of interest is to estimate the unknown population mean
 ![]() of study variable
of study variable  when the population mean
  of auxiliary variable
  is assumed to be known.
It is assumed that  observations of
  namely
  measured on selected units in the sample are completely available. In addition to these available observations, let
 denote the available observations of
  variable on other
  units in the sample but the corresponding observations of
  variable are missing on these
  sample units. Similarly, we have a set of other
available observations of  variable, namely
  in the sample but the associated values of
variable are missing on these  sample units. Thus we have the following sub samples of the sample “
 ”:
”:
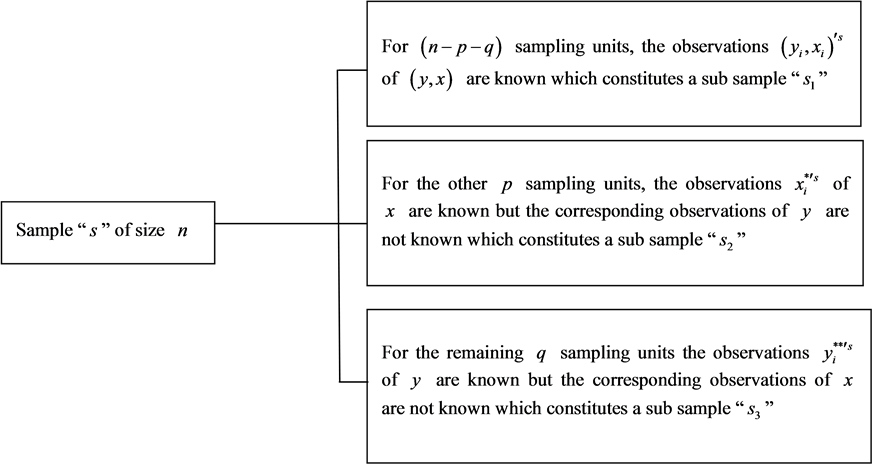
We note that

Here, the quantities  denote the numbers of distinct sampling units in the sample “
 ” with incomplete observations on bivariate
  and these must be random in nature.
Let
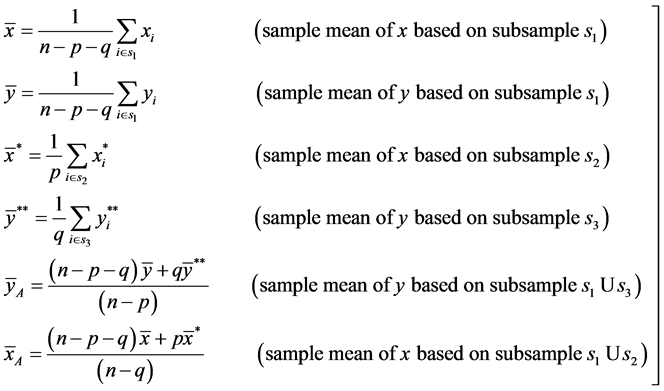 (1)
(1)
[1] defined the following four ratio type estimators of![]() :
:
 (2)
(2)
 (3)
(3)
 (4)
(4)
 (5)
(5)
In the ordinary circumstances, when there is no non-response then [25] introduced an exponential ratio type estimator of ![]() which is better than mean per unit estimator of
which is better than mean per unit estimator of ![]() even for the low positive correlation between
even for the low positive correlation between . On the other hand, the ordinary ratio estimator of
 ![]() (due to [2]) is better than mean per unit estimator for high positive correlation between
(due to [2]) is better than mean per unit estimator for high positive correlation between  and under certain conditions. On taking this advantage of exponential ratio type estimators and then considering the concept of ratio type estimators defined by [1], we have got a motivation to propose the following exponential ratio type estimators of
 (6)
(6)
 (7)
(7)
 (8)
(8)
 (9)
(9)
These four proposed estimators will now be compared with the corresponding four estimators of [1] with respect to their biases and mean square errors.
3. Biases and Mean Square Errors of Proposed Estimators
To obtain the biases and mean square errors of the proposed estimators, we proceed as follows.
Let
 (10)
(10)
Now we state the following lemma.
Lemma 3.1: Under SRSWOR, we have the following expectations:
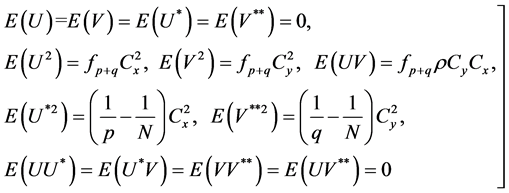 (11)
(11)
where

Proof: See Appendix 1.
Remark 3.1: We note that  and
and  always hold good, where as
 , hold good according as
 .
.
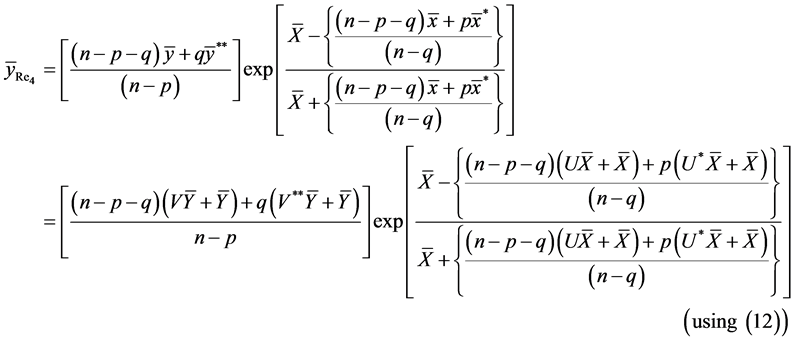
From (10), we can rewrite the following:
 (12)
(12)
Now we state the following lemma.
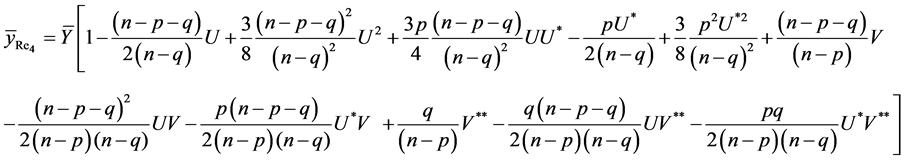
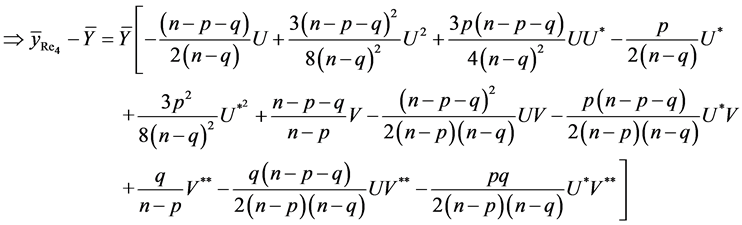
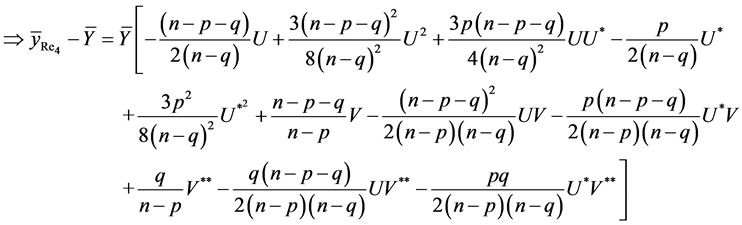
Lemma 3.2: On using (12) and retaining the terms up to second degree of  and
and  only, we can write the following:
 (13)
(13)
 (14)
(14)
 (15)
(15)
 (16)
(16)
Proof: See Appendix 1.
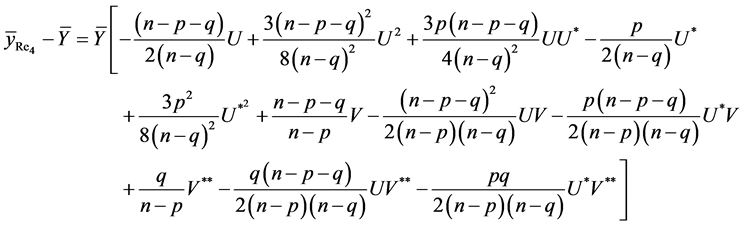
Theorem 3.1: The expressions of biases and mean square errors of the four proposed exponential ratio type estimators of![]() , up to first order of approximation, are
, up to first order of approximation, are
 (17)
(17)
 (18)
(18)
 (19)
(19)
 (20)
(20)
 (21)
(21)
 (22)
(22)
 (23)
(23)
 (24)
(24)
where

Proof: See Appendix 2.
Remarks 3.2: The expressions for biases and mean square errors of the proposed estimators (as obtained in Theorem 3.1) involve some unknown population parameters like  and
and![]() . To find the estimates of these biases and mean square errors, the general practice in survey sampling is to replace the unknown population parameters with their respective consistent estimators based on the same sample.
. To find the estimates of these biases and mean square errors, the general practice in survey sampling is to replace the unknown population parameters with their respective consistent estimators based on the same sample.
To test the superiority of our proposed estimators over the existing estimators of [1], we compare the biases and the mean square errors of these estimators.
4. Comparison of Proposed Estimators with Existing Estimators
To compare the biases and mean square errors of the proposed estimators with the estimators defined by [1], we require the expressions of their biases and mean square errors, up to first order of approximation and these are given in Table1
Remark 4.1: Note that  and
and .
.
Remark 4.2: While comparing the biases and mean square errors, we have taken  as fixed quantities in the given sample, so we must have

Remark 4.3: [26] has shown that the values of parameter  remain stable in any repetitive survey.
So while comparing biases and mean square errors of various estimators, we shall try to find the conditions on the values of ![]() under which one estimator is superior to the other estimator. In the present situations, we also note that the value of
under which one estimator is superior to the other estimator. In the present situations, we also note that the value of ![]() always lies in the interval
always lies in the interval .
.
Theorem 4.1: Up to the terms of order , we have
 (25)
(25)
 (26)
(26)
 (27)
(27)
 (28)
(28)
Proof: See Appendix 3.
Theorem 4.2: Up to the term of order , we have
 (29)
(29)
 (30)
(30)
 (31)
(31)
 (32)
(32)
Proof: See Appendix 3.
From the above two theorems, we see that our proposed estimators are superior to the existing estimators under some very simple conditions.
Theorem 4.3: Up to the term of order , we have
 (33)
(33)

Table 1. Biases and mean square errors of the existing estimators, up to first order of approximation.
 (34)
(34)
 (35)
(35)
 (36)
(36)
 (37)
(37)
 (38)
(38)
 (39)
(39)
 (40)
(40)
Proof: This theorem can be proved in the similar way as Theorem 4.2.
Corollary 4.1: On combining Theorems 4.2 and 4.3, we have the following results:
1) The mean square error of the proposed estimator  is less than that of both
  and
and  if
if  , provided that
 .
.
2) The mean square error of the proposed estimator  is less than that of both
  and
and  if
if  , provided that
 .
.
3) The mean square error of the proposed estimator  is less than that of both
  and
and  if
if  .
.
4) The mean square error of the proposed estimator  is less than that of both
  and
and  if
if  .
.
Remark 4.4: From the results of Theorem 4.3, we can conclude that four proposed exponential ratio type estimators are really better than mean per unit estimator for even the lower positive values of ![]() (or equivalently even for lower positive correlation between
(or equivalently even for lower positive correlation between ).
).
5. A Simulation Study
To support the facts proved in earlier sections of this paper, we perform a simulation study here. For this purpose, we have taken an empirical population of size 34 from [27] [page No. ]">177]. In this population, variable “![]() ” is area under wheat in 1973 and variable “
” is area under wheat in 1973 and variable “ ” is area under wheat in 1971. For this population, we have following requisite parameters:

We have simulated sample (with SRSWOR) 50 times from the above fixed population using R software (version 2.14.0).
While performing a simulation study, we use the following steps in sequence:
1) A sample, say “s”, of size  is drawn from the fixed population using simple random sampling without replacement (SRSWOR).
2) Take the fixed values of missingness rates, that is, .
.
3) Randomly, we deleted  observations from the set of observations of study variable and
  observations from the set of observations of auxiliary variable.
4) Identify the subsamples, namely .
.
5) The values of the estimators  are calculated for each triplet
 .
.
6) Calculate the variances (or approximate mean square errors) of these estimators by using their 50 values that are obtained from 50 different simulated samples drawn from the given fixed population.
We have taken the different values of triplet  as shown in Table2
In Tables 3 and 4, we have mentioned the variances of values of various estimators, considered in this paper, obtained for the simulated 50 different samples drawn from the given population on taking various values of sample sizes and values of missingness rates.
Table 2. Considered sample sizes and missingness rates.
Table 3. Variances of various estimators for sample size “n” = 12.
Table 4. Variances of various estimators for sample size “n” = 17.
Discussion, Conclusions and Interpretations
For the given fixed population,  which satisfies all the conditions, obtained in the results (29) to (32), for all values of triplet
  considered in Tables 3 and 4. Therefore, the variances of all the proposed exponential ratio type estimators are less than that of all the corresponding existing ratio type estimators of [1]. It can be verified through Tables 3 and 4.
Again for the given fixed population,  which does not satisfy all the conditions, obtained in the results (33) to (40), for all values of triplet
 , considered in Tables 3 and 4. Therefore, the variances of all the eight ratio type estimators of
 ![]() [four proposed estimators and four [1]’s estimators] considered in this paper are not less than that of the mean per unit estimator
[four proposed estimators and four [1]’s estimators] considered in this paper are not less than that of the mean per unit estimator . It can be verified again through Tables 3 and 4.
[1] REFERENCES
[2] H. Toutenberg and V. K. Srivastava, “Estimation of Ratio of Population Means in Survey Sampling When Some Observations Are Missing,” Metrika, Vol. 48, No. 3, 1998, pp. 177-187. http://dx.doi.org/10.1007/PL00003973
[3] W. G. Cochran, “The Estimation of Yields of Cereal Experiments by Sampling for the Ratio Gain to Total Produce,” Journal of Agriculture Society, Vol. 30, No. 2, 1940, pp. 262-275. http://dx.doi.org/10.1017/S0021859600048012
[4] D. S. Tracy and S. S. Osahan, “Random Non-Response on Study Variable versus on Study as Well as Auxiliary Variables,” Statistica, Vol. 54, No. 2, 1994, pp. 163-168.
[5] B. B. Khare and S. Srivastava, “Transformed Ratio Type Estimators for the Population Mean in the Presence of Non Response,” Communications in Statistics—Theory and Methods, Vol. 26, No. 7, 1997, pp. 1779-1791. http://dx.doi.org/10.1080/03610929708832012
[6] H. Toutenberg and V. K. Srivastava, “Efficient Estimation of Population Mean Using Incomplete Survey Data on Study and Auxiliary Characteristics,” Statistica, Vol. 63, No. 2, 2003, pp. 223-236.
[7] H. J. Chang and K. C. Huang, “Ratio Estimation in Survey Sampling When Some Observations Are Missing,” Information and Management Sciences, Vol. 12, No. 2, 2001, pp. 1-9. http://dx.doi.org/10.1016/S0378-7206(01)00075-1
[8] C. N. Bouza, “Estimation of the Population Mean with Missing Observations Using Product Type Estimators,” Revista Investigación Operacional, Vol. 29, No. 3, 2008, pp. 207-223.
[9] M. K. Chaudhary, R. Singh, R. K. Shukla, M. Kumar and F. Smarandache, “A Family of Estimators for Estimating Population Mean in Stratified Sampling under Non-Response,” Pakistan Journal of Statistics and Operational Research, Vol. 5, No. 1, 2009, pp. 47-54.
[10] M. Ismail, M. Q. Shahbaz and M. Hanif, “A General Class of Estimators of Population Mean in Presence of Non-Response,” Pakistan Journal of Statistics, Vol. 27, No. 4, 2011, pp. 467-476.
[11] C. Kadilar and H. Cingi, “Estimators for the Population Mean in the Case of Missing Data,” Communications in Statistics— Theory and Methods, Vol. 37, No. 14, 2008, pp. 2226-2236. http://dx.doi.org/10.1080/03610920701855020
[12] S. Kumar and H. P. Singh, “Estimation of Mean Using Multi Auxiliary Information in Presence of Non-Response,” Communications of the Korean Statistical Society, Vol. 17, No. 3, 2010, pp. 391-411. http://dx.doi.org/10.5351/CKSS.2010.17.3.391
[13] N. Nangsue, “Adjusted Ratio and Regression Type Estimators for Estimation of Population Mean When Some Observations Are Missing,” World Academy of Science, Engineering and Technology, Vol. 53, 2009, pp. 787-790.
[14] M. M. Rueda, S. Gonza’lez and A. Arcos, “Indirect Methods of Imputation of Missing Data Based on Available Units,” Applied Mathematics and Computation, Vol. 164, No. 1, 2005, pp. 249-261. http://dx.doi.org/10.1016/j.amc.2004.04.102
[15] M. M. Rueda, S. Gonza’lez and A. Arcos, “Estimating the Difference between Two Means with Missing Data in Sample Surveys,” Model Assisted Statistics and Application, Vol. 1, No. 1, 2005, pp. 51-56.
[16] M. M. Rueda, S. Gonza’lez and A. Arcos, “A General Class of Estimators with Auxiliary Information Based on Available Units,” Applied Mathematics and Computation, Vol. 175, No. 1, 2006, pp. 131-148. http://dx.doi.org/10.1016/j.amc.2005.07.018
[17] M. Rueda, S. Martínez, H. Martínez and A. Arcos, “Mean Estimation with Calibration Techniques in Presence of Missing Data,” Computational Statistics and Data Analysis, Vol. 50, No. 11, 2006, pp. 3263-3277. http://dx.doi.org/10.1016/j.csda.2005.06.003
[18] D. Shukla, N. S. Thakur and D. S. Thakur, “Utilization of Non-Response Auxiliary Population Mean in Imputation for Missing Observations,” Journal of Reliability and Statistical Studies, Vol. 2, No. 1, 2009, pp. 28-40.
[19] H. P. Singh and S. Kumar, “A General Family of Estimators of Finite Population Ratio, Product and Mean Using Two Phase Sampling Scheme in the Presence of Non-Response,” Journal of Statistical Theory and Practice, Vol. 2, No. 4, 2008, pp. 677- 692. http://dx.doi.org/10.1080/15598608.2008.10411902
[20] H. P. Singh and S. Kumar, “A General Procedure of Estimating the Population Mean in the Presence of Non-Response under Double Sampling Using Auxiliary Information,” Statistics and Operations Research Transactions, Vol. 33, No. 1, 2009, pp. 71-84.
[21] H. P. Singh and S. Kumar, “Improved Estimation of Population Mean under Two-Phase Sampling with Sub Sampling the NonRespondents,” Journal of Statistical Planning and Inference, Vol. 140, No. 9, 2010, pp. 2536-2550. http://dx.doi.org/10.1016/j.jspi.2010.03.023
[22] H. P. Singh and S. Kumar, “Combination of Regression and Ratio Estimate in Presence of Nonresponse,” Brazilian Journal of Probability and Statistics, Vol. 25, No. 2, 2011, pp. 205-217. http://dx.doi.org/10.1214/10-BJPS117
[23] S. Singh, H. P. Singh, R. Tailor, J. Allen and M. Kozak, “Estimation of Ratio of Two Finite-Population Means in the Presence of Non-Response,” Communications in Statistics—Theory and Methods, Vol. 38, No. 19, 2009, pp. 3608-3621. http://dx.doi.org/10.1080/03610920802610100
[24] H. P. Singh and R. S. Solanki, “Estimation of Finite Population Means Using Random Non-Response in Survey Sampling,” Pakistan Journal of Statistics and Operation Research, Vol. 7, No. 1, 2011, pp. 21-41.
[25] H. P. Singh and R. S. Solanki, “A General Procedure for Estimating the Population Parameter in the Presence of Random NonResponse,” Pakistan Journal of Statistics, Vol. 27, No. 4, 2011, pp. 427-465.
[26] S. Bahl and R. K. Tuteja, “Ratio and Product Type Exponential Estimators,” Journal of Information and Optimization Sciences, Vol. 12, No. 1, 1991, pp. 159-163. http://dx.doi.org/10.1080/02522667.1991.10699058
[27] V. N. Reddy, “A Study on the Use of Prior Knowledge on Certain Population Parameters in Estimation,” Sankhya, Sr C, Vol. 40, 1978, pp. 29-37.
[28] D. Singh and F. S. Chaudhary, “Theory and Analysis of Sample Survey Designs,” New Age International (P) Limited Publishers, New Delhi, 2002.
Appendix 1
Proof of Lemma 3.1: Taking

where  denotes the conditional expectation based on the sub sample (either
  or
or ![]() or
or![]() ) under the condition that both p and q are fixed for the given sample s.
) under the condition that both p and q are fixed for the given sample s.
Now 
where  is the sample mean of x based on whole complete sample “s”.
Hence the required result.
Again taking

Hence the required result again.
Similarly, we can prove the other results of Lemma 3.1.
Proof of Lemma 3.2:
Due to complex form of estimator , we are recalling estimator as defined in (9).
On retaining the terms only up to second degrees of  we have

which is the required result.
Similarly, we can prove the other results of Lemma 3.2.
Appendix 2
Proof of Theorem 3.1: Again due to complex nature of estimator , we prove the results (23) and (24) only. So, from (16), we have
The bias of , up to the terms of order
 , is given by

On using the values of expectations, as obtained in Lemma 3.1, and then simplifying, we have

Hence the result (23) is proved.
Again by definition, the mean square error of  is given by

The mean square error of , up to the terms of order
 , is
, is

On retaining the terms only up to second degrees of , we have
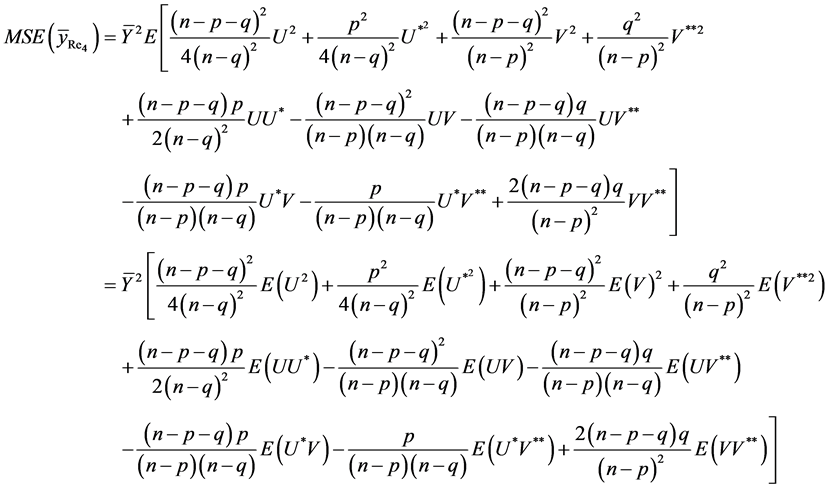
On using the values of expectations, as obtained in Lemma 3.1 and then simplifying, we have

Hence the result (24) is proved.
In the similar way, we can prove the other results (17) to (22).
Appendix 3
Proof of Theorem 4.1:
Here we give the proof of the result (28) only. The proofs of other results of this Theorem are similar.
Taking


(on using (23) and Table 1)

(on squaring both sides of the inequality and then simplifying)


 (A3.1)
where

Noting that 
For , we have the following two cases:
Either case 1: When  and
and  then it implies that
  and
and . Thus we must have
Or case 2: When  and
and  then it implies that
  and
and .
.
Thus we must have 
On combining Case 1 and Case 2, we conclude that for  we must have either
  or
or , that is,
 (A3.2)
Thus from the results (A3.1) and (A3.2), we have got that

Hence the result (28) is proved.
Proof of Theorem 4.2:
We give here the proof of the result (32) only. The proofs of other results of this Theorem are similar.
Taking


(on using (24) and Table 1)

or if 
Hence the proof of result (32) is complete.
NOTES

*Corresponding author.