Open Journal of Geology
Vol.07 No.09(2017), Article ID:79192,21 pages
10.4236/ojg.2017.79093
The Introduction of Promising Mineral Zones Bidkhan Area Using Satellite Imagery
Alireza Ashofteh
Young Researchers and Elites Club, Aran va Bidgol Branch, Islamic Azad University, Kashan, Iran

Copyright © 2017 by author and Scientific Research Publishing Inc.
This work is licensed under the Creative Commons Attribution International License (CC BY 4.0).
http://creativecommons.org/licenses/by/4.0/


Received: February 23, 2015; Accepted: September 17, 2017; Published: September 20, 2017
ABSTRACT
On the basis of new findings and some evidences related to porphyry mineralization, the exploration region of Bidkhan is considered as a promising mineral region for discovery of porphyry sort deposits. The findings from various sections indicate that diverse topological events in a zonal and regional time span have resulted in physiochemical (thermodynamic) systems leading to expansive alterations (metamorphism) and mineralization in the central region of Bidkhan area. Alterations such as Propylitic, Silicating, Argillic, Phyllic and even Potassic concentrates at an area of about 10 km2 together with such structures as fissures have created the required and suitable condition for the formation of thermodynamic systems. Such systems are related to mineralization fluids mineralizer that accompanies the sort of activities that are clearly indicative of the existence of an active igneous source all forming a terrene at Bidkhan region which is very similar to mineralization porphyry systems.
Keywords:
Bidkhan, Kerman, Geochemistry, Satellite Images, Promising Regions, Mineral Potentials

1. Introduction
The 100 km exploratory terrene of Bidkhan is a part of a topological geology sheets with 1:100,000 scale at Bardsir and Gonbad locations (Figure 1). According to geological partitioning defined, the Bidkhan is located at the southern zone of central Iran (Figure 1). Having made photo-geological aerial imaging and in order to make a better geology draft map, the satellite data was processed with the aim to segregate the rocky units and altered zones. The next step was to

Figure 1. Location of the area under study on the sub-regional segmentations of Iran.
process the geochemical data and modulate them with a draft geological map in order to prepare a draft geological map to be used as the datum for field works [1] .
2. Satellite Data Processing
The remote monitoring is the study, identification, and recording of physical and chemical characteristics of earth surface and atmospheric phenomenal evolvements and also partially studying the 80 cm depths of the earth. This is done by means of recording the spectral reflections of evolvements of global phenomenon with different wavelengths and electromagnetic waves which can subsequently be used as digital values. Due to undeniable advantages in remote sensing methods, today such technique is considered one of the fundamental and basic tools for investigation and study of underground resources in all parts of the globe (Arian & Aram, 2014). The region under study that consists of two 1:100,000 geological scale is laid in two ETM+ data scenes with 160 transient numbering at row 39 and with 160 transient numbering at row 40 related to the year 2002 and in four ASTER data scenes. After the modification of radiometric and geometry of the mentioned sheets these scenes were mosaic connected with each other:
Image Figure 2. Surveyor ETM+ (Enhanced Thematic Mapper) which is installed on Lands at Satellite receives images with following features:
1) Visible Near Infrared Images (VNIR) reflection images in 6 bands with 30 m global resolution.
2) Thermal Near Infrared Images (TNIR) in 6 bands with 30 m global resolution.
3) Panorama image in visible area with global resolution of 15 m range.
3. Method of Investigation
The remote sensing (remote survey) methods at the region under study were applied using (No 7) Landsat and ASTER Satellite data. At the first stage, in the general region and within regional zone scale (25,000 km), the ETM satellite studies or data were identified in order to specify the promising mineral regions based on original argillic alteration and iron oxide indicators whereat potentialities for mineralization exists. Thereafter, with the extrusion of altering regions to be used for further investigations and the segregation and zone segmentation of the altering regions, use of data with high ASTER spectral resolution was made. These data elucidated the capability of extrusion at the altering region (metamorphosis). In the next step by using of this data, as far as possible the extrusive

Figure 2. Location of the region under study relative to ETM scenes.
ASTER alterations data were used for the interpretation of ETM information in order to make further investigations on ASTER data and eventually different alteration zones were segregated so that the results obtained were used as various remote sensing layers and were thus utilized in the exploratory tracking inquisitions (Youna Lyons, 2014).
The aim of this project is to rely on applied methods in remote sensing for identifying and introducing the points of the area with higher mineral concentration potentials. Such investigation was processed within four stages of compilation of existing geological data of known mineral indices and existing satellite data. Then the information was interpreted, the results presented and the promising mineral regions introduced comprehensively. The result of these investigations led to the preparation of thematic satellite maps such as various rock units including igneous deformation, fractures and alterations and promising areas. According to this image, the maps and information interpretation, the following areas are introduced for global control and subsequent stages Table 1.
Area 1: Promising areas of Bidkhan mountain.
Area 2: Promising areas of Panj 1 mountain.
Area 3: Promising areas of Panj 2 mountain.
Area 4: Promising areas at north of Panj mountain.
Area 5: Promising areas of Chehargonbad mine.
Area 6: Promising areas of Cheheltan mountain.
Area 7: Promising areas of Nata’ mountain.
Area 8: Promising areas at west of Sang-e-Siyah mountain.
Area 9: Promising areas of Siyah mountain.
4. Spatial image Enhancement (Data Fusion)
Reconstruction of images includes radiometric, spectral and spatial initiations. In radiometric reconstruction, the histogram scope of images is extended by linear and non-linear methods. This practice is performed by stretch approach and is applied to the histogram of images. As such, the scope of image histogram is stretched by use of various linear and non-linear methods and the images are converted to DN by use of such approaches as linear, algorithmic, and illustra-

Table 1. Promising areas manifested by satellite processing together with their geographical coordinates in UTM system.
tive demonstrative stretches and equilibrating of histogram. In spectral reconstruction, a red-green-blue multi-color cubic (or RGB) system is used. Here, the 3 color, red, green and blue are placed in the tri-axels of a cube and with considering the position of DN pixel in the 3D system, one color is defined for the DN pixel and the linear combination of the three colors mentioned are then displayed [2] .

In the spatial reconstruction where different techniques are applied, the images with different spatial resolutions are merged into one another and form a composite. For this purpose, different methods are applied one being the use of principal components analysis method or PCA. In order to increase the global resolution of the panchromatic 8th band of ETM images, such information are modulated in bands 1, 2, 3, 4, 5 and 7 based on an operator called the merge resolution whereby the global resolution of the mentioned bands except the 6th band is enhanced from 30 m to 15 m and the operation is performed according to the following algorithm, Figure 3.
5. Radiometric Enhancement by Contrast Intensification of Images Reconstruction
The aim is to make satellite data processing or data extrusion and identification of different objectives from the satellite image. There are 2 satellite data processing methods:
1) Visual Processing.
2) Digital Processing.
In visual processing, the user extrudes different attributes from the image by taking into consideration the characteristics of the image. However, in digital processing, the required pattern is introduced to the software as the training sample and is automatically verified by the whole image. By combining the two processing methods, more precise and improved data is extruded from the satellite image. In the project, after using the digital method, visual interpretation is applied in order to improve the results. Enhancement and then reconstruction can in turn help to extract the important controllers. In the enhancement stage, attempt is made to obtain as far as possible a more lucid and clear image. Thus, an overall framework is used in the image for increasing the contrast and brightness and adding such enhancers as:
1) Linear.
2) Equalizing.
3) Infrequency.
4) Intensity [3] .
In the reconstruction stage, in addition to the radiometry enhancements already mentioned, use of spatial enhancement and spectral enhancement can


Figure 3. Comparison of reconstruction in the 2 satellite images.
help. In the reconstruction using the spatial method, the crisp, Resolution Merge, Statistical Filter, Adaptive Filter, Convolution, Non-Directional Edge, Focal Analysis and Texture Logics can be applied. In the area under study in the sheets involved, the same formation as mentioned before was used in the resolution merge approach for enhancement of 6th band of the ETM with resolution enhancement from 30 m to 15 m. In the reconstruction by means of spectral enhancement, the two methods of principal components and inverse principal components can be applied. In the area under study, the principal components analysis methods are used. Today, one of the most important analysis approaches by the statistics community is the principal components analysis. One of the most significant issues concurrent the investigation is the changes in variables in one location under study and their eventual visualization and disclosure. Here in the analysis, in fact the correlation between the intensity of a variable (reflection or the brightness level of a pixel) in order to show their pattern of simultaneous changes in one location is expressed. Among other objectives is the use of data reduction in order to simplify the great amount of variables for easier decision-making. In this method a special vector of each pixel is used. Each special vector in relation to other vectors can be perpendicular with one another (and not interrelated) and/or can be oblique with each other (rather than interrelated). In a remote sensing interpretation in order to discover and enhance the hidden relationship between the variables (the degree of reflection in each pixel), this method can disclose the relationship, if any, between the image cells (pixels) (Figure 4).
It should be mentioned that the area under study the classification technique is also used for modeling of units that have already undergone alteration (Figure 5). The performed supervised and unsupervised analysis did not render any remarkable results. Another method was the use of rationing of bands (band ratio). In this method, verification is made on the basis of the studied behavior of the minerals against electromagnetic waves and the plotting of graph for the wave length against reflective spectrum of different minerals. Subsequently, it was verified that the relative 3/1 ratio bands for iron from one band, and 4/5 band for Ferro-iron and 5/7 relative band for the enhancement of hydroxide minerals (clays) and others and also 4/2 relative band for green-land regions is used. In this method, if he red, blue, and green filters are 5/7, 4/2 and 3/1 respectively, then a satisfactory result is obtained in so much as the argillic alteration regions obtained are pink color, and iron-oxide are light-blue, and green regions are yellow in the virtual color images attained from the relative bands combination and can be segregated (Figure 6).

Figure 4. Construction of PCA from bands 1 to 7 in order to extract alterations.


Figure 5. Alteration regions in the common area of Bidkhan extruded by the present PCA method.

Figure 6. Image obtained from rationing of bands at common area of Bidkhan and its suburbs.
The 3rd method is Image filtering which is among the rest of applied methods for processing by use of low pass filters such as median with 3 × 3 and 7 × 7. Also, the method uses high pass filters such as: edge sharpen filter with various matrices such as 3 × 3 and 5 × 5 on various bands especially 4, 5 and 7th bands. The method causes the disposure of the edges and the means to verify the linear and contour phenomena. Also, the use of laplacian edge detector of the 1st category on bands causes the exposure of the ring structures and directional type filter with 3 × 3 and 5 × 5 matrices for verification of fissures with different azimuths is used. Additionally, other geological and morphological elements and factors can be used for the interpretation of factures (Figure 7).
According to required data for extrusion of satellite images, one of the above methods is selected. Here, due to the high diversity in geological terrains in the satellite image, the results of different image classification algorithms shall be void of sufficient accuracy. The extruded information from the satellite image in this project is the alteration of clay, iron and fissures, contours and geological structures especially, ring structures (Figure 8). Which as layers were prepared using the data from rationing tools from bands, and by principal component analysis and filtering of the image?

Figure 7. Image from filtration of satellite data of Bidkhan region and its suburbs.

Figure 8. Ring structures resulting from 1:100,000 sheets satellite images of Bardsir at the right corner and Chehargonbad at the left corner.
6. Final Interpretation and Processing of ETM Image
6.1. Verification and Plotting of Factures and Fissures at Region under Study
Basically, the tectonic structures especially the fissures can play a major role in the formation of mineral reservoirs. Today, many of the deposits are presented in the form of a descriptive mode and the majority of their structural role are determinant factors and in a certain way are the positioning of the deposits in relationship to different structures existing in the studied region. As a whole it can be said that the tectonic-magma phenomena can have a significant role in the control and formation of deposits. Thus, the identification of various structural components and verification of the structures in each region with high accuracy is possible with remote sensing technique. The plotting of the structures of each region in the zone under study, is yet another step towards quicker arrival at the mineralization areas, because, the concentration of tectonic structures as the means for identification and exploration of minerals and deposits can be of great help. Accordingly, the project here for the plotting of fissures used a variety of methods (Figure 9). Is a sample of the application of satellite images related to extrusion of linear structures (fissures) [4] ?
The layer structure includes contours and ring structures. The linear terrains include high frequency terrains for restructuring of which high pass filters can be sued. The identification of contours on images with 1, 3 and 5 combination underwent RGB and equilibrium enhancement and in order to visually interpret them with higher accuracy percentage, High Pass Edge (sharpening) was applied. Since smaller and lesser local structures are involved in mineralization, the main and modulated trends are disintegrated. As evident, the dominant trend is north-western to south-eastern. After the extraction of contours, the ring structures are also separated. These structures indicate the probability of existence of intruders in the underground surface too. Thus, they are evidences for the effect of mineralization in the region (Figure 10).

Figure 9. Structures and linear fissures (fault) resulting from 1:100,000 sheets satellite images of Bardsir at the right corner and Chehargonbad at the left corner.

Figure 10. Ring and linear structures (fault) in the common area of Bidkhan1:100,000 sheets of Bardsir at the right side and Chehargonbad at the left side of the image.
6.2. Distinguishing and Segregation of Igneous Structures and Intruding Lumps
The formation of many types of deposits is related directly or indirectly with the processes of magmatism. Thus, the distinguishing of the type of magmatism and separation of the igneous lumps and the verification and expansion of these igneous rock units can be of much importance in the quest for mineral substances (Figure 11). The region under study is part of the tectonic-magma zone of Orumiyeh-Dokhtar. Thus, the expansion of volcano-plutonic units in this region is at a high level and in this region the potentiality of mineralization of epithermal gold type and skarn mineralization and the mineralization possibility of porphyry type copper exists [5] .
The volcanic and pyroclastic units are much expanded in the region and in this region with the infiltration of granitoid lumps (granodiorite, granite and quartz diorite), the required conditions for mineralization as indicated above exists because it is a combination of calc alkaline and alkaline type from the view point of the nature of magma and volcanism of the region and there exists the potentiality of mineralization of porphyry copper. Since the Intruding igneous units is among the type of rocky units that are clearly seen in the satellite images regarding the nature and that the color reflective nature resulting from electromagnetic waves and also their relationship with mineralization has been proved thus for this purpose the various igneous structures in the area under study have been segregated and plotted as a thematic map. Image 12 is used as a data layer in digital form together with other data for modeling in GIS environment. According to combination of different data channels, and with due regard to the identification parameters of the intruding and semi-deep lumps they are verified in respect of expansion, combination and form.
The intruding structures cover the major part of the central areas of Bidkhan, Panjmountain and Chehargonbad. These structures comply also with regards to general tectonics of the region (north-north western, south-south eastern) (Figure 12). Related to intruding lumps of 1, 3 and 5 bands combination in RGB
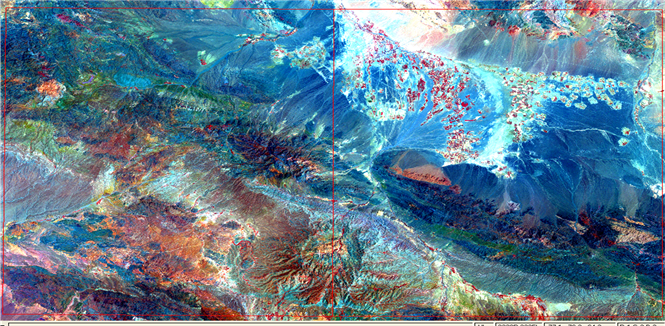
Figure 11. Segregation of igneous units with 1:100,000 sheets satellite image processing of Bardsir at the right side and Chehargonbad at the left side of the image.

Figure 12. Segregation of rocky units which probably played a significant role in mineralization of the region 1:100,000 sheets of Bardsir at the right side and Chehargonbad at the left side of the image.
environment. The intruders of the region are shown with vector layer in green color. In the north western, south and east parts the Chehargonbad sheet and in the south the Bardsir sheet in the western area of Sang-e-Sayyad village the granite has penetrated into the lavas. The evolvement period of these intruding lumps belongs to about the post Eocene era. In a band combination (1, 3, 5) the gabbro unit has a light brown to purplish color. Meanwhile, the penetration of quartz diorite lumps in the volcanic rocks play a fundamental role in the possible mineralization of the area under study. The rocks of this sort from the Miocene period are present in the four corners of Bardsir which are of igneous rock lumps and have penetrated into the Eocene units. Their combination is generally quartz diorite with a light grey reflection [6] .
6.3. Specifying, Identification and Segregation of Regions and Alteration Areas in the Region
The altered locations can have close relationship with mineralization regions particularly hydrothermal and porphyry mineralization and these areas are helpful guides for searching for mineral substances within the scale of the area. Alteration is a complex process which due to electromagnetic wave attributes is divisible in the satellite images. It should be noted that, during heat alteration a large amount of minerals can be created the most important of these to motion are the embedded minerals (OH). These minerals are formed in a vast spectrum of alteration hydrothermal (argillic and phyllic). Thus, the verification and segregation of these areas with the capability of satellite data is possible. Also, the oxides and iron-hydroxides, silicated and carbonated regions can be distinguished since these types of changes can be identified in view of the electromagnetic waves spectrum characteristics of the satellite data and by use of special processing in a short time process. These separated alteration locations are very important in mineral searching and explorations and are presented as useful data layer which is effective for application in GIS environment. For example, in Table 2, the applied band (No 3) and the related attributes for identification and use of satellite data in alteration regions is presented:
In this study, the iron and clay alterations are separated. Due to the iron spectrum curve (spectral signature) this substance has the highest reflection in 3rd band and the lowest in 1st band. As a result the ration of band 3 to 1 (R (3/1)) of alteration of iron is clearly exposed. Also, the second principal component due
Table 2. Applied bands for identification of alteration.
to principal component analysis of bands 1 and 3 (PC2 (1,3)) also exposes the regions with highest differences in band 3 to 1. This method is called selective principal component. Feature oriented principal component method is among other methods used for enhancement of iron alteration in the image which is attained from the fourth principal component resulting from conversion of principal component of 1, 3, 4 and 5 bands; Image + ETM used for reconstruction of iron-oxide is shown in the image. Identifying the hydrothermal metamorphic (alterations) areas is one of the most important signs of identifying the mineral reservoirs especially the deposits of type porphyry and epithermal. Alteration is a vast subject of discussion that is to say there are about 20 types of alteration which can be correctly identified through field inspections and lab analysis. In this section, the altered areas with due attention to remote sensing interpretations of satellite image from Bidkhan region is introduced. In Figure 13, an overview of the alterations of the region is displayed. With a closer look at the image, the pink area seen is largely alterations related to fissures running north west-south east and in a lesser extents along north-south. The major part of alterations is related to fissures that cross the already introduced volcanic units. In Figure 14, and in fact many of these alterations have occurred in the polygene volcanic units and have no connection with intruding lumps (quartz diorite and granite) and are the thermal soluble resulting from this magmatism. It is noteworthy that the iron-oxide alteration (limonite, goethite and hematite) and the argillic alteration in this region more or less correspond with one another.
7. Interpretation and Processing of Aster Images
7.1. Extrusion of Iron-Oxide Alterations (Goethite and Limonite)
The initial data from the Aster surveyor in the geological exploration is related to the verification of iron-oxide alterations. Such type of alteration is a normal

Figure 13. An overview of alterations in the region image scale 1:400,000 with Bidkhan at the right side and Panjmountain at the left.
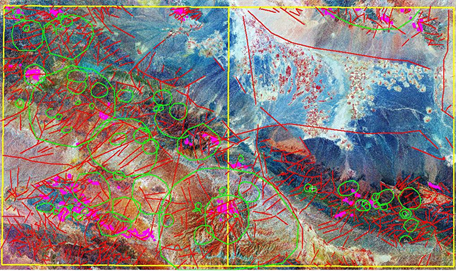
Figure 14. Alteration created along the fissures and ring structures (fault) of the area image scale 1:400,000 with Bardsir at the right side and Chehargonbad at the left.
condition existing in most of rocky units however, if located alongside other alterations then this can be an evidence of mineralization. Aster images show clearly the regions containing iron-oxide alteration and units influenced by such alteration or alteration, in order to extract such data from band 3, firstly, the Aster images, i.e. Visible Near Infrared (VNIR) or bands located at the wavelengths in the visible region with 15 m spatial resolution are used. By applying the combination of 1, 2 and 3 bands in the RGB environment, the iron-oxide alteration can be identified on the Aster satellite images. The band combination at these regions is in yellow to white reflection. In the ASTER image in Figure 15, the area under study with 1, 2 and 3 band combination is shown. The units shown in yellow to whitish color are rocky units undergoing iron-oxide alteration. In the band combination in the images, the green lands are shown in red [7] .
In Figure 16, after restructuring of the region in question, the alternated parts of iron-oxide is segregated from other parts and samples of it at the Panj Mountain region located north-west of the region (one-hundredth sheet of Chehargonbad at the west of the geological map) can be observed. The white to yellow parts are iron-oxide alterations which are segregated by a vector layer in green color. This reconstruction is applied to the whole region and the iron-oxide alteration distribution in the region is obtained with a sample shown in the figure below.
In this image, the yellow parts are regions with iron-oxide alteration. Since the presence of iron-oxide alteration (hematite-slit and/or jarosites) at argillic alteration zones with leached cap zone is of much significance and sometime some traces of important mineralization substances such as gold and copper are seen in the ribs, thus identification of the alteration regions alongside other mineralization evidences can be of importance. In the region under study, such alterations are important when they exist alongside other alterations.

Figure 15. Aster satellite image and alterations due to their processing (1:400,000 sheets of Bardsir at the right side and Chehargonbad at the left side of the image).

Figure 16. Iron-oxide alteration at Panjmountain.
7.2. Extrusion of Alterations (Kaolinite and Sericite)
Among the most important alterations is the exploration of kaoline alteration and in other word the argillic alterations. In the Aster images it is possible that the sericite rocky units and kaoline to be identified separately. The importance of such geological alterations is a new topic for discussion. In summary however it should be said that the identification of sericite, illite and/or kaoline which are considered among argillaceous (clayish) minerals the opportunity for identification of advanced argillic alteration and/or phyllic would exist. In the 4, 6 and 8 combination of Aster images, the alteration phyllic and sericite and kaoline zones are shown in pink and marbles are white to yellow whilst the propylitic regions are green colored and with the increase in epidote and inversely with lesser chloriting the almond green color becomes lighter. Around much of the deposits such as the porphyry copper deposits and epithermal gold (gold) deposits, rib deposits (lead and zinc) such alterations zones are seen. Evidently, the location of such alterations is very important. Existence of such alterations in volcanic rocks and/or Intruding lumps is of great significance. In the region studied, investigation of the major section of the region is formed from Eocene units. In spite of all the explanations given so far, in this image an attempt has also been made to identify the smallest traces of alteration and to introduce such parts as the promising locations. It is probable that around this alteration in the deposition units, lead and zinc mineralization has occurred. A suitable band combination for the extraction of such possible alterations is indicated as Aster images with 5, 4, and 6 ban combinations in the Aster images. Often, the alterations in the investigated area are of illite, sericite and rarely kaoline types introduced in volcanic units in the form of gd, Etv, Etr units in the 1:1000 geological map of Chehargonbad.
7.3. Extraction of Chlorite, Epydotic and Propylitic Alterations
Alterations propylitic are among the other capabilities of the surveyed Aster images (i.e. the verification of chlorite and epidote minerals). In a metamorphic (alteration) region the propylitic zone is the most exterior zone in the area and serves as a useful guide for reaching the interior zones where there may exist more mineralization. This zone has reduced heat temperature of hydrothermal reactions where in the last stages, metamorphosis or alteration occurs. In the region under study, in spite of the abundance of sedimentary facies, the extent of chlorite and epitectonic is relatively high and due to the crop out of intruding or volcanic units with more internal alteration zones (argillic) and being mineralizers, they can be of more importance in the volcanic Eocene. Thus it has been tried to give more attention to propylitic zones in these units in the area. In Figure 17, the surveyed ASTER satellite image with 8, 6 and 4 band combination is seen which a suitable combination for segregation of propylitic alterations.
The most important propylitic zones are located at the south of one-hundredth sheet of Chehargonbad and the northern section of the one-hundredth sheet of Bardsir. Often, the propylitic sections in the altrophic units and other parts which are especially evident in the Chehargonbad sheet they are located in the volcanic units of Eocene. Propylitic sections in Figure 18 are shown in green polygon shapes and thus their geological disposition can be distinguished. It should be noted that the propylitic alterations in 8, 6 and 4 band combination in the surveyed Aster images is shown in light to dark green being highlighted in the zoomed image for clearer view [8] .

Figure 17. Expansion of propylitic alteration (1:100,000 sheets at Bardsir in the right side and Chehargonbad in the left side of the image-scale of image 1:400,000).

Figure 18. Propylitic alteration areas shown in green (1:100,000 sheets at Bardsir in the right side and Chehargonbad in the left side of the image).
7.4. Extraction of Silicate Alterations
The spatial resolution of thermal bands in Aster images is 90 m and it is clear that by this means the vast silicate areas can be segregated.
Among the other keys of discovery there are the silicate alterations and of particular importance is their presence in argillic and advanced argillic zones. In the Aster images the matter discussed has been the infrared images with visible and short wavelengths. The Aster images contain 5 thermal bands too which are handy for segregation of alterations silicate in wider scales. In this project, the combination of 10, 12 and 14 thermal band for the extraction of silicate alterations in the surveyed Aster images has been used. In Figure 19, the overview image of the silicate areas of the region under study is seen. The major part of

Figure 19. Silicated alteration expansion in the area studied (1:100,000 sheets at Bardsir in the right side and Chehargonbad in the left side of the image).
the silicate alteration can be observed to be in the sedimentary lime Eocene units too. This image is acquired by 10, 12 and 14 band combination in RGB environment [9] .
8. Conclusions and Introduction of Locations with Potentiality for Mineralization
The reviewing and comparison of the results obtained from the ETM and ASTER images with geological maps and drawings and with mineral indices and the introduction of promising mineral locations in these regions were performed by the modulation of the following data:
1) Knowledge about the penetrative and volcanic lumps from the view point of form, terrain expansion, structure and combination.
2) Knowledge about the tectonic structure and their relationship with promising mineral locations.
3) Identification of alteration areas.
By relaying on remote sensing studies, such promising mineral regions are introduced as follow:
In the north of Chehargonbad village, two promising areas are seen. The crop outs of such intruding lumps are quartz diorite which has penetrated in different volcanic rocks and Eocene pyroclastics by different trends. The fine-grained quartz diorite units of Miocene at the east and north-west and south and centre of Chehargonbad sheet have north western-south eastern trend. The overlapping of this unit with volcanic andesite has crossed the Eocene and other intruding lumps whilst the fissures have brought about the dislocation of the unit. The kaoline, illite and sericite alteration of this unit are suitable for porphyry type deposits.

Figure 20. Final map of the area under study with results obtained from remote sensing investigations which are shown in the form of different layers.
Among the important mineralization regions where ribs of hydrothermal soluble have transfused into rocky units, the copper mineral areas in Chehargonbad can be mentioned, which are being exploited as rich mine-ribs. There are also, other important mineralization locations such as Takht-e-Baneh, Bolboli, Panther river, Panj mountain, Ahoorak mountain, and northern suburb of Bidkhan. Finally, considering the results obtained from the remote sensing studies and other geological data, regions that from the viewpoint of remote sensing show that traces of different alteration can be considered as important mineralization areas. The promising areas and the results obtained are extracted in the form of a vector data layer and are used alongside other mineral data for searching for and exploration of minerals [10] [11] [12] . At the final stage, all the extruded data are displayed in a final image-map (Figure 20).
Cite this paper
Ashofteh, A. (2017) The Introduction of Promising Mineral Zones Bidkhan Area Using Satellite Imagery. Open Journal of Geology, 7, 1404-1424. https://doi.org/10.4236/ojg.2017.79093
References
- 1. Ashofteh, A. and Adib, A. (2014) Primitive Studies for Copper Deposit in Bidkhan Copper Mine with Regards to Wide Survey of Altered Areas and Mineral Indexes. Journal of Middle East Applied Science and Technology, 4, 86-90.
- 2. Rasanena, A., Kuitunena, M., Tomppob, E. and Lensua, A. (2014) Coupling High-Resolution Satellite Imagery with Als-Based Canopy Height Model and Digital Elevation Model in Object-Based Boreal Forest Habitat Type Classification. Journal of Photogrammetry and Remote Sensing, 94, 169-182.
- 3. Emel, J., Plisinski, J. and Rogan, J. (2014) Monitoring Geomorphic and Hydrologic Change at Mine Sites using Satellite Imagery.
- 4. Glacier, T., Sirgueyb, P., Fitzsimonsa, S.J. and Kaabc, A. (2013) Accuracy Assessment for Mapping Glacier Flow Velocity and Detecting Flow Dynamics from Aster Satellite Imagery. Remote Sensing of Environment, 133, 90-101.
- 5. Zoheira, B. and Emamb, A. (2013) Field and ASTER Imagery Data for the Setting of Gold Mineralization in Western Allaqi-Heianibelt, Egypt: A Case Study from the Haimur Deposit. Journal of African Earth Sciences, 99, 150-164.
- 6. Oh, H.-J., Kim, Y.-S., Choi, J.-K., Park, E. and Lee, S. (2011) GIS Mapping of Regional Probabilistic Groundwater Potential in the Area of Pohang City, Korea. Journal of Hydrology, 399, 158-172.
- 7. Droogers, P., Immerzeel, W. and Perry, C. (2009) Application of Remote Sensing in National Water Plans: Demonstration Cases for Egypt, Saudi-Arabia and Tunisia.
- 8. Ashofteh, A. and Adib, A. (2015) An Investigation into the Metal Potentials across Bidkhan Area Based on Economic Geological Studies. Open Journal of Geology, 5, 727-742.
- 9. Adib, A. and Ashofteh, A. (2015) Studying Petrology and Determining Tectonic Setting of Bidkhan Rocks Area Southeast of Iran. Open Journal of Geology, 5, 677-688.
- 10. Robinson, C.A., El-Baz, F., Al-Saud, T.S.M. and Jeon, S.B. (2006) Use of Radar Data to Delineate Palaeodrainage Leading to the Kufra Oasis in the Eastern Sahara. Journal of African Earth Sciences, 44, 229-240.
- 11. Omran, A.A. (2008) Integration of Remote Sensing, Geophysics and GIS to Evaluate Groundwater Potentiality—A Case Study in Sohag Region, Egypt. The 3rd International Conference on Water Resources and Arid Environments and the 1st Arab Water Forum.
- 12. Sardar, M., Shahzad, T., Muhammad, A. and Zafar, M.I. (2008) Poverty in Riverine Areas: Vulnerabilities, Social Gaps and Flood Damages. Pakistan Journal of Life and Social Science, 6, 25-31.