Optics and Photonics Journal
Vol.3 No.1(2013), Article ID:28940,4 pages DOI:10.4236/opj.2013.31010
LED Flicker: A Drawback or an Opportunity?
Université de Toulouse, Toulouse, France
Email: skitsinelis@ath.forthnet.gr, kitsinelis@laplace.univ-tlse.fr
Received November 28, 2012; revised December 30, 2012; accepted January 6, 2013
Keywords: Flicker; Pulse; LED
ABSTRACT
In this paper we examine the flicker of commercial LED lamps and with the help of volunteers we explore the parameter space (frequency and duty cycle) in order to find pulsing operating conditions under which the light fluctuations are not visually perceived. The results show that LEDs under mains voltage manifest the most extreme cases of flicker and we also confirm that under pulsing mode the overall impression is of higher brightness which is an opportunity for energy savings. The results also show that the background color and luminance contrast is of high importance. Finally we propose an easy method for consumers to detect flickering of light sources under mains voltage.
1. Introduction
It is known that exposure to light flicker (in particular at frequencies between 3 Hz and 55 Hz) can cause photosensitive epileptic seizures in various forms depending on the individual and his visual pathology, the contrast, the wavelength and the viewing angle or distance [1].
On the other hand it has been demonstrated that the pulsing of lamps offers opportunities for energy savings according to the Broca-Sulzer effect [2,3]. We therefore decided to conduct an experiment with volunteers and explore the parameter space (frequency and duty cycle) in order to find a region of operating modes where pulsing would not be at least visually perceived.
2. The Visual Perception of Flicker
The exercise was undertaken using two different backgrounds, black and then white.
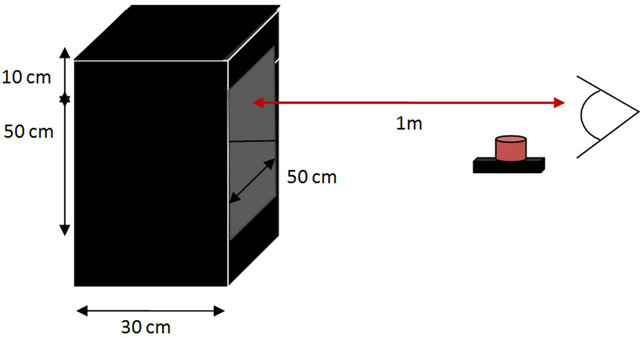
Figure 1. The experimental set up for the visual perception tests. The LED used has the following specifications: 18 V - 540 lumens-warm white light of 3000 K.
A black box, as shown in Figure 1, was placed in a dark room and it was lit by an LED source with its light output diffused using a frosted glass plate and never seen directly by the observer. The warm white LED generates an indirect light with an average illuminance of 167 lux on the background surface observed (that creates a direct angle of vision with the macula). During the experiment the frequency was varied between 50 to 70 Hz and the duty cycles from 20% to 90%. The same experiment was performed using two different backgrounds, black and then white.
The observers enter the room and sit at a distance of 1m from the edge of the light box. They couldn’t directly perceive the light source or the diffuser. We ask the observers not to turn their head and to look directly at the background of the box in front of their visual axis as we want to study the sensitivity of the central and not the peripheral vision.
We then performed 40 lighting scenarios of 5 second duration each. After each one of them we asked the observers to state whether they perceived or felt a light fluctuation. If they did perceive a flicker or that light wasn’t stable they pushed a button otherwise they did nothing.
The numbers of positive answers for perception of flicker are shown in Figures 2 and 3 and then compared on Figure 4. For lower duty cycles and lower frequencies the flickering of the LED was more easily detected. The regions where the volunteers did not detect the flickering are shown giving us some energy saving opportunities.
As for the different backgrounds, we see that with a
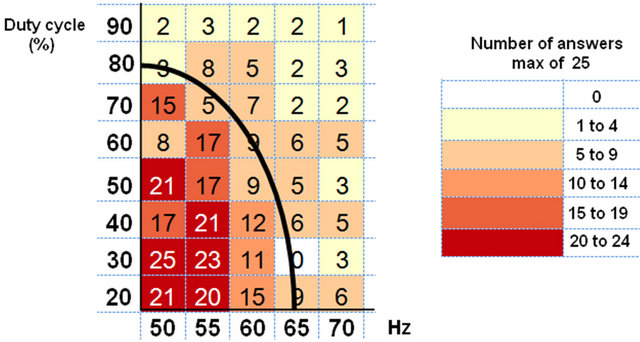
Figure 2. Flicker perception tests with black background.
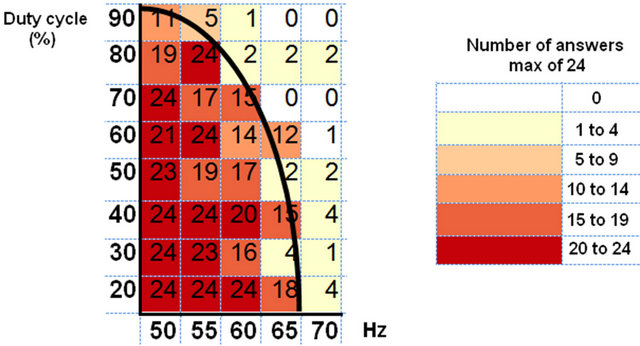
Figure 3. Flicker perception test with white background.
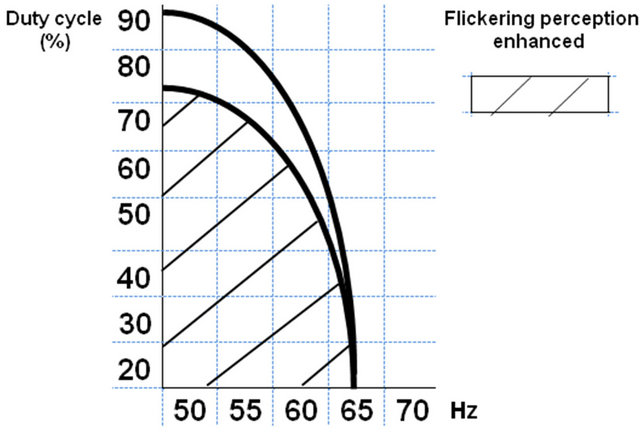
Figure 4. Graphic of comparison.
white background the volunteers detected flicker for a larger range of frequencies. The fluctuations are more easily perceived with a white background due to increased luminance contrasts. Because of that we noted that the visual fatigue of the participants is also higher with the white background than with the black background.
3. The Commercial Lamp Flicker
We have also tested a number of commercial lamps in order to see how they behave under the mains frequency, which is 50 Hz (in Europe) causing a flicker at 100 Hz in the lamp’s output. Figure 5 shows schematically the used experimental set-up.
All lamps were operated at 230 Volts (mains) and the set up for the flicker measurements included:
• An integrating sphere equipped with a selenium cell;
• A Tektronix 2002B oscilloscope for detecting and recording the light waveforms fed from the selenium cell to the oscilloscopes channel via a BNS cable;
• A multimeter for measuring independently the average light output in millivolts as well as the voltage applied to the lamps;
• A varying voltage power supply connected to a multimeter for controlling the voltage value.
The DC coupled oscilloscope could measure the RMS as well as the maximum and minimum values of the fluctuation waves.
There are two widely accepted methods for defining lamp flicker. One, called the percentage flicker, takes the maximum and minimum points of the fluctuation and performs the calculation

The second method measures the flicker index and it requires the calculation of the areas above and below the RMS line of the signal. We are using the first method of percentage flicker which for periodic waveforms should be in linear relationship to the index [4].
4. Flicker Measurements
Figure 6 shows the list of lamps tested and the measured values of percentage flicker in each case (or as stated the lack of flicker).
While CFL and halogen lamps all exhibit flicker as expected, the tests show that LED lamps show different behaviors ranging from no flicker at all to the largest flicker percentages.
We therefore wanted to know how the volunteers perceive the most extreme LED flicker cases that we found in our tests (100 Hz, more than 90% flicker). So we run two lamps side by side. One of them was operated under a DC mode with no fluctuations and the other was programmed to run with pulses at 100 Hz and duty cycle of 50% thus giving us a 100% flicker. Both black and white background were used again. The average power was kept at 2 W.
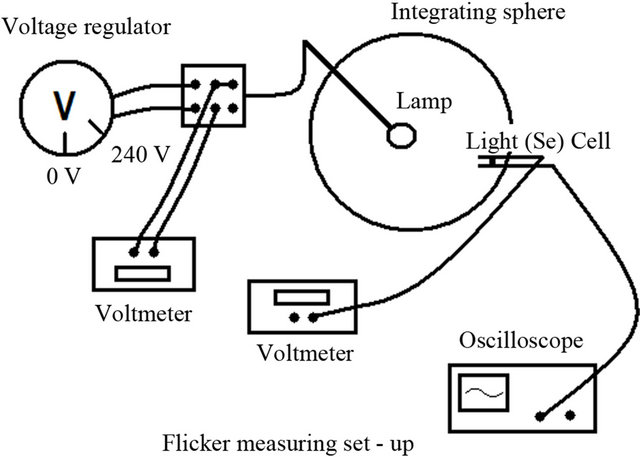
Figure 5. Diagram of the flicker measuring set up.
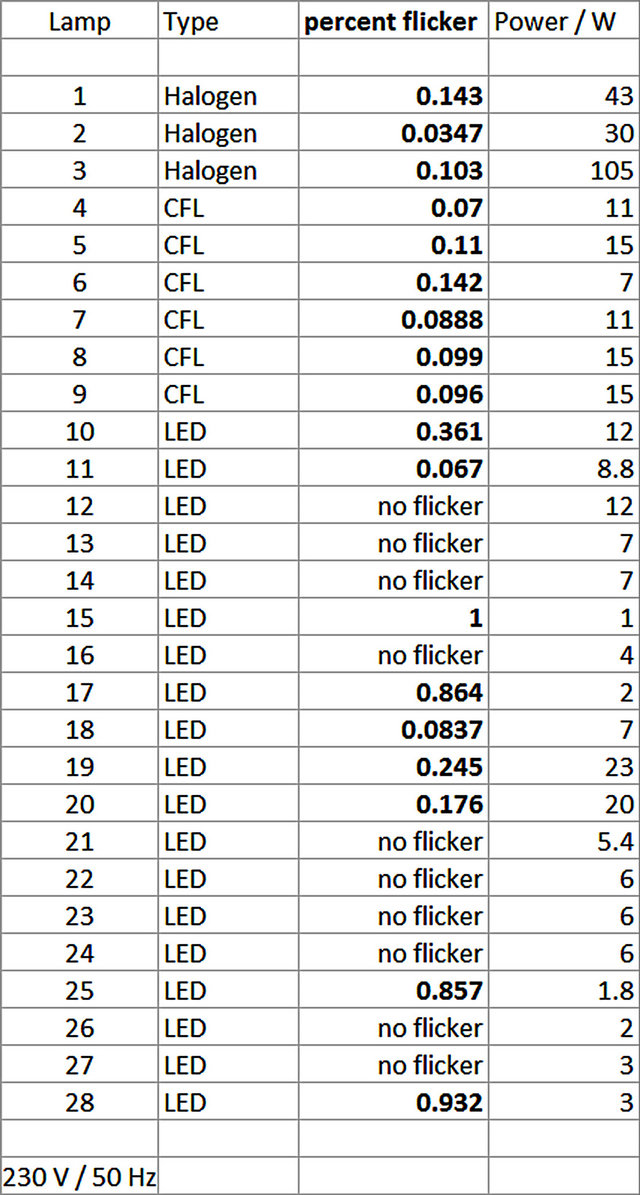
Figure 6. List of all the commercial lamps tested.
The results were the following:
1) With both black and white background 16 out of 16 volunteers noted that the pulsed LED was brighter (Broca-Sulzer effect).
2) 15 out of 16 volunteers did not perceive a light fluctuation. That is 8 out of 8 did not perceive a fluctuation with the white background and 7 out of 8 volunteers did not perceive a light fluctuation with the black background (the one that perceived it was correct in identifying the pulsed lamp).
3) When both lamps were set to pulse (100 Hz, 50% duty cycle) with different backgrounds then all our volunteers agreed that the white background gives a higher brightness impression and 2 noted a fluctuation with the black background.
There are two important points here. The first one is that the pulsed operation of LED lamps can indeed give us energy savings if people perceive them as brighter for the same power input. The second point here is that although in our visual perception experiment the white background made it easier for flicker to be detected, in the 100 Hz test this was no longer relevant and in fact the mobile phone camera and three volunteers detected it with the black background.
5. Discussion
Our tests showed that although the LED lamps are operated under a DC mode, they exhibit the most extreme cases of flicker as some show no fluctuations at all and others show the highest fluctuations with flicker percentages exceeding 90%.
The flicker in such cases is at 100 Hz and tests show that it is not visually perceptible especially with a white background. In fact at such frequencies one can have energy savings as the human eye response to pulses gives the impression of higher brightness for the same power input.
Of course the studies must be extended to take into account the health effects of such LED commercial lamps that flicker at 100 Hz on people with photosensitivity such as photosensitive epilepsy or migraine sufferers. According to the studies with electroretinograms (ERG), flicker is transmitted through the retina up to a frequency of 200 Hz [5]. In this study we did not examine this topic but we wanted to see whether the flicker offers opportunities for energy savings and whether people can visually perceive it at such high flicker percentages.
During the tests we also discovered that the best way for a consumer to test whether a LED lamp flickers or not is to look at the operating lamp through a digital camera display (such as the mobile phone camera display). The displays usually refresh at 30 frames per second which is slower than the 100 Hz modulation of mains voltage. So the flicker that is not visible with naked eye becomes visible on the display. Large fluctuations (i.e. large flicker percentages) are clearly recorded as striped images on the display.
Figure 7 shows some more of the lamps tested and whether the lamps flicker or not is evident by the photographs. The photos without stripes were indeed those of the LED lamps that had no flicker. Of course the distortion is very visible with the larger flicker percentages but careful examination will reveal flickering of any degree.
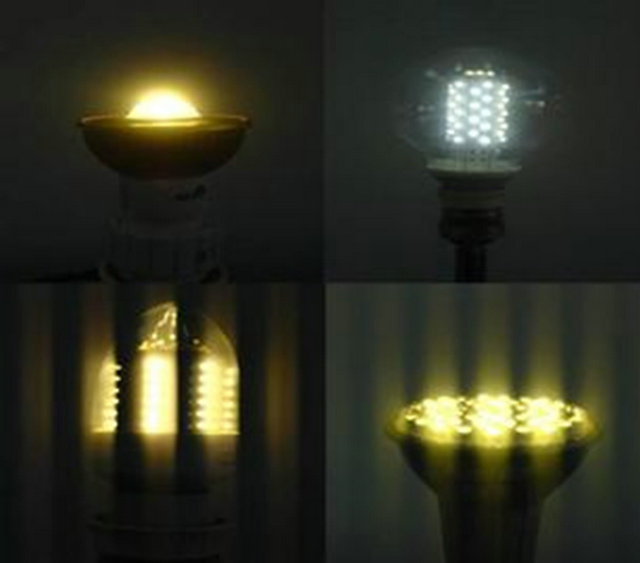
Figure 7. Some of the LED lamps tested. The top lamps showed no flickering and this is also evident by the stripefree photographs.
This easy and quick flicker test with such a widely available tool as a mobile phone camera may prove useful to consumers seeking to avoid the undesirable effects of flicker even at such non visible frequencies. It would also be useful as a quick screening method even to the researcher interested in taking further measurements of flickering lamps. Perhaps a method for calculating the color contrasts on the recorded images could give this diagnostic method quantitative besides qualitative powers.
REFERENCES
- http://en.wikipedia.org/wiki/Photosensitive_epilepsy
- W. M. Hart Jr., “The Temporal Responsiveness of Vision,” In: R. A. Moses and W. M. Hart, Eds., Adler’s Physiology of the Eye, Clinical Application, The C. V. Mosby Company, St. Louis, 1987.
- M. Jinno, K. Morita, Y. Tomita, Y. Toda and H. Motomura, “Beyond the Physical Limit: Energy Saving Lighting and Illumination by Using Repetitive Intense and Fast Pulsed Light Sources and the Effect on Human Eyes,” Journal of Light and Visual Environment, Vol. 32, No. 2, 2008, pp. 170-176. doi:10.2150/jlve.32.170
- S. Kitsinelis, L. Arexis and G. Zissis, “A Study on the Flicker of Commercial Lamps,” Light and Engineering— Svetotechnika, Vol. 20, 2012, pp. 58-64,
- S. M. Berman, D. S. Greenhouse, I. L. Bailey, R. Clear and T. W Raasch, “Human Electroretinogram Responses to Video Displays, Fluorescent Lighting and Other High Frequency Sources,” Optometry and Vision Science, Vol. 68, No. 8, 1990, pp. 645-662. doi:10.1097/00006324-199108000-00012