International Journal of Organic Chemistry
Vol.3 No.1(2013), Article ID:29160,17 pages
DOI:10.4236/ijoc.2013.31010
Development of a Novel Reusable Real Time Monitoring Glucose Sensor Based on Nanostructured Conducting Polyaniline (NSPANI)
1Amity Institute of Nanotechnology, Amity University, Noida, India
2Amity Institute of Biotechnology, Amity University, Noida, India
Email: ruchikachauhan@hotmail.com, basu@amity.edu, *basu002@yahoo.com
Received January 20, 2013; revised March 11, 2013; accepted March 25, 2013
Keywords: Glucose Biosensor; Nanostructured Polyaniline; Reusability; Real Time Monitoring and Electrodeposition
ABSTRACT
A novel mediatorless reusable glucose biosensor with a remarkable shelf life has been fabricated on electrodeposited film of chemically synthesized nanostructured polyaniline (NSPANI) on indium tin oxide (ITO) coated glass plates using cyclic voltammetry. Glucose oxidase has been covalently immobilized on electrodeposited NSPANI film to fabricate a glucose bioelectrode (GOx/NSPANI-SDS/ITO). The results of linear sweep voltammetry and the high value of heterogeneous rate constant as obtained using Laviron equation indicates that GOx/NSPANI-SDS/ITO bioelectrode can detect glucose in the range of 0.5 to 10.00 mM with high sensitivity of 13.9 μA∙mM−1 with a fast response time of 12 seconds. The linear regression analysis of bioelectrode reveals standard deviation and correlation coefficient of 6 μA and 0.994, respectively. The low value of Michaelis-Menten constant (Km) estimated as 0.28 mM using LineweaverBurke plot indicates high affinity of glucose oxidase enzyme to glucose and transfer rate. The GOx/NSPANI-SDS/ITO bioelectrode exhibits uniform activity for 12 weeks under refrigerated conditions; however the study is further going on. Attempts have been made to utilize this electrode for estimation of glucose in blood serum and results are found to be within 11% error. The unique features of this novel electrode lie on its reusability, real time monitoring, reproducibility and remarkable shelf life apart from the wide linear range, high sensitivity, low Km value, high heterogeneous electrontransfer constant etc.
1. Introduction
Glucose is a keen metabolite for living organisms, especially in the case of patients suffering from diabetes. Amperometric glucose biosensor is the most popular method for glucose detection, because of its advantages, such as simplicity, accuracy and fast response. But there still exits some problems, such as narrow linear range, low sensitivity, poor shelf life, high Km value indicating weak assembly between enzyme and substrate which can’t satisfy the detection requirement with high precision. In order to improve the performance of the glucose biosensor, significant research and development efforts have been devoted to this field by many methods, such as the addition of redox mediators [1-5], conducting polymer nanoparticles [6-11], etc. Among the various methods, the most attracting one at present is to enhance the electron transfer and improve the electrocatalytic property of the biosensor using conducting polymer which has nano-scaled dimension, high conductibility and catalytic properties [12]. In recent years, nanostructured PANI (nanotubes/nanorods/nanospheres) has aroused much scientific interest since it combines the properties of low-dimensional organic conductors and high surface area materials and offers the possibility of enhanced performance wherever a large interfacial area between PANI and its environment is required. For example, in sensor applications, nanostructured PANI has been found to result in increased sensitivity and faster response time relative to its conventional bulk counterpart [13]. The observed high sensitivity is attributed to extremely sensitive modulation of the electrical conductance/ resistance of nanostructure brought about by changes in the electrostatic charges from surface adsorption of various molecules, leading to depletion or accumulation of the carriers in the “bulk” of the nanometre diameter structure [14].
Morrin et al. have reported an amperometric enzyme biosensor fabricated from polyaniline nanoparticles [15]. The signal-to-background ratio of this NSPANI-DBSA biosensor (61 +/− 3) is approximately three times higher than the bulk PANI/PVS biosensor (17 +/− 14). The response time for the optimized NSPANI-DBSA biosensor (0.62 +/− 0.04 s) was at least one order of magnitude faster than that of the PANI/PVS biosensor (9.46 +/− 4.12 s). Aldilssi et al. have reported the synthesis of NSPANI using various types of surfactants and found potential matrix for glucose sensing applications [16]. Dhand et al. have used polyaniline nanospheres (PANINS), polymerized by camphorsulfonic acid (CSA) and ethylene glycol for free cholesterol determination and observed very low response time (10 s) and high shelf life (12 weeks) [17].
NSPANI, with different morphologies, have been synthesized using various techniques such as template synthesis, self-assembly, emulsions and interfacial polymerization [18-20], seeding polymerization [21] rapidly mixed reaction [22] and surfactant-directing methods [23,24]. One of the most elegant and facile way of synthesizing NSPANI is the use of structure directing agent (SDA) which can act as a soft template. The SDA controls the polymerization in a restricted zone so that the crystal growth can take place in a definite manner. It has been observed that the nature and composition of SDA regulate the morphology, nano dimension, switching properties and conductivity etc. [25]. The fabrication of nano structure using SDA into conducting polymers can improve their biocompatibility and conformation and provide porous surface morphology at the nano scale to improve enzyme immobilization for enzyme based biosensor applications [26,27].
The glucose biosensors based on conducting polymers so far developed have major limitations such as poor shelf life, reproducibility and low linear range and they are of disposable type. To the best of our knowledge no report has been made on reusable glucose biosensor based on conducing polymers. In the present investigation, an attempt has been made to develop a reusable glucose biosensor with remarkable shelf life and high reproduciblity based on electrodeposited NSPANI-SDS/ ITO electrode. A series of nanostructured conducting polyaniline have been synthesized by varying the concentration of oxidant, structure directing agent and monomer to optimize the formulation with respect to the conductivity and dimension. Out of these series of NSPANI dispersion, it has been found that only one particular polyaniline can be electrodeposited to produce a uniform nanofilm on ITO surface. The film is used to fabricate glucose nanobioelectrode to determine glucose concentration. The NSPANI-SDS/ITO electrode is fabricated from NSPANI-SDS dispersion, synthesized chemically using sodium docyl sulphate as SDA and ammonium persulphate as an oxidant. The nanobioelectrodes are also tested for the detection of glucose concentration in actual blood serum using amperometric as well as photometric method, and both the results are compared.
2. Materials and Experimental
Aniline, Glucose oxidase (GOD, E.C. 1.1.3.4, 151 U/mg, from Aspergillus niger) and Horseradish peroxidase (HRP, E.C1.11.1.7, ≥250 U/mg, from Horseradish) were purchased from Sigma, USA. Ammonium per sulphate (APS) were purchased from Merck (India), sodium dodecylsulphate (SDS) from Sisco research laboratory (SRL, India). Potassium ferricyanide (K3[Fe(CN)6]), potassium ferrocyanide (K4[Fe(CN)6]), sodium dihydrogen orthophosphate (NaH2PO4) and disodium hydrogen orthophosphate (Na2HPO4) were purchased from Qualigens (India). Sodium chloride was purchased from Himedia, India. Aniline was doubled distilled prior to polymerization. All other chemicals were of analytical grade and used as received. Deionized water (resistance ~18.2 MΩ) from the millipore water purification system was used for the preparation of desired aqueous solutions.
2.1. Instrumentation
Surface morphologies of NSPANI-SDS/ITO electrode and GOx/NSPANI-SDS/ITO bioelectrode have been investigated by scanning electron microscope (LEO 440 Model). Photometric studies have been carried out using UV-visible spectrophotometer (Shimadzu, Model 1800 A). Dynamic light scattering (DLS) measurements were performed using a Malvern 4800 Autosizer employing a 7132 digital correlator. Electrochemical impedance spectroscopy (EIS), cyclic voltammetry (CV) and LSV measurements have been conducted in phosphate buffer (50 mM, 0.9% NaCl) containing 5 mM [Fe(CN)6]3−/4− in a three-electrodes cell consisting of Ag/AgCl as reference, platinum (Pt) as counter electrode and ITO as a working electrode (0.25 cm2) using Autolab Potentiostat/ Glavanostat Model 273 A.
2.2. Synthesis of Nanostructured Polyaniline (NSPANI-SDS)
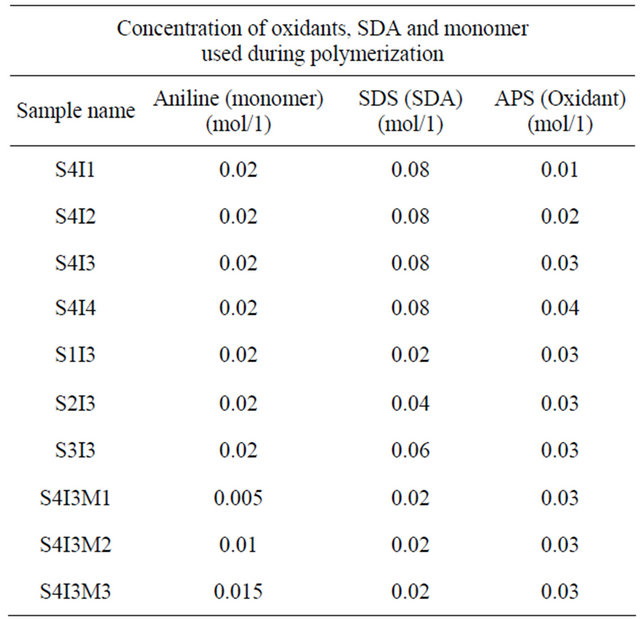
A series of NSPANI-SDS dispersion was prepared using sodium dodecylsulphate (SDS) as structure directing agent, ammonium per sulphate (APS) as oxidant and aniline at low temperature (2˚C - 3˚C) with continuous stirring by varying the concentration of oxidant, SDS and monomer. The various formulations used for polymerization are shown in Table 1. In each set of formulation, 0.02 mol/lHCl was used. Aniline was dispersed in SDS containing hydrochloric acid (HCl), APS was added with continuous stirring under the blanket of nitrogen gas and the reaction was continued for 3 hours with continuous stirring. After that the mixture was allowed to stay under static condition for 2 days for complete polymerisation.
Table 1. Formulations used for the synthesis of NSPANISDS.
2.3. Preparation of NSPANI-SDS/ITO Electrode
The electrodeposition of NSPANI-SDS dispersion on the indium tin oxide plates (ITO) was carried out electrochemically using cyclic voltammetric technique. The potential was swept from −0.4 to +1.0 V at scan rate of 80 mV/s for the required number of cycle to fabricate NSPANI-SDS/ITO electrode.
2.4. Preparation of Solutions
Solution of glucose oxidase was prepared by adding GOx (1 mg) to 1 ml of phosphate buffer solution (50 mM, pH 7). 1% glutaraldehyde solution was prepared in deionized water. Stock solution of glucose was prepared in deionized, water was stored at 4˚C. This stock solution was further diluted to make different concentrations of glucose solution. Buffers of various pH values were prepared by dissolving different ratios of sodium dihydrogen orthophosphate (NaH2PO4) and disodium hydrogen orthophosphate (Na2HPO4) in millipore water.
2.5. Immobilization of Enzyme on NSPANI-SDS/ITO Electrode
NSPani-SDS/ITO electrode is treated with 10 µl of aqueous glutaraldehyde (0.1%) as a cross-linker. 10 µl freshly prepared GOx (1 mg/ml) (1:1) is uniformly spread onto glutaraldehyde treated NSPani-SDS/ITO electrode and is kept in a humid chamber for 12 h at 4˚C. The NSPani-SDS/ITO bioelectrode is immersed in 5 mM phosphate buffer solution (pH 7.0) in order to wash out unbound enzyme from the electrode surface. When not in use, the electrode is stored at 4˚C in a refrigerator.
2.6. Linear Sweep Voltammetric Measurements
Linear Sweep Voltammetry (LSV) was carried out on an Autolab Potentiostat using a three-electrode cell with Ag/AgCl as a reference electrode and Pt foil as a counter electrode. Glucose estimation studies using GOx/NSPANISDS/ITO bioelectrode were conducted in the range of 0.0 to 1.0 V in PBS (50 mM, 0.9% NaCl, pH 7.4) containing 5 mM [Fe(CN)6]3−/4− solution. The bioelectrode was kept for 10 s in glucose (Glu) solution for the enzymatic reaction prior to recording of the LSV spectra. LSV studies were carried out to estimate the effect of pH and interferents such as ascorbic acid (AA), uric acid (UA), sodium pyruvate (SP), sodium ascorbate (SA) and urea (U). Artificial conditions were achieved by mixing the interferents AA (0.05 mM), UA (0.1 mM), SP (0.1 mM), SA (0.05 mM) and U (1 mM) with glucose solution (4 mM) in a 1:1 ratio.
2.7. Photometric Studies
Photometric experiments were carried out as a function of glucose concentration using PBS buffer (50 mM, 0.9% NaCl, pH 7.4). These measurements were also used to estimate the enzyme activity. To carry out photometric enzymatic assay of the immobilized GOx, GOx/ NSPANI-SDS/ITO bioelectrode was dipped in 3 ml of PBS solution containing 20 μl of HRP (1 mg∙dl−1), 20 μl of o-dianisidine dye and 100 μl of glucose. The difference between the initial and final absorbance values at 500 nm after 3 min incubation of glucose was recorded and plotted.
3. Results and Discussion
3.1. Optimisation of Formulation Used for the Synthesis of NSPANI-SDS Dispersion
3.1.1. Effect of Concentration of Oxidizing Agent on the Properties of NSPANI-SDS
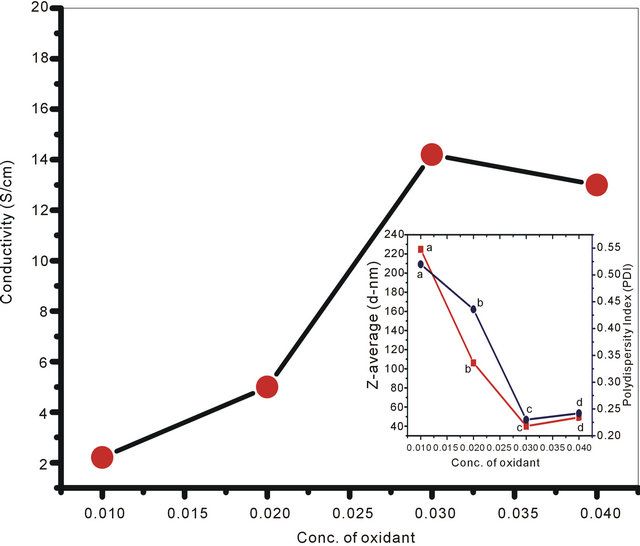
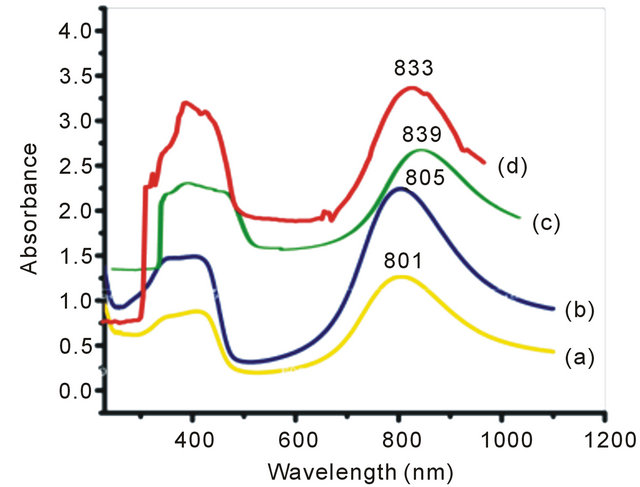
In the present set of investigation, the concentration of oxidizing agent was varied from 0.01 M to 0.04 M for a fixed concentration of monomer (0.02 M) and structure directing agent (0.08 M). All the NSPANI-SDS nanodispersion as synthesized have been characterized by UV-Visible spectroscopy, DLS and conductance measurements (Figures 1(A) and (B)). UV-Visible spectra of the NSPANI-SDS nanodispersion has been illustrated in Figure 1(B). UV-Vis spectra show three characteristics peaks of NSPANI-SDS in the conducting emeraldine salt (ES) form such as localized polaron bands range 765 - 839 nm, two other bands at about 327 - 360 nm and 424 - 470 nm. The first absorption band arises from π-π* electron transition within benzenoid segments. The second and third absorption bands are related to doping level and formation of polaron, respectively. It has been observed
(A)
(B)
Figure 1. (A) Conductivity measurement for NSPANI-SDS: S4I1, S4I2, S3I3 and S4I4, synthesized at various concentration of oxidizing agent. Inset shows DLS (a) (Z-av) and (b) PDI for various concentration of oxidizing agent; (B) UV-Visible spectra of NSPANI-SDS nano dispersion (a) S4I1 (b) S4I2 (c) S4I3 and S4I4 (d).
that with increase in concentration of oxidant there occurs a bathochromic shift in the polaron band upto certain limit (0.03 M) of concentration of oxidants. Beyond that concentration there occurs a blue shift in the polaron band. This may be due to the over oxidation of polymer and reduction in kinetic chain length by the excess oxidant. Figure 1(A) shows the variation of conductivity with the oxidant concentration and the maximum conductivity is observed (S4I3) at an oxidant concentration of 0.03 M which also corresponds to minimum Zav and polydispersity (Figure 1(A): inset (a)). The DLS reflects hydrodynamic volume of the series of NSPANI-SDS nanodispersion (Figure 1(A): inset (a)) with varying concentration of oxidant. This measurement proves that all the polymers (S4I1, S4I2, S4I3 and S4I4) as synthesized are in nano dimension and the nano dimension depends on the concentration of the oxidant for a given concentration of monomer and SDA. The minimum Zav (40.12 nm) and PDI (0.23) are observed at concentration of 0.03 M of oxidant. From the DLS results, it is clear that that there is a critical concentration of oxidant (0.02 M) beyond that there is drastic reduction in dimension of NSPANI-SDS as well as polydispersity takes place. Here, minimum size Zav and polydispersity are observed at an oxidant concentration of 0.03 M. With further increase in oxidant concentration, the conductivity decreases, polymer particle size and polydispersity increases. The decrease in conductivity at higher concentration of oxidant is due to the over oxidation of the NS PANI and decrease in kinetic chain length of polymer. From the above characterization techniques, it has been concluded that smallest size, narrow size distribution and the highest conductivity are obtained when molar concentration of oxidizing agent is 0.03 M (S4I3).
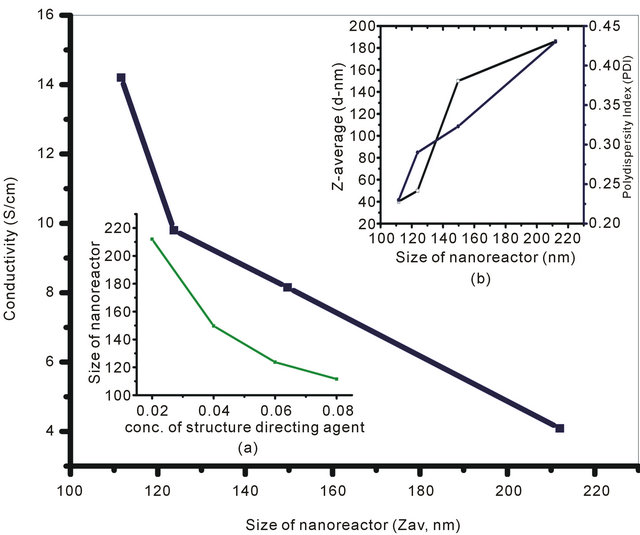
3.1.2. Effect of Nanoreactor Size on the Properties of NSPANI
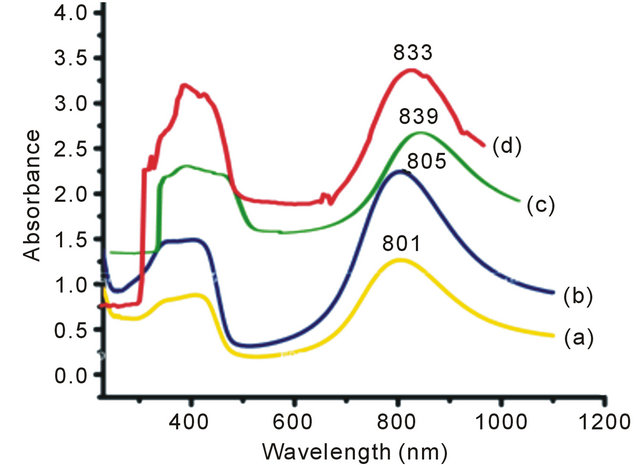
The concentrations of SDA were varied from 0.02 M to 0.08 M in order to monitor the size of nanoreactor for a fixed concentration of monomer (0.02 M) and oxidizing agent (0.03 M). Figure 2(A) reflects the variation of conductivity with the nanoreactor size. The maximum conductivity (14.2 S/cm) has been observed at the minimum nanoreactor size which corresponds to the maximum concentration of SDS (0.08 M). At low temperature, amphiphilic molecules like SDS readily undergo reversible lyotropic liquid crystal transformations and behave an ideal SDA for the synthesis of ordered material composed of framework protonated amine. Furthermore, it can also be seen that size of the nanoreactor, formed by the lyotropic liquid crystal transformation of SDA at low temperature, gradually decreases with increase in concentration of SDA (Figure 2(A): Inset (a)). UV-Visible spectra of the NSPANI-SDS dispersion has been shown in Figure 2(B). UV-Vis spectra show three characteristics absorption peaks of NSPANI in the conducting emeraldine salt (ES). A gradual bathochromic shift of the polaron absorption band in the visible region has been observed with decrease in the size of nanoreactor, i.e., with increase in concentration of SDA. The bathochromic shift is attributed to the nanostructure, extended π conjugation and increased conductivity (Figure 2(B)). The Figure 2(A) (Figure 2(A): Inset (b)) demonstrates that the Zav and polydispersity (PDI) of the polymer decrease with decrease of nanoreactor size. The minimum size and polydispersity have been observed at the nanoreactor size of 110 nm which corresponds to 0.08 M of SDS. On further increase in SDA, the polymerisation becomes difficult due to increase in pH of the medium. From the above discussions, it has been concluded that smallest size, uniform size distribution and the highest conductivity are obtained when SDS concentration is 0.08 M.
3.1.3. Effect of Concentration of Monomer on the Properties of NSPANI
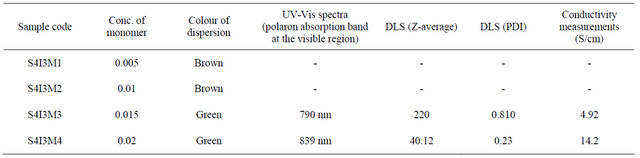
The concentration of monomer was varied from 0.005 M to 0.02 M for a fixed concentration of SDA and oxidizing agent. All the PANI samples are characterized by UV, DLS and conductance measurements. The results are shown in the Table 2.
From the Table 2, it is also clear that a minimum concentration of monomer is required for polymerization to take place for a certain concentration of oxidant and SDA. When molar concentration is less than 0.015, polymerization is not completed as there is oligomer formation instead of polymer formation. With increase in concentration of SDA, number of nanoreactor increases. Therefore, for a fixed monomer concentration, with increase of SDA concentration, monomer concentration per nanoreactor decreases. When the monomer concentration per nano reactor decreases to a certain minimum value, instead of polymer, oligomer is formed. Optimum concentration of monomer is 0.02 M for the synthesis of NSPANI-SDS with respect to minimum size (Zav) and conductivity as it is confirmed by UV-Vis spectra, DLS, conductance measurements. From the above study, it can be inferred that smallest size and highest conductivity is obtained when molar concentrations of monomer, oxidant and SDA are 0.02 M, 0.03 M and 0.08 M respectively. Therefore it has been chosen that S4I3 is the best transduction matrix for biosensor application.
Table 2. Characteristics features of NSPANI-SDS synthesized at various monomer concentrations.
(A)
(B)
Figure 2. (A) Conductivity variation for (S1I3, S2I3, S3I3 & S4I3) with size of nanoreactor: Inset: (a) DLS (Zav and PDI) for various NSPANI-SDS dispersion; (B) UV-Visible spectra of NSPANI nanodispersion (a) S1I3 (b) S2I3 (c) S3I3 and S4I3.
3.2. Electrodeposition of Nanostructured Conducting Polyaniline Film and Characterization of the Electrodes
Cyclic voltmmetric method has been used for electrodeposition of NSPANI-SDS dispersion on ITO. It is required to mention that it is really a challenge to electrodeposit NSPANI nanodispersion on ITO. Out of various PANI nanodispersion (Table 1), only one dispersion (S1I3) can be successfully electro polymerized on ITO using cyclic voltammetric technique. The formulation used for S1I3 preparation nanodispersion is as follows: 0.02 M HCl, 0.02 M aniline, 0.02 M APS and 0.08 M SDS. It has been observed that S1I3 nanodispersion produces a very thin uniform film on ITO by sweeping a potential from −400 mV to +1000 mV (vs. Ag/AgCl) at a scan rate of 80 mV/s, in a three-electrodes cell consisting of Ag/ AgCl as reference, platinum (Pt) as counter electrode and ITO as a working electrode (0.25 cm2). The nanodispersion, as synthesized chemically, have been used for electrodeposition because polyaniline is redox active at this acidic pH. The electrodeposition (Figure 3) curves of NSPANI-SDS exhibit characteristics electrochemistry for NSPANI with the main peaks A and B corresponding to the transformation of leucoemeraldine base (LB) to ES and ES to pernigraniline salt (PS), respectively. On the reverse scan, peaks B’ and A’ correspond to the conversion of PS to ES and ES to LB, respectively [15]. The presence of a small redox peak around +350 mV (C and C’) is associated with the formation of p-benzoquinone and hydroquinone as a side product upon cycling the potential to +1000 mV. The increase in current density with successive scans suggests that the polymer film build up on the electrode surface. The Figure 3: inset shows the plot of maximum nodic peak current vs with number of cycles. The maximum peak current (0.135 mAcm−2) was observed at 34 cycles indicating a continuous film deposition. It can also be observed that the shifts in peak potentials as well as decrease in anodic peak current began to occur after a number of cycles. This may be the result of increased resistance of the electrode, as the film deposited becomes thicker. This decrease in peak current is ascribed to the degradation of polymer film. In the present study, 34 cycles was used for film deposition for biosensor application.
Figures 4(a) and (b) show the SEM images obtained for NSPANI-SDS/ITO and GOx/NSPANI-SDS/ITO electrodes, respectively. The uniform and smooth morphology obtained for NSPANI-SDS/ITO electrode (Figure 4(a)) indicates a homogeneous NSPANI-SDS film deposited on the surface of ITO. The surface morphology of NSPANI-SDS/ITO nanoscale film further changes after the immobilization of GOx revealing immobilization of enzymes (image 4(b)). It may be noted that GOx
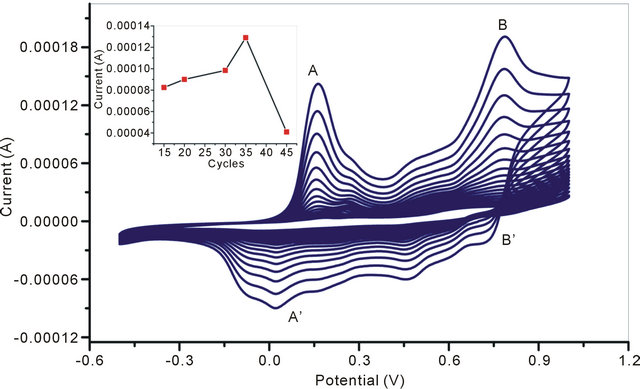
Figure 3. Electrodeposition of NSPANI-SDS on ITO electrode: inset Anodic peak current vs number of cycles during electrodeposition of NSPANI-SDS on ITO.
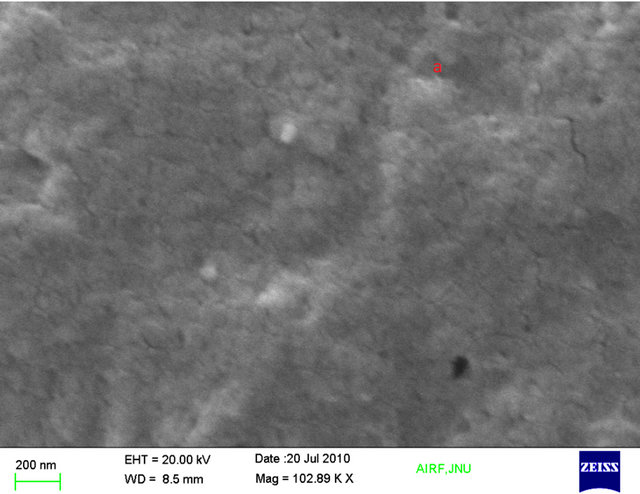
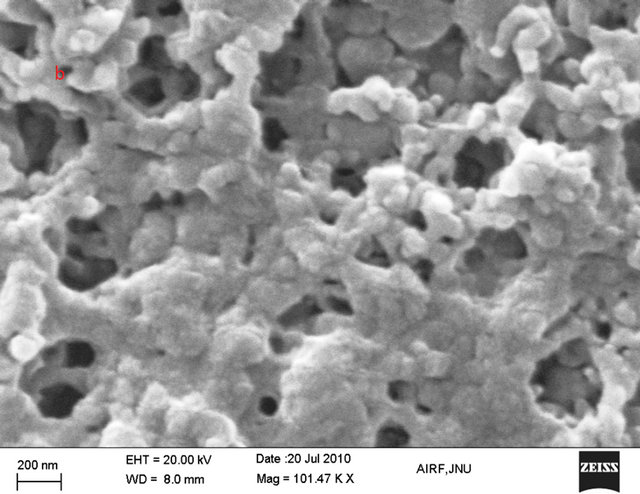
Figure 4. SEM images of (a) NSPANI-SDS/ITO and (b) GOx/NSPANI-SDS/ITO electrodes.
is uniformly dispersed on NSPANI-SDS/ITO film via electrostatic interactions and covalent binding. NSPANISDS film presumably provides mesoporous surface resulting in enhanced enzyme loading at the ITO electrode surface [28].
3.2.1. Electrochemical Impedance Spectroscopy Studies (EIS)
Figure 5 represents the EIS analysis using a Faradaic impedance spectra presented as Nequist plots to find the changes in the charge transfer resistance (Rct) after immobilization of GOx enzyme on NSPANI-SDS/ITO electrode. It has been observed that the value of Rct increased from 1.398 × 10⁻⁶ Ω for NSPANI-SDS/ITO electrode to 2.084 × 10⁻⁵ Ω for GOx/NSPANI-SDS/ITO bioelectrode as represented by curves (a) and (b), respectively, confirms the binding of GOx enzyme onto NSPANI-SDS/ITO electrode. In above figure, the Faradaic impedance spectra presented as Nequist plots has been obtained from real (Z’) and imaginary (Z”) frequency range 0.01 - 105 kHz for both the electrodes in phosphate buffer (50 mM, pH 7.0, 0.9% NaCl) containing 5 mM [Fe(CN)6]3−/4− that yields information about electrical properties at desired interfaces. This increase in Rct is attributed for GOx/NSPANI-SDS/ITO nanobioelectrode to the fact that the most biological molecules including enzymes, are poor electrical conductors at low frequencies (at least <10 kHz) which cause hindrance to the electron transfer. These results indicate binding of GOx onto NSPANI-SDS/ITO electrode.
3.2.2. Linear Sweep Voltametric Studies (LSV)
The LSV curves of NSPANI-SDS/ITO and GOx/ NSPANI-SDS/ITO bioelectrode recorded at scan rate of 100 mV∙s−1 in the range of 0 to +1 V using phosphate buffer of pH 7.0 containing 5 mM [Fe(CN)6]3−/4− are shown in Figure 6. The high value of maximum response current has been found to as 4.02 × 10⁻⁴ A for NSPANI-SDS/ITO (curve a) electrode suggesting high conducting nature of NSPANI-SDS film and confirms nano scale dimension of NSPANI-SDS. It has been observed that the magnitude of current decreases to 1.99 × 10⁻⁴ A for GOx/NSPANI-SDS/ITO nanobioelectrode (curve b) due to insulating characteristics of GOx indicating immobilization of GOx/NSPANI-SDS/ITO bioelectrode.
The cyclic voltametric studies of the GOx/NSPANISDS/ITO bioelectrode in phosphate buffer of pH 7.0 containing 5 mM [Fe (CN)6]3−/4− have revealed considerable variations where cathodic and anodic peaks are found increasing with increasing scan rates varying from 20 to 160 mV/s as represented by Figure 7. This increased peak-to-peak separation reveals facile electron transfer between GOx/NSPANI-SDS/ITO bioelectrode
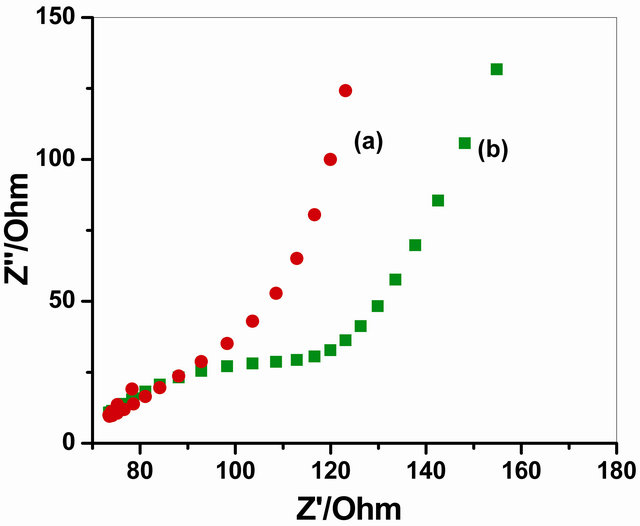
Figure 5. Impedance spectra of (a) NSPANI-SDS/ITO and (b) GOx/NSPANI-SDS/ITO bioelectrode.
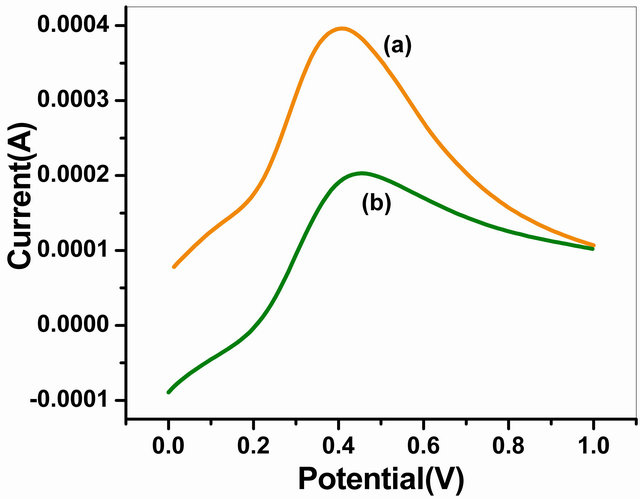
Figure 6. LSV of (a) NSPANI-SDS/ITOand (b) GOx/ NSPANI-SDS/ITO bioelectrode.
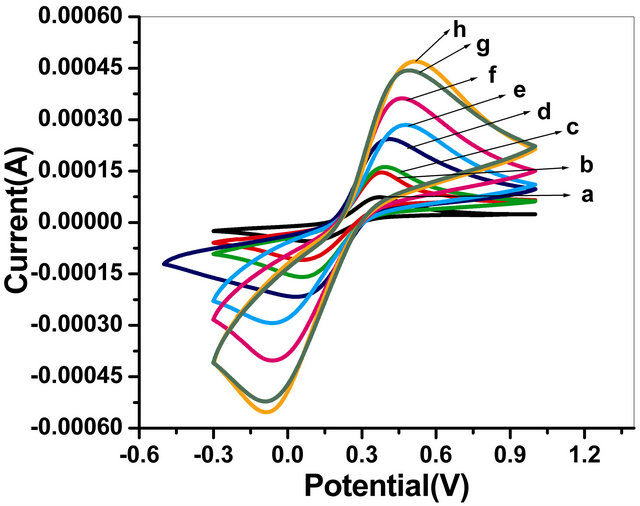
Figure 7. Cyclic voltammograms of the GOx/NSPANISDS/ITO bioelectrode at as a function of scan rate (a) 0.02 mV/s; (b) 0.04 mV/s; (c) 0.06 mV/s; (d) 0.08 mV/s; (e) 0.1 mV/s; (f) 0.12 mV/s; (g) 0.14 mV/s; (h) 0.16 mV/s.
and the medium. With increasing scan rate, the redox peak currents of the GOx/NSPANI-SDS/ITO bioelectrode increase linearly, and the peak-to-peak separation also increases, indicating a surface-controlled process [29]. In addition, in the cyclic voltammograms, the anodic peak potential of the GOx/NSPANI-SDS/ITO bioelectrode has shifted to a more positive value with increasing scan rate, while the cathodic peak potential has shifted in a negative direction. Using the treatment proposed by Laviron based on the variation in peak potential with the logarithm of the scan rate, the heterogeneous electron-transfer rate constant (Ks, s−1) has been calculated as 3.14 s−1 [30]. Such high Ks value indicates a direct electron transfer between the redox active group of the enzyme and the electrode through highly conducting NSPANI-SDS film [31].
3.3. Response Studies of GOx/NSPANI-SDS/ITO Bioelectrode
3.3.1. Linear Sweep Voltametric Studies
The LSV curves of GOx/NSPANI-SDS/ITO electrodes recorded at scan rate of 100 mV∙s−1 in the range of −0.2 to 1 V using phosphate buffer of pH 7.0 containing 5 mM [Fe(CN)6]3−/4− is shown in Figure 8" target="_self"> Figure 8: Inset. The LSV curves plotted against the current vs glucose concentration (Figure 8), the anodic current, observed at around 0.49 V, has been found increasing continuously with glucose concentration, It can be seen from the linear regression curve (Figure 8) of the GOx/NSPANI-SDS/ITO bioelectrode that the bioelectrode can be used to detect glucose in the range of 0.5 mM to 10 mM, follows the equation; [Current (mA) = 0.1 (mA) + 0.0139 (mA∙mM−1) × glucose concentration (mM)]. The sensitivity of the GOx/NSPANI-SDS/ITO bioelectrode calculated from the slope of curve has been found to be 13.9 µA∙mM−1. The standard deviation and correlation coefficient from the linear regression analysis for the bioelectrode have been found to be 6 µA and 0.994 respectively. The anodic peak around 0.49 V corresponds to the oxidation of polyaniline present in the matrix, and its increase with an increase in the glucose concentration suggests that GOx gets electrically contacted by the NSPANI-SDS/ITO electrode [32].
The Michaelis-Menten (Km) kinetic parameters of enzymatic reaction that determine the affinity of enzyme have been estimated using Lineweaver-Burke plot. It may be noted that Km is dependent both on matrix and the method of immobilization of enzymes that often results in their conformational changes resulting in different values of Km. Besides this, the value of Km for the bound enzyme can be lower or higher than that of purified enzyme. We have obtained value of Km for the GOx/NSPANI-SDS/ITO bioelectrode as 0.283 mM. The observed lower value of Km for bound enzyme indicates high affinity for glucose attributed to the immobilization of GOx onto NSPANI-SDS/ITO for faster biochemical reaction. This result can be assigned to the uniform distribution of GOx molecules on to the NSPANI-SDS film surface. The results of triplicate sets (data not shown) reveal reproducibility with in negligible error. The response time of the (GOx/NSPANI-SDS/ITO) is found to
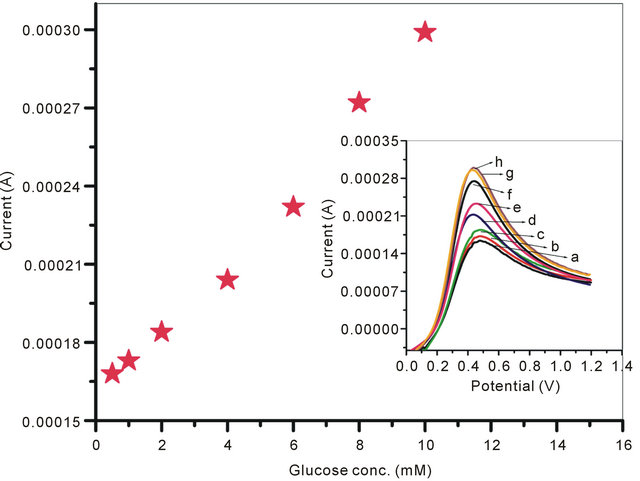
Figure 8. Calibration curve of the GOx/NSPANI-SDS/ITO bioelectrode. Inset: Linear sweep voltammograms recorded for GOx/NSPANI-SDS/ITO bioelectrode as a function of different concentration of glucose (a) 0.5 mM; (b) 1 mM; (c) 2 mM; (d) 4 mM; (e) 6 mM; (f) 8 mM; (g) 10 mM; (h) 12 mM.
be as 12 s which is measured by measuring the time taken to reach the steady state current after applying a steady voltage of 400 mV for 4 mM of glucose solution in 7.0 pH PBS buffer containing 5 mM [Fe(CN)6]3−/4−.
3.3.2. Relationship with the Steady State Current and Glucose Concentration
The Figure 9 depicts the typical current-time plot of the GOx/NSPANI-SDS/ITO for successive addition of glucose in phosphate buffer (50 mM, pH 7.0, 0.9% NaCl) containing 5 mM [Fe(CN)6]3−/4− at an applied potential of 0.300 V versus Ag/AgCl. The bioelectrode exhibits a rapid and sensitive response to glucose and 95% steady state response has been achieved in less than 12 s which confirms a fast electrocatalytic and electron exchange behaviour of bioelectrode, suggesting low diffusional resistance and high electronic conductivity of NSPANISDS, which is comparable with those reported in literatures for nanocomposite electrode [33].
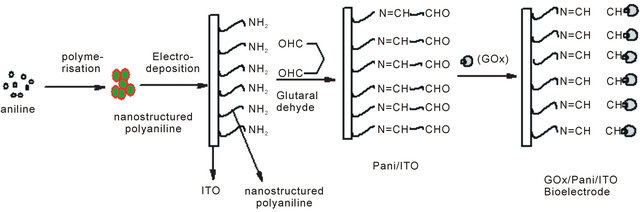
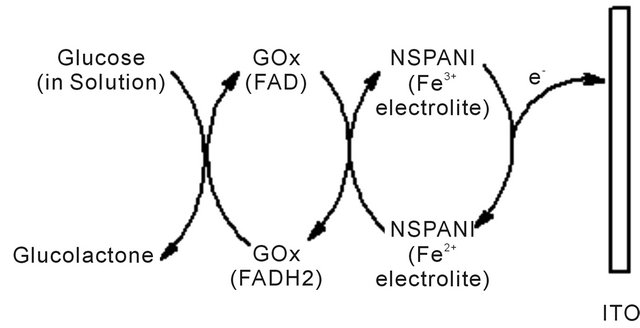
The mechanism for synthesis of bioelectrode, enzymatic reaction and catalytic action of PANI has been shown in Scheme 1. It appears that available NH2 groups of NSPANI-SDS get covalently attached with aldehydes of glutaraldehyde at one end and another aldehydes group gets linked with available-NH2 group of enzymes via covalent bonding and electrostatic interaction between nanobiocomposite and enzymes.
3.3.3. Photometric Studies of Bioelectrode
The photometric measurements have been carried out to check the activity of the GOx onto the GOx/NSPANISDS/ITO bioelectrode. The response has been taken with different glucose concentrations ranging from 2 mM to
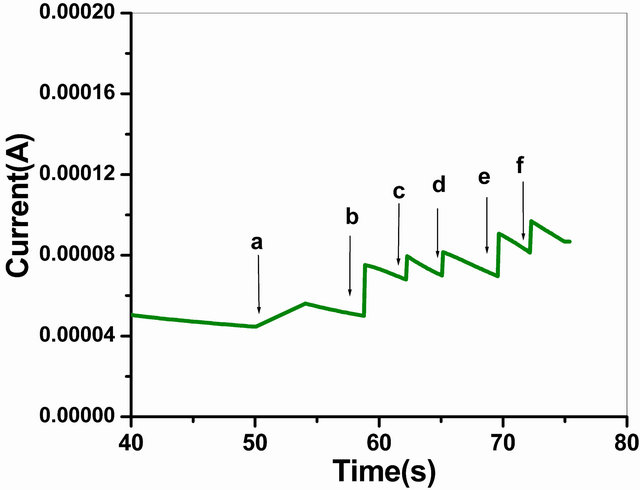
Figure 9. Amperometric response of the GOx/NSPANISDS/ITO bioelectrode (a) to (f) with successive addition of 100 µl of 2 mM/l glucose into PBS (50 mM, pH 7.0, 0.9% NaCl) containing 5 mM [Fe(CN)6]3−/4−.
(a)
(b)
Scheme 1. Proposed (a) mechanism for fabricationof GOx/NSPANI-SDS/ITO bioelectrode (b) biochemical reaction at GOx/ NSPANI-SDS/ITO bioelectrode.
40 mM, and the difference between initial and final absorbance value of oxidized
o-dianisidine due to the enzymatic reaction obtained at 500 nm after 3 min. incubation
of the bioelectrode was recorded (Figure
10). The absorption rate is found to be propotional to the concentration
of glucose in solution. The experiments carried out in triplicate sets and have
been found to be reproducible within 1%. The results have been used to estimate
the amount of immobilized enzyme units using the equation

 (U cm−2) = AV/εts, where A is difference in absorbance before and
after incubation, V is the total volume (3.14 cm−3), ε is the mill
molar extinction coefficient (7.5 for o-dianisidine at 500 nm), t is the reaction
time (min), and s is the surface area (0.20 cm−2) of the electrode.
The value of immobilized GOx units has been estimated to be 7.67 × 10⁻³
U cm−2, indicating that 7.67 × 10⁻³ units of enzyme
actively participate in the biochemical reaction.
(U cm−2) = AV/εts, where A is difference in absorbance before and
after incubation, V is the total volume (3.14 cm−3), ε is the mill
molar extinction coefficient (7.5 for o-dianisidine at 500 nm), t is the reaction
time (min), and s is the surface area (0.20 cm−2) of the electrode.
The value of immobilized GOx units has been estimated to be 7.67 × 10⁻³
U cm−2, indicating that 7.67 × 10⁻³ units of enzyme
actively participate in the biochemical reaction.
3.3.4. Testing of Glucose Concentration in Blood Serum
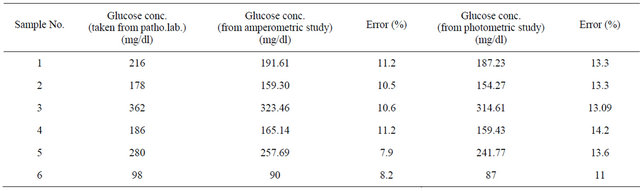
To illustrate feasibility of the bioelectrode in practical analysis, the GOx/NSPANI-SDS/ITO bioelectrodes have been used for estimation of glucose in actual blood serum samples. The LSV measurements have been conducted for the bioelectrodes in phosphate buffer (50 mM, pH 7.0, 0.9% NaCl, 5 mM [Fe(CN)6]3−/4−) containing 100 μl blood serum in a three electrode cell containing Ag/AgCl as reference, Pt electrode as counter and ITO as a working electrode using potentiostat/galvanostat. The glucose content of the blood serum has been calculated from the LSV calibration curve (Figure 8). The results are found to be within 8% - 11% error as it is found from pathological lab (Table 3). The photometric measurements have been conducted for the bioelectrodes in 3 ml of PBS solution containing 20 µl of HRP (1 mg∙dl−1), 20 µl of o-dianisidine dye and 100 µl of blood serum. The glucose content of the blood serum has been calculated from the photometric calibration curve (Figure 10). The results are found to be within 13% - 14% error as it is found from pathological lab (Table 3). The results of photometric and electrochemical measurements are almost identical.
3.4. Performance Evaluation of GOx/NSPANI-SDS/ITO
3.4.1. Effect of pH and Interferent Studies of GOx/NSPANI-SDS/ITO Bioelectrode
To find out the optimum pH, the LSV response of GOx/ NSPANI-SDS/ITO bioelectrode has been taken in PBS solution (50 mM, 0.9% NaCl, 5 mM [Fe(CN)6]3−/4−) of pH ranging from 6.0 to 7.8 at room temperature (25˚C). It has been found that GOx/NSPANI-SDS/ITO bioelectrode is more active at pH 7.0. At this pH, the biomolecules retain their natural structures and do not get denatured. Thus all experiments have been conducted out at a pH 7.0.
The performance of the GOx/NSPANI-SDS/ITO bioelectrode has been studied for various interferents such as AA (0.05 mM), UA (0.1 mM), sodium pyruvate (0.1 mM), sodium ascorbate(0.05 mM) and urea (1 mM) with glucose solution (6 mM) in a 1:1 ratio, using LSV studies. Figure 11(a) shows the effect of interferents on the observed response of GOx/NSPANI-SDS/ITO bioelectrode.
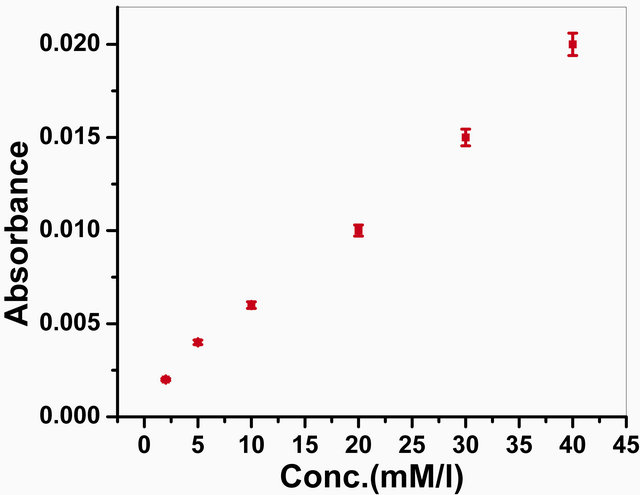
Figure 10. Photometric response of GOx/NSPANI-SDS/ITO bioelectrode as a function of glucose concentration.
Table 3. Results of testing of blood serum samples.
In the figure, the first bar (glucose) shows the current obtained with 4 mM glucose concentration. The remaining bars show the current corresponding to the mixture of glucose and interferents in a 1:1 ratio. The straight line parallel to the x axis shows the variation in observed current in the presence of desired interferents, revealing a maximum of 9% interference. The percentage interference (% interference) was calculated using Equation (1) for various interferents:
 (1)
(1)
where, Iglu is the current obtained with 6 mM glucose and Iinter is the current corresponding to the mixture of glucose and interferents in a 1:1 ratio.
3.4.2. Reusability of Bioelectrodes
This bioelectrode can be used more than 10 times. The results of triplicate sets (data not shown) reveal reproducibility within 1% error. Figure 11(b) shows reusability of GOx/NSPANI-SDS/ITO bioelectrodes.
The storage stability of GOx/NSPANI-SDS/ITO bioelectrode has been determined by measuring the response current at regular interval of 1 week for about 2.5 months. This GOx/NSPANI-SDS/ITO bioelectrode is stored at 4˚C when not in use. The bioelectrodes are found to be stable up to 12 weeks with 100% activity. The remarkable stability and reusability of the bioelectrode can be attributed to two points: on the one hand, the matrices are highly stable, on the other hand, the NSPANI-SDS can provide a good microenvironment for GOx immobilization.
The results obtained in the present investigaion, along with those reported in the literature, are summarized in Table 4. The advantage of NSPANI-SDS film over the other matrices is clearly visible from this table given that the nanobioelectrode can detect glucose over a broad range, and real time monitoring, remarkable shelf life with high sensitivity.
4. Conclusion
The synthesis formulation of NSPANI-SDS dispersion have been optimized using various concentration of oxidants, SDA and monomer. Out of the series of synthesized NSPANI-SDS dispersion, only one polymer (prepared at lowest concentration of SDA, S1I3) can be successfully elctrodeposited onto ITO for the fabrication glucose biosensor. Electrodeposition of NSPANI-SDS dispersion on ITO can produce a thin uniform porous stable film which can provide a compatible microenvironment at the nano scale to improve enzyme immobilization for novel mediatorless reusable real time monitoring glucose biosensor applications. The unique features
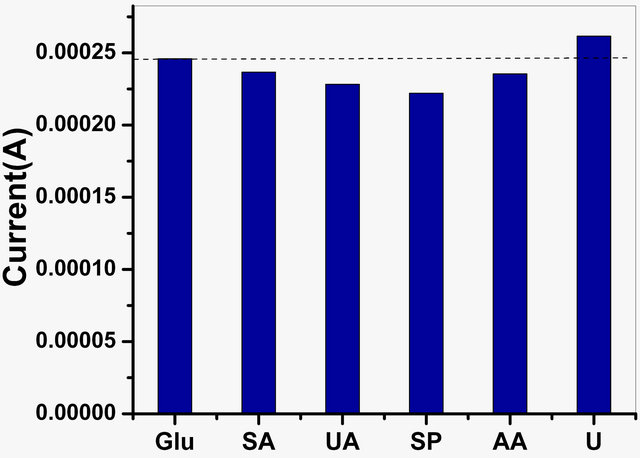 (a)
(a)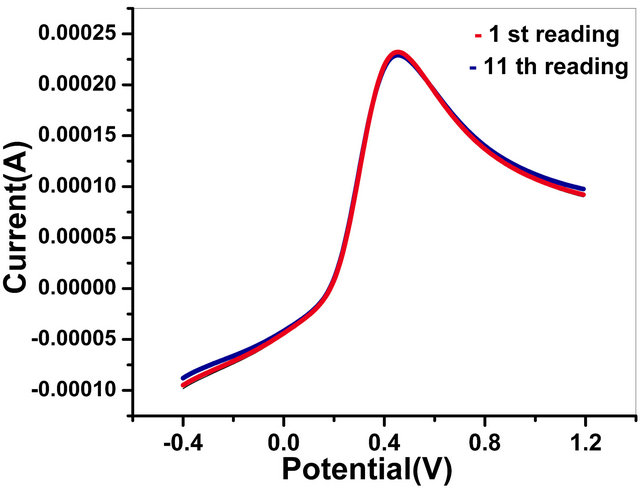 (b)
(b)
Figure 11 (a) Effect of various interferents on tne response of GOx/NSPANI-SDS/ITO bioelectrode; (b) Results of reusability testing (LSV Curves of GOx/NSPANI-SDS/ITO bioelectrodes with 4 mM glucose concentration for 1st and 11th times response with the same electrode).
of the developed glucose biosensor are reusability, real time monitoring and remarkable shelf life apart from the high reproducible sensitivity of 13.9 µA∙mM−1, low response time of 12 s, detection limit of 0.1 mM, high heterogeneous electron transfer rate constant (3.14 s−1), shelf life and low Km value of 0.283 mM. The glucose bioelectrodes have exhibited a remarkable on-line performance. The above sensor can be used successfully to detect glucose in blood serum samples with wide variation of glucose content (98 mg/dl to 362 mg/dl) and the results have been found to be within 11% error. To the best of our knowledge, this is the first time reusable glucose nanobioelectrode with high shelf life based on conducting polymer has been reported. This developed nanostructured conducting polyaniline thin film can be used as a successful reusable transducer matrix for other type of biosensor applications also.
5. Acknowledgements
We thank Dr. Ashok Kumar Chauhan (Founder President, Amity University Uttar Pradesh, India) for providing the
Table 4. Characteristics of GOx/NSPANI-SDS/ITO bioelectrode compared with those reported in literature based on GOx as a sensing agent.
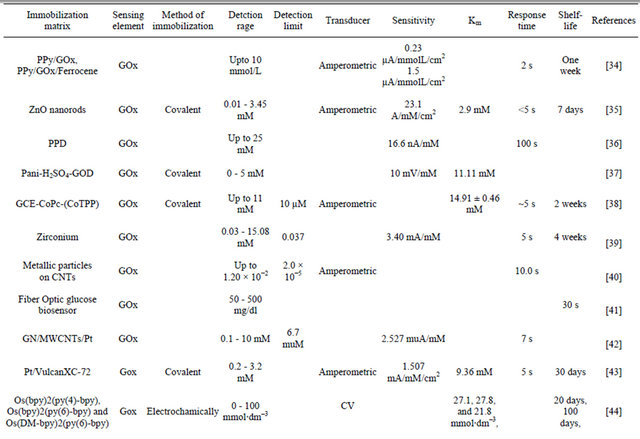
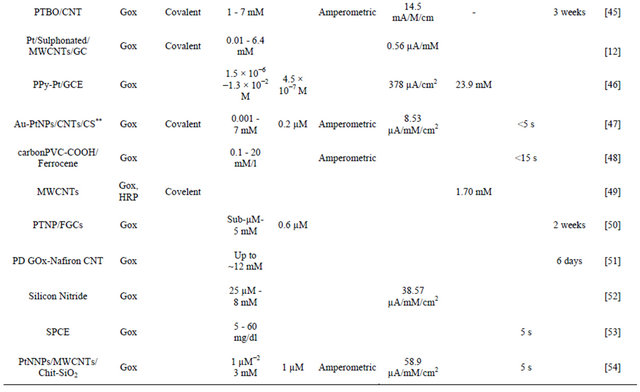
Continued
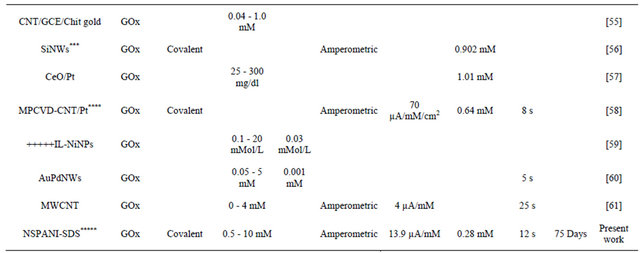
Gold nanoparticles-mesoporous silica composite on glassy carbon; **Gold-platinum alloy nanoparticles/multiwall carbon nanotubes/chitosan; ***Silicon nanowire; ****Microwave plasma chemical vapor deposited-carbon nanotubes/platinum nanosphere; *****Nanostructured polyaniline; *****Ionic liquid; SPCE screen printed carbon electrode; Chit-chitosine.
facilities. We offer thanks to Dr (Mrs) Balwiner Shukla, Director General A.S.E.T, Dr. R. P. Singh, Director, AINT, and AUUP for interesting discussions. We acknowledge the financial assistance received from the Department of Biotechnology, Govt. of India (Project No BTPR 11123/MD/32/41/2008 DBT) for the financial support, India. We thank Dr. Chandra pathological lab at Mayur Vihar Phase1, New Delhi, India and Metro polish pathological lab at Sec.8, Noida, UP, India for providing the blood serum samples.
REFERENCES
- M. Ferreira, P. A. Fiorito, O. N. Oliveira Jr. and S. I. C. de Torresi, “Enzyme-Mediated Amperometric Biosensors Prepared with the Layer-by-Layer (LbL) Adsorption Technique,” Biosensors and Bioelectronics, Vol. 19, No. 12, 2004, pp. 1611-1615. doi:10.1016/j.bios.2003.12.025
- L. Boguslavsky, H. Kalash, Z. Xu, D. Beckles, L. Geng, T. Skotheim, V. Laurinavicius and H. S. Le, “Thin Film Bienzyme Amperometric Biosensors Based on Polymeric Redox Mediators with Electrostatic Bipolar Protecting Layer,” Analytica Chimica Acta, Vol. 311, No. 1, 1995, pp. 15-21. doi:10.1016/0003-2670(95)00168-Y
- E. Wilkins and P. Atanasov, “Glucose Monitoring: State of the Art and Future Possibilities,” Medical Engineering & Physics, Vol.18, No. 4, 1996, pp. 273-288. doi:10.1016/1350-4533(95)00046-1
- F. Battaglini, P. N.Bartlett and J. H. Wang, “Covalent Attachment of Osmium Complexes to Glucose Oxidase and the Application of the Resulting Modified Enzyme in an Enzyme Switch Responsive to Glucose,” Analytical Chemistry, Vol. 72, No. 3, 2000, pp. 502-509. doi:10.1021/ac990321x
- J. J. Burmeister and G. A. Gerhardt, “Self-Referencing Ceramic-Based Multisite Microelectrodes for the Detection and Elimination of Interferences from the Measurement of l-Glutamate and Other Analytes,” Analytical Chemistry, Vol. 73, No. 5, 2001, pp. 1037-1042. doi:10.1021/ac0010429
- J. H. Yu, S. Q. Liu and H. X. Ju, “Glucose Sensor for Flow Injection Analysis of Serum Glucose Based on Immobilization of Glucose Oxidase in Titania Sol-Gel Membrane,” Biosensors and Bioelectronics, Vol. 19, No. 4, 2003, pp. 401-409. doi:10.1016/S0956-5663(03)00199-4
- J. Z. Xu, J. J. Zhu, Q. Wu, Z. Hu and H. Y. Chen, “An Amperometric Biosensor Based on the Coimmobilization of Horseradish Peroxidase and Methylene Blue on a Carbon Nanotubes Modified Electrode,” Electroanalysis, Vol. 15, 2003, pp. 219-224. doi:10.1002/elan.200390027
- M. Gao, L. M. Dai and G. G. Wallace, “Biosensor Based on Aligned Carbon Nanotubes Coated with Inherently Conducting Polymer,” Electroanalysis, Vol. 15, 2008, pp. 1089-1094. doi:10.1002/elan.200390131
- E. S. Forzani, H. Q. Zhang, L. A. Nagahara, I. Amlani, R. Tsui and N. J. Tao, “A Conducting Polymer Nanojunction Sensor for Glucose Detection,” Nano Letters, Vol. 4, No. 9, 2004, pp.1785-1788. doi:10.1021/nl049080l
- M. A. Rahman, N. H. Kwon, M. S. Won, E. S. Choe and Y. B. Shim, “Functionalized Conducting Polymer as an Enzyme-Immobilizing Substrate: An Amperometric Glutamate Microbiosensor for in Vivo Measurements,” Analytical Chemistry, Vol. 77, 2005, pp. 4854-4860. doi:10.1021/ac050558v
- Y. Z. Xian, Y. Hu, F. Liu, Y. Xian, H. T. Wang and L. T. Jin, “Glucose Biosensor Based on Au NanoparticlesConductive Polyaniline Nanocomposite,” Biosensors and Bioelectronics, Vol. 21, No. 10, 2006, pp. 1996-2000. doi:10.1016/j.bios.2005.09.014
- H. J. Wang, C. M. Zhou, F. Peng and H. Yu, “Glucose Biosensor Based on Platinum Nanoparticles Supported Sulfonated-Carbon Nanotubes Modified Glassy Carbon Electrode,” International Journal of Electrochemica Science, Vol. 2, No. 7, 2007, pp. 508-516.
- J. Huang, S. Virji, B. H. Weiller and R. B. Kaner, “Polyaniline Nanofibers:
 Facile Synthesis and Chemical Sensors,” Journal of the American Chemical Society,
Vol. 125, No. 2, 2003, pp. 314-315. doi:10.1021/ja028371y
Facile Synthesis and Chemical Sensors,” Journal of the American Chemical Society,
Vol. 125, No. 2, 2003, pp. 314-315. doi:10.1021/ja028371y - A. Kuczynska, A. Uygun, A. Kaim, A. H. WilczuraWachnik, A. G. Yavuzb and M. M. Aldissic, “Effects of Surfactants on the characteristics and Biosensing Properties of Polyaniline,” Polymer International, Vol. 59, No. 12, 2010, pp. 1650-1659. doi:10.1002/pi.2898
- K. Ramanathan, M. A. Bangar, M. Yun, W. Chen, N. V. Myung and A. Mulchandani, “Bioaffinity Sensing Using Biologically Functionalized Conducting-Polymer Nanowire,” Journal of the American Chemical Society, Vol. 127, No. 2, 2005, pp. 496-497. doi:10.1021/ja044486l
- A. Morrin, O. Ngamna, A. J .Killard, S. E. Moulton, M. R. Smyth and G. G. Wallace, “An Amperometric Enzyme Biosensor Fabricated from Polyaniline Nanoparticles,” Electroanalysis, Vol. 17, No. 5-6, 2005, pp. 423-430. doi:10.1002/elan.200403185
- C. Dhand, M. Das, G. Sumana, A. K. Srivastava, M. K. Pandey, C. G. Kim, M. Datta and B. D. Malhotra, “Preparation, Characterization and Application of Polyaniline Nanospheres to Biosensing,” Nanoscale, Vol. 2, No. 5, 2010, pp. 747-754. doi:10.1039/b9nr00346k
- M. R. Anderson, B. R. Mattes, H. Reiss and R. B. Kaner, “Conjugated Polymeric Films for Gas Separations,” Science, Vol. 252, 1991, pp. 1412-1415
- Y. Cao, P. Smith and A. J. Heeger, “Counterion Induced Processability of Conducting Polyaniline,” Synthetic Metals, Vol. 57, No. 1, 1993. pp. 3514-3519. doi:10.1016/0379-6779(93)90468-C
- J. C. Chiang and A. G. MacDiarmid, “Polyaniline: Protonic Acid Doping of the Emeraldine form to the Metallic Regime,” Synthetic Metals, Vol. 13, No. 1-3, 1986, pp. 93-205. doi:10.1016/0379-6779(86)90070-6
- Z. Niu, Z. Yang, Z. Hu, Y. Lu and C. C. Han, “Mixed Homopolymer ... Amphiphilic Dendrimer-Like Star Polymer with Various Functional Surface Groups,” Advanced Functional Materials, Vol. 13, 2003, pp. 925-928.
- G. C. Li, C. Q. Zhang and H. R. Peng, “Facile Synthesis of Self-Assembled Polyaniline Nanodisks,” Macromolecular Rapid Communications, Vol. 29, No. 1, 2008, pp. 63-67. doi:10.1002/marc.200700584
- A. Wei, X. W. Sun, J. X. Wang, Y. Lei, X. P. Cai, C. M. Li, Z. L. Dong and W. Huang “Enzymatic Glucose Biosensor Based on ZnO Nanorod Array Grown by Hydrothermal Decomposition,” Applied Physics Letters, Vol. 89, No. 12, 2006, Article ID: 123902. doi:10.1063/1.2356307
- J. Huang and R. B. Kaner, “A General Chemical Route to Polyaniline Nanofibers,” Journal of the American Chemical Society, Vol. 126, No. 3, 2004, pp. 851-855. doi:10.1021/ja0371754
- D. Li and R. B. Kaner, “Shape and Aggregation Control of Nanoparticles: Not Shaken, Not Stirred,” Journal of the American Chemical Society, Vol. 128, No. 3, 2006, pp. 968-975. doi:10.1021/ja056609n
- R. Khan, P. R. Solanki, A. Kaushik, S. P. Singh, S. Ahmad and B. D. Malhotra, “Cholesterol Biosensor Based on Electrochemically Prepared Polyaniline Conducting Polymer Film in Presence of a Nonionic Surfactant,” Journal of Polymer Research, Vol. 16, No. 4, 2009, pp. 363-373. doi:10.1007/s10965-008-9237-8
- A. Uygun, A. G. Yavuz, S. Sen and M. Omastova, “Polythiophene/SiO2 Nanocomposites Prepared in the Presence of Surfactants and Their Application to Glucose Biosensoing,” Synthetic Metals, Vol. 159, No. 19-20, 1999, pp. 2022-202. doi:10.1016/j.synthmet.2009.07.009
- M. Nandi, R. Gangopadhyay and A. Bhaumik, “Mesoporous Polyaniline Having High Conductivity at Room Temperature,” Microporous and Mesoporous Materials, Vol. 109, No. 1-3, 2008, pp. 239-247. doi:10.1016/j.micromeso.2007.04.049
- A. J. Bard and L. R. Faulkner, “Electrochemical Methods: Fundamentals and Applications,” 2nd Edition, Wiley & Sons, New York, 2001.
- E. Laviron, “General Expression of the Linear Potential Sweep Voltammogram in the Case of Diffusion Less Electrochemical Systems,” Journal of Electroanalytical Chemistry and Interfacial Electrochemistry, Vol. 101, No. 1, 2001, pp. 19-28. doi:10.1016/S0022-0728(79)80075-3
- N. Sato, N. and H. Okuma, “Development of Single-Wall Carbon Nanotubes Modified Screen-Printed Electrode Using a Ferrocene-Modified Cationic Surfactant for Amperometric Glucose Biosensor Applications,” Sensors and Actuators B: Chemical, Vol. 129, No. 1, 2008, pp. 188- 194. doi:10.1016/j.snb.2007.07.095
- C. Dhand, S. K. Arya, M. Data and B. D. Malhotra, “Polyaniline-Carbon Nanotube Composite Film for Cholesterol Biosensor,” Analytical Biochemistry, Vol. 383, 2008, pp. 194-199. doi:10.1016/j.ab.2008.08.039
- J. Wang and M. Musameh, “Carbon-Nanotubes Doped Polypyrrole Glucose Biosensor,” Analytica Chimica Acta, Vol. 539, No. 1-2, 2005, pp. 209-213. doi:10.1016/j.aca.2005.02.059
- P. A. Fiorito and S. I. C. de Torresi, “Glucose Amperometric Biosensor Based on the Co-Immobilization of Glucose Oxidase (GOx) and Ferrocene in Poly (Pyrrole) Generated from Ethanol/Water Mixtures,” Journal of the Brazilian Chemical Society, Vol. 12, No. 6, 2001, pp. 729-733. doi:10.1590/S0103-50532001000600007
- A. Wei, X. W.Sun, J. X. Wang, Y. Lei, X. P. Cai, C. M. Li, Z. I. Dong and W. Huang, “Enzymatic Glucose Biosensor Based on ZnO Nanorod Array Grown by Hydrothermal Decomposition,” Applied Physics Letters, Vol. 89, No. 12, 2006, Article ID: 123902. doi:10.1063/1.2356307
- Y. Q. Miao, J. R. Chen and X. H. Wu, “Construction of a Glucose Biosensor by Immobilizing Glucose Oxidase within a Poly (Ophenylenediamine) Covered ScreenPrinted Electrode,” Journal of Biological Sciences, Vol. 6, No. 1, 2006, pp. 18-22.
- P. D. Gaikwad, D. J. Gade, V. K. Savale, P. A. Kharat, H. J. Kharat, K. P. Kakde and M. D. Shirsat, “Immobilization of GOD on Electrochemically Synthesized PANI Film by Cross-Linking via Glutaraldehyde for Determination of Glucose,” International Journal of Electrochemical Science, Vol. 1, No. 8, 2006, pp. 425-434.
- K. I. Ozoemena and T. Nyokong, “Novel Amperometric Glucose Biosensor Based on an Ether-Linked Cobalt (II) Phthalocyanine-Cobalt (II) Tetraphenylporphyrin Pentamer as a Redox Mediator,” Electrochimica Acta, Vol. 51, No. 24, 2006, pp. 5131-5136. doi:10.1016/j.electacta.2006.03.055
- H. J. Kim, H. Y. Sook, N. C. Han, Y. K. Lyu and W. Y. Lee, “Amperometric Glucose Biosensor Based on SolGel-Derived Zirconia/Nafion Composite Film as Encapsulation Matrix,” Bulletin of the Korean Chemical Society, Vol. 27, 2006, pp. 65-70. doi:10.5012/bkcs.2006.27.1.065
- G. L. Luque, N. F. Ferreyra and G. A. Rivas, “Glucose Biosensor Based on the Use of a Carbon Nanotube Paste Electrode Modified with Metallic Particles,” Microchimica Acta, Vol. 152, No. 3-4, 2006, pp. 277-283. doi:10.1007/s00604-005-0447-z
- D. Jiang, F. Liu, X. Chen and J. Huang, “Design and Properties Study of Fiber Optic Glucose Biosensor,” Chinese Optics Letters, Vol. 1, No. 2, 2003, pp. 108-110.
- B. Y. Wu, S. H. Hou, F. Yin, Z. X. Zhao, Y. Y. Wang, X. S. Wang and Q. Chen, “Amperometric Glucose Biosensor Based on Multilayer Films via Layer-by-Layer Self-Assembly of Multi-Wall Carbon Nanotubes, Gold Nanoparticles and Glucose Oxidase on the Pt Electrode,” Biosensors & Bioelectronics, Vol. 22, No. 12, 2007, pp. 2854- 2860. doi:10.1016/j.bios.2006.11.028
- Z. Cao, Y. Zou and C. Xiang, “Amperometric Glucose Biosensor Based on Ultrafine Platinum Nanoparticles,” Analytical Letters, Vol. 40, No. 11, 2007, pp. 2116-2127. doi:10.1080/00032710701566909
- M. Tsujimoto, T. Yabutani, A. Sano, Y. Tani, H. Murotani, Y. Mishima, K. Maruyama, M. Yasuzawa and J. Motonaka, “Characterization of a Glucose Sensor Prepared by Electropolymerization of Pyrroles Containing a Tris-Bipyridine Osmium Complex,” Analytical Sciences, Vol. 23, No. 1, 2007, pp. 59-63. doi:10.2116/analsci.23.59
- Y. L. Yao and K. K. Shiu, “Low Potential Detection of Glucose at Carbon Nanotube Modified Glassy Carbon Electrode with Electropolymerized Poly (Toluidine Blue O) Film,” Electrochimica Acta, Vol. 53, No. 2, 2007, pp. 278-284. doi:10.1016/j.electacta.2007.04.007
- J. Li and X. Lin, “Glucose Biosensor Based on Immobilization of Glucose Oxidase in Poly (o-Aminophenol) Film on Polypyrrole-Pt Nanocomposite Modified Glassy Carbon Electrode,” Biosensors and Bioelectronics, Vol. 22, No. 12, 2007, pp. 2898-2905. doi:10.1016/j.bios.2006.12.004
- X. Kang, Z. Mai, X. Zou, P. Cai and D. J. Mo, “A Novel Glucose Biosensor Based on Immobilization of Glucose Oxidase in Chitosan on a Glassy Carbon Electrode Modified with Gold-Platinum Alloy Nanoparticles/Multiwall Carbon Nanotubes,” Analytical Biochemistry, Vol. 369, 2007, pp. 71-79. doi:10.1016/j.ab.2007.07.005
- C. X. Li, Y. L. Zeng and C. R. Tang, “Glucose Biosensor Based on Carbon/PVC-COOH/Ferrocene Composite with Covalently Immobilized Enzyme,” Chinese Chemical Letters, Vol. 16, No. 10, 2005, pp. 1357-1360.
- A. Salimi, A. Noorbakhsh and M. Ghadermarz, “Direct Electrochemistry and Electrocatalytic Activity of Catalase Incorporated onto Multiwall Carbon Nanotubes-ModiWed Glassy Carbon Electrode,” Analytical Biochemistry, Vol. 344, 2005, pp. 16-24. doi:10.1016/j.ab.2005.05.035
- H. Wu, J. Wang, X. Kang, C. Wang, D. Wang, J. Liu, L. A. Aksay and Y. Lin, “Glucose Biosensor Based on Immobilization of Glucose Oxidase in Platinum Nanoparticles/Graphene/Chitosan Nanocomposite Film,” Talanta, Vol. 80, No. 1, 2009, pp. 403-406. doi:10.1016/j.talanta.2009.06.054
- S. H. Lim, J. Wei, J. Li, Q. Li and J. K. You, “A Glucose Biosensor Based on Electrodeposition of Palladium Nanoparticles and Glucose Oxidase onto Nafion-Solubilized Carbon Nanotube Electrode,” Biosensors and Bioelectronics, Vol. 20, No. 11, 2005, pp. 2341-2346. doi:10.1016/j.bios.2004.08.005
- A. Salimi, R. Zand-Karimi, A. Noorbakhash and S. Soltanian, “Glucose Biosensor Based on Silicon Nitride Nanoparticles,” Electroanalysis, Vol. 22, No. 20, pp. 2434-2442. doi:10.1002/elan.201000131
- Z. Gao, F. Xie, M. Shariff, M. Arshad and J. Y. Ying, “A Disposable Glucose Biosensor Based on Diffusional Mediator Dispersed in Nanoparticulate Membrane on ScreenPrinted Carbon Electrode,” Sensors and Actuators B: Chemical, Vol. 111-112, 2005, pp. 339-346. doi:10.1016/j.snb.2004.12.008
- Y. Zou, C. Xiang, L. X. Sun and F. Xu, “Glucose Biosensor Based on Electrodeposition of Platinum Nanoparticles onto Carbon Nanotubes and Immobilizing Enzyme with Chitosan-SiO2 Sol-Gel,” Biosensors & Bioelectronics, Vol. 23, No. 7, 2008, pp. 1010-1016. doi:10.1016/j.bios.2007.10.009
- X. Luo, A. J. Killard and M. R. Smyth, “Reagentless Glucose Biosensor Based on the Direct Electrochemistry of Glucose Oxidase on Carbon Nanotube-Modified Electrodes,” Electroanalysis, Vol. 18, No. 11, 2006, pp. 1131- 1134. doi:10.1002/elan.200603513
- S. Su, Y. He, S. Song, D. Li, L. Wang, C. Fan and S. T. Lee, “A Silicon Nanowire-Based Electrochemical Glucose Biosensor with High Electrocatalytic Activity and Sensitivity,” Nanoscale, Vol. 2, No. 9, 2010, pp. 1704- 1707. doi:10.1039/c0nr00314j
- S. Saha, S. K. Arya, S. P. Singh, K. Sreenivas, B. D. Malhotra and V. Gupta, “Nanoporous Cerium Oxide Thin Film for Glucose Biosensor,” Biosensors and Bioelectronics, Vol. 24, No. 7, 2009, pp. 2040-2045. doi:10.1016/j.bios.2008.10.032
- J. C. Claussen, S. S. Kim, A. Haque, M. S, Artiles, D. M. Porterfield and T. S. Fisher, “Electrochemical Glucose Biosensor of Platinum Nanospheres Connected by Carbon Nanotubes,” Journal of Diabetes Science and Technology, Vol. 4, No. 2, 2010, pp. 312-319.
- X. M. Zhuang, T. Yang, W. Zhang, W. J .Li and K. Jiao, “Nonenzymatic Electrochemical Glucose Biosensor Based on Ionic Liquid and Nickel Nanoparticles,” Sensor Letters, Vol. 8, No. 4, 2010, pp. 690-691. doi:10.1166/sl.2010.1310
- [61] M. Zhang, F. Cheng, Z. Cai and H. Yao, “Glucose Biosensor Based on Highly Dispersed Au Nanoparticles Supported on Palladium Nanowire Arrays,” International Journal of Electrochemical Science, Vol. 5, 2010, pp. 1026-1031
- [62] T. P. Sun, H. L. Shieh, C. T. S. Ching, Y. D. Yao, S. H. Huang, C. M. Liu, W. H. Liu and C. Y. Chen, “Carbon Nanotube Composites for Glucose Biosensor Incorporated with Reverse Iontophoresis Function for Noninvasive Glucose Monitoring,” International Journal of Nanomedicine, Vol. 5, 2010, pp. 343-349.
NOTES
*Corresponding author.