Technology and Investment
Vol.1 No.4(2010), Article ID:3208,6 pages DOI:10.4236/ti.2010.14028
Cost Benchmarking of Generation Utilities Using DEA: A Case Study of India
Department of Electrical Engineering, National Institute of Technology, MANIT-Bhopal, India
E-mail: {shafalijain9, tripta_thakur}@yahoo.co.in, arunshandilya@yahoo.com
Received July 28, 2010; revised September 8, 2010; accepted September 12, 2010
Keywords: Data envelopment analysis (DEA), Generation company (GENCO), cost benchmarking, target evaluation
Abstract
Technical efficiency of electric utility is the critical element for its competitiveness in the electricity market and very relevant in the Indian electricity sector presently. This paper is aimed to measure the efficiencies of 30 state owned electric generation utilities/companies for the year 2007-2008 by applying DEA models with single input and two outputs. The input used is total cost and outputs are units of energy generated and total energy sold or consumed. Cost benchmarking has been carried out so that cost controls can be implemented. In addition, the target evaluation for input cost has also been done. The result of this model shows that GENCOs are generally inefficient in cost frontier and there is an urgent need for intro inspection. This will help for GENCOs. The result shows that the total average of overall, technical and scale efficiencies are 46%, 75.1% and 60% respectively. This efficiency measurement assists the utilities by identifying their shortcomings, setting targets and trying to reach the set targets.
1. Introduction
Recent electricity sector reforms in the form of liberalization, privatization, and implementation of a new regulatory design around the world have been radically transformed the power sector. Enhancing efficiency, productivity and quality are the goals behind these reforms. A similar had been followed by India which experienced electric power reforms in early 1991. Today's competitive electricity market has heightened the need for methods to evaluate the technical efficiency of the electric utility [1]. Among many possible efficiency measurement methods, Data Envelopment Analysis (DEA) is one method that has been used especially for the complicated systems with lots of inputs and outputs for benchmarking since its introduction by Charnes, Cooper and Rhodes in 1978 based on previous work by Farrell on production efficiency [2]. DEA methodology has been most commonly used for calculating the efficiency of utilities and benchmarking their performances to establish the best practices [3].
The deficiency in power availability in India is a significant obstacle to the smooth development of the economy [4-5]. The deficits experienced in India during the last two decades can be attributed to two main reasons. One reason is the huge growth in demand for electricity, mostly from industries and agriculture. The other reason is the unbelievable level of inefficiencies at all stages between electricity generation and its end use. India exhibits one of the lowest levels of efficiency in the overall management of electricity. The peak power deficit is 13.9% and base energy deficit has gone up to 9.3%. To bridge its future demand–supply gap, India would need capacity addition of nearly 100,000 MW in the coming 10-12 years [6]. The Ministry of Power (MoP) estimates that the additional capacity requirement to meet these shortages is about 10,000 MW every year. This translates into an asset of about US$10 billion per annum. To fulfill the objective of Indian Government to provide power to all by 2012, and to bridge the demand-supply gap country needs huge investment requirements [7]. Country has already done vast investment in reform programs with the aid of internal/external investors. Before going for further investment it is necessary to have empirical analysis of the extent to which the structural change of Indian electric power industry is working. Improving the efficiency levels would be able to remove the deficits completely but there have not been serious efforts to improve the efficiency levels to the international best practice levels [8-9]. Bridging the gap in demand and supply has become significant and accordingly this strongly necessitates assessment of performance of generation utilities [10].
This paper presents the cost benchmarking of Indian electric generation companies by analyzing their efficiency using DEA methodology for the year 2007-2008.
2. Indian Generation Sector
India is world's fifth largest consumer of energy. It is sixth largest generating company in the world and third largest in Asia. The Indian power sector is divided into five Regions: Northern, Western, Southern, Eastern, and the North-Eastern Region; and each state in India has its own state owned electric utility (SOEU). The Central Electricity Authority (CEA) is responsible for power planning at the national level. CEA advises the Ministry of power (MOP) on matters concerning the national power policy, and national power planning. Regulatory matters in the center are taken care by the Central Electricity Commission (CERC) and the State Electricity Regulatory Commission (SERC) take care corresponding regulatory issue at the state level.
The electricity sector in India is predominantly controlled by the Government of India’s public sector undertakings (PSUs). Major PSUs involved in the generation of electricity include National Thermal Power Corporation (NTPC), National Hydroelectric Power Corporation (NHPC) and Nuclear Power Corporation of India (NPCI). In electricity generation, the contribution of state, central and private sectors are 52.5, 34 and 13.5% respectively. As on 31st march, 2008, there were eight State Electricity Boards and thirteen Electricity Departments in the States and Union Territories and total fifteen utilities have been unbundled.
3. Methodology
DEA occasionally called frontier analysis was first place ahead by Charnes, Cooper and Rhodes in 1978 [4]. It is a performance measurement technique which, can be used for evaluating the relative efficiency of decision-making units (DMU’s)1 in organizations. The most basic DEA model is CCR based on Charnes, Cooper & Rhodes (1978) which have constant returns to scale; however there is also DEA models which address varying returns to scale known as BCC based on Banker, Charnes and Cooper (1984) [11].
DEA has been applied for both production and cost data [12]. By using the selected input and output variables, DEA software finds for the points with the lowest input value for any given output, connecting those points to form the efficiency frontier. The utility which is not on the frontier is considered to be inefficient. A numerical coefficient is given to each firm, defining its relative efficiency. This method can easily accommodate a multiplicity of inputs and outputs. This method is also useful because returns to scale is taken into consideration in calculating efficiency, thus allowing for the concept of increasing or decreasing efficiency based on size and output levels.
The most important job in this efficiency analysis is the right selection of inputs and outputs. No universally applicable rational template is available for selection of variables [13]. An inherent assumption in DEA is that there is some relationship between the input and the output. Correlation is a statistical test which enables us to investigate for a statistical relationship between two variables. Input variables chosen for DEA model are: total cost in Rs. Crores and the outputs are units generated (GWh) and energy sold (GWh), their correlation is shown in Table 1.
3.1. DEA Models
There can be two DEA models: CCR and BCC model and both of these models are applied in this analysis.
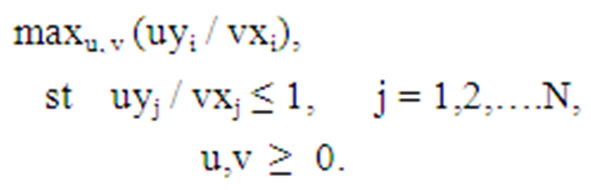
1) CCR model The CCR model was suggested by Charnes et al. (1978), and hence is named as CCR model and assumes constant returns to scale (CRS) assumption. If assuming data on K inputs and M outputs for each of N firms, then for the i-th firm these are represented by the column vectors xi and yi respectively. The K × N input matrix, X, and the M × N output matrix, Y, represent the data for all N firms. A measure of the ratio of all outputs over all inputs would be obtained for each firm, such as uyi / vxi, where u is an M × 1 vector of output weights and v is a K × 1 vector of input weights [14]. The optimal weights are obtained by solving the mathematical programming problem:
 (1)
(1)
It is required to calculate values of u and v, such that the efficiency measure for the i-th firm is maximized, subject to the constraints that all efficiency measures must be less than or equal to one. The difficulty in this ratio formulation is that it has an infinite number of solutions. This can be avoided by imposing the constraint vxi = 1, which provides:
 (2)
(2)
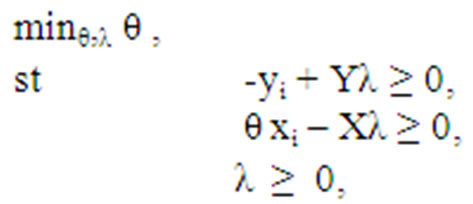
where the notation is changed from u and v to µ and v, to stress that this is a different linear programming problem. Equation (2) is known as the multiplier form of the DEA linear programming problem. By the duality in linear programming, equivalent envelopment form of this problem can be derived as:
 (3)
(3)
where θ is a scalar and λ is a N × 1 vector of constants. The efficiency score for the i-th firm will be the value of θ According to the Farell (1957) definition, it will satisfy: θ ≤ 1, with a value of 1 indicating a point on the frontier and hence the firm is technically efficient firm.
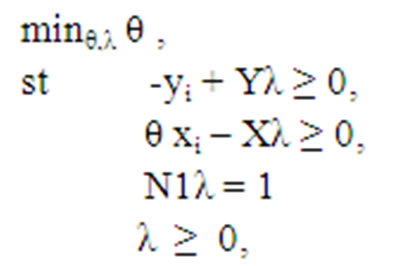
2) BCC Model BCC model was suggested by Banker, Charnes and Cooper (1984) investigates whether the performance of each DMU was conducted in region of increasing, constant or decreasing returns to scale in multiple outputs and multiple inputs situations. The CCR efficiency can be decomposed into the pure technical and scale efficiency components by this BCC model, thus investigating the scale effects [15]. According to this model an inefficient firm is only “benchmarked” against firms of a similar size.
The CRS linear programming problem can be easily modified to account for VRS by adding the convexity constraint: N1λ = 1 to (3) to provide:
 (4)
(4)
where N1 is an N × 1 vector of ones. This approach forms a convex hull of interesting planes which envelope the data points more tightly than the CRS conical hull and thus provides technical efficiency scores which are greater than or equal to those obtained using the CRS model. The VRS specification has been the most commonly used specification in the 1990s.
3.2. DEA Variables
The most important job in this efficiency analysis is the right selection of inputs and outputs. No universally applicable rational template is available for selection of variables [16-17]. An inherent assumption in DEA is that there is some relationship between the input and the outpu t. Correlation is a statistical test which enables us to investigate for a statistical relationship between two variables. Input variables chosen for DEA model are: total cost in Rs. Crores and the outputs are units generated (GWh) and energy sold (GWh) and input output correlation has been shown in Table 1. Total cost (Totex), which represents the cost incurred by the utility to supply electricity to the ultimate consumers. The components considered for calculating the total cost are: cost of the fuel, operating and maintenance cost (O & M), administrative and general cost (A & G), interest payment liability, depreciation and the cost of power purchase.
3.3. Orientation
Efficiency can be evaluated either on an input-oriented or output-oriented basis. For this paper, an input-oriented or input-minimizing approach has been selected since the purpose of the analysis was to suggest benchmarks for efficiency and reduction of cost input chosen in order to produce a given output.
3.4. Data Collection
Data was collected for 30 SOEUs in which 8 entities were the State Electricity Boards (SEBs), 7 entities comprised various electricity or power departments (PDs), and 15 entities comprised the unbundled SOEUs. The physical data for various states were obtained for the different years from “General Review 2009” published by CEA [18]. The cost data were taken from the “Power Finance Corporation” report 2005-2006 to 2007-2008 [19]. Descriptive statistics of the data for year 2007-2008 is presented in Table 2 in the form of mean, median, standard deviation, minimum and maximum values.
4. Result & Analysis
4.1. Overall Efficiency Scores
The overall efficiency is measured by CCR model with
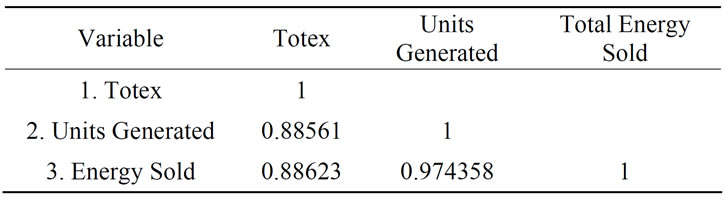
Table 1. Input/output correlations.

Table 2. Descriptive statistics.
CRS assumption. The results are presented in Table 4. It is evident from Table 4 that the utilities display significant variations in efficiency levels. The total efficiency had a mean score of 46 % for all the utilities and nearly twothird of utilities lie below this average value. Only three generation companies (Himachal Pradesh - HPSEB, Jammu & Kashmir - J & K SEB and Puducherry-PCL) turned out to be the best practices and the remaining 27 utilities exhibited varying degree of inefficiencies. With the exception of the best practices and eight utilities - Sikkim, Assam - APGCL, Manipur, Meghalaya, Nagaland, Tripura, Arunachal Pradesh and Mizoram, exhibited decreasing returns to scale suggesting that these utilities exceeded their most productive scale size. This outcome supports the unbundling policy of the GoI, as envisaged in the Electricity Act. Five Utilities –Sikkim PD, APGCL, Manipur PD, Arunachal Pradesh (PD) and Mizoram (PD), exhibited increasing returns to scale, which indicates that these utilities are smaller than the most productive scale size.
4.2. Calculation of Scale Efficiency
The scale efficiency is calculated by the BCC formulation that assumes a VRS by taking into consideration the sizes of utilities. This formulation ensures that similar sized utilities are benchmarked and compared with each other [20-21]. In this model the total efficiency is decomposed into pure technical and scale efficiency. The scale efficiency is given by the ratio of CRS efficiency (overall efficiency) to VRS efficiency (pure technical efficiency). The results are presented in Table 3. In BCC model, the number of utilities that appear as efficient increased to 11, while remaining 19 utilities showed inefficiencies. The average technical efficiency is 75.1%. The results indicate the possibility of restructuring of several utilities that display low scale efficiencies.
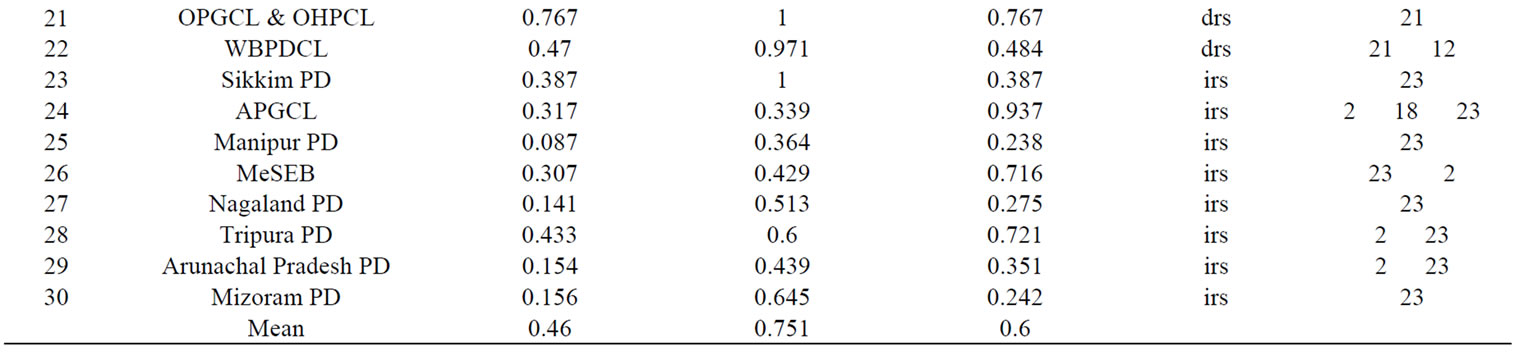
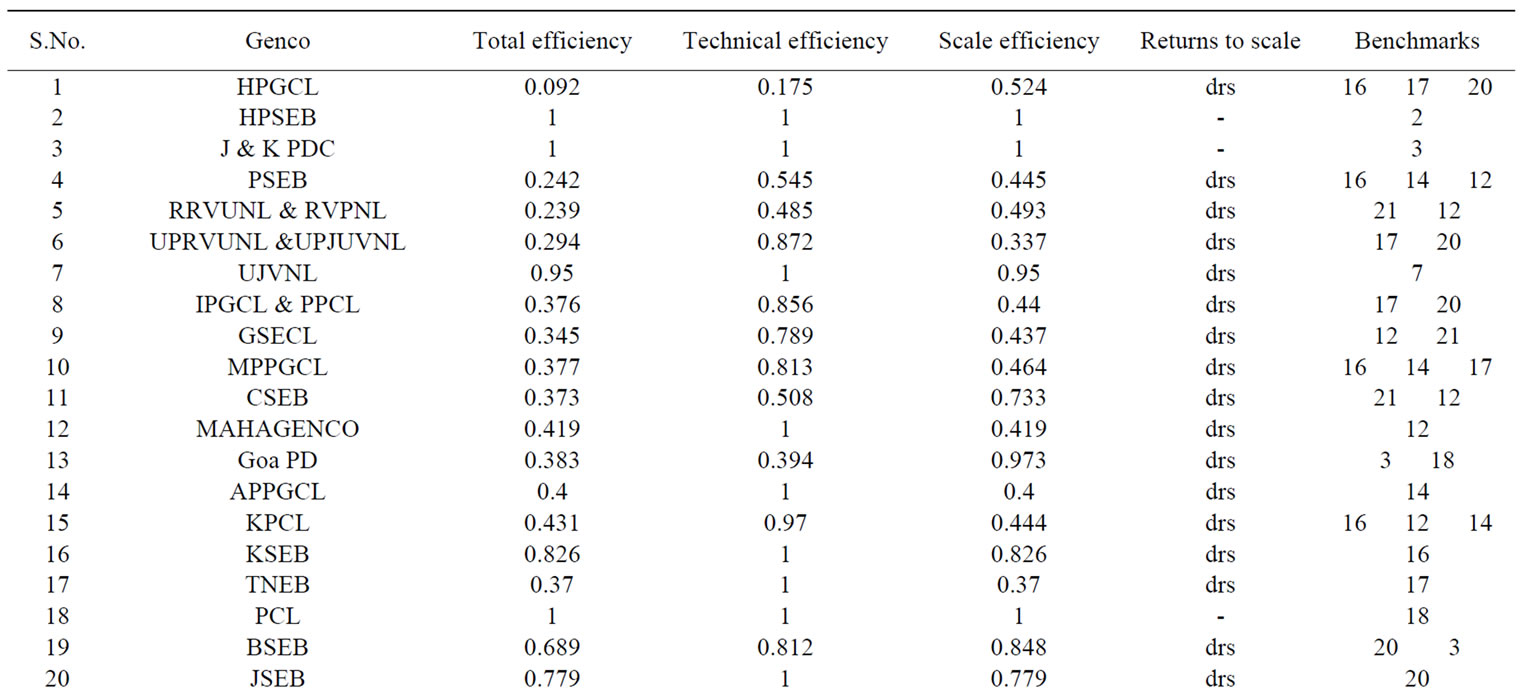
Table 3. Results of CCR and BCC model.

Table 4. Input cost target values.
4.3. Benchmarking
Benchmarking is the process of creating a standard/best practice against which the performance of utility can be measured [22]. For every inefficient DMU, DEA identifies a set of corresponding efficient units that can be utilized as benchmarks for improvement. The benchmarks for inefficient utilities are shown in Table 3. For example the benchmarks for Haryana (HPGCL) are Kerala SEB, Tamil Nadu (TNSEB) and Jharkhand (JSEB). This inefficient utility will be benchmarked or compared against these three efficient utilities.
4.4. Input Cost Target Values
For each inefficient utility target value for input variable is calculated so as to make them efficient and shown in the Table 4. The input cost target values for most of the utilities is lower than their actual values. In the case of HPGCL, the input cost should be reduced by 82% to make it technically efficient. The mean technical efficiency of all the utilities is 75.1% which means utilities could reduce their inputs by 24.9% without reducing their outputs.
4.5. Cost Savings
The mean technical efficiency of all the utilities is 75.1% which means utilities could reduce their inputs by 24.9% without reducing their outputs. That means by cost benchmarking the utilities we can have the cost reduction by nearly 25% with the same output. For the case of generation company of Haryana (HPGCL), the input cost is 7104 Rs crores, so on an average we can reduce its cost by 25% which is a huge money saving which can be utilize by this utility for further generation.
5. Conclusions
The cost benchmarking has been carried out so that cost controls can be implemented. This analysis would be useful for the regulators in decreasing the electricity price and offer valuable lessons to ensure that the new structure being adopted is better than the regulatory and legislative framework designed a few decades back. The results show that the total generation cost reduction can be 25% with the same output of energy generated, as the mean technical efficiency is nearly 75%. The mean overall efficiency is 46%. The numbers of GENCOs that appear as efficient entities are 3 in case of CRS while under VRS condition, it increased to 11. In addition to this, for each inefficient GENCO target value for input cost is calculated so as to make them efficient. Himachal Pradesh (HPSEB), Jammu & Kashmir (J & K SEB) and Puducherry (PCL) display the best performance. This efficiency measurement assists the companies by identifying their shortcomings, setting targets and trying to achieve the set targets.
6. References
[1] K. Sarica and I. Or, “Efficiency Assessment of Turkish Power Plants Using Data Envelopment Analysis,” Energy policy, Vol. 32, No. 8, 2007, pp. 1484-1499.
[2] A. Charnes, W. W. Cooper and E. Rhodes, “Measuring the Efficiency of Decision Making Units,” European Journal of Operational Research, Vol. 2, No. 6, 1978, pp. 429-444.
[3] B. Golany, Y. Roll and D. Rybak, “Measuring Efficiency of Power Plants in Israel by Data Envelopment Analysis,” IEEE Transactions on Engineering Management, Vol. 41, No. 3, 1994, pp. 291-301.
[4] K. P. Kannan and N. V. Pillai, “Plight of the Power Sector in India: SEBs and Their Saga of Inefficiency,” Centre for Development Studies, Thiruvananthapuram, Working Paper, No. 308, 2000.
[5] V. K. Yadav, N. P. Padhy and H. O. Gupta, “Assessing the Performance of Electric Utilities of Developing Countries: An Inter Country Comparison Using DEA,” Power and Energy General Meeting, No. 308, November 2000, pp. 1-87.
[6] “Ministry of Power”. http://www.powermin.nic.in
[7] T. Thakur, “Benchmarking Study for the Indian Electric Utilities Data Envelopment Analysis,” IEEE Transactions on Power Systems, 2005, pp. 545-549.
[8] D. K. Jha and R. Shrestha, “Measuring Efficiency of Hydropower Plants in Nepal Using Data Envelopment Analysis,” IEEE Transactions on Power Systems, Vol. 21, No. 4, November 2006, pp. 1502-1511.
[9] M. Saleem, “Technical Efficiency in Electricity Sector of Pakistan - The Impact of Private and Public Ownership,” 2007. http://www.pide.org.pk
[10] T. Thakur, S. G. Deshmukh, S. C. Kaushik and M. Kulshrestha, “Impact Assessment of the Electricity Act 2003 on the Indian Power Sector,” Energy Policy, vol. 33, no. 9, 2005, pp. 1187-1198.
[11] T. Coelli, D. S. P. Rao and G. E. Battese, “An Introduction to Efficiency and Productivity Analysis,” 2nd Edition, Springer, New York, 2005.
[12] R. F. Lovado, “Benchmarking the Efficiency of Philippines Electric Cooperatives Using Stochastic Frontier Analysis and Data Envelopment Analysis,” 3rd East West Center International Graduate Student Conference, Hawaii, 2004.
[13] T. Thakur, S. G. Deshmukh, S. C. Kaushik and M. Kulshrestha, “Impact Assessment of the Electricity Act 2003 on the Indian Power Sector,” Energy Policy, vol. 33, no. 9, 2005, pp. 1187-1198.
[14] W. W. Cooper and K. Tone, “Measures of Inefficiency in Data Envelopment Analysis and Stochastic Frontier Estimation,” European Journal of Operational Research, Vol. 99, 1997, pp. 72-88.
[15] D. K. Jha, N. Yorino and Y. Zoka, “A Modified DEA Model for Benchmarking of Hydropower Plants,” Power Technology, July 2007, pp. 1374-1379.
[16] A. Vaninsky, “Efficiency of Electric Power Generation in the United States: Analysis and Forecast Based on Data Envelopment Analysis,” Energy Economics, vol. 28, 2006, pp. 326-338.
[17] R. Meenakumari and N. Kamraj, “Measurement of Relative Efficiency of State Owned Electric Utilities in India Using Data Envelopment analysis,” Modern Applied Science, vol. 2, no. 5, September 2008, pp. 61-71.
[18] CEA, “All India Electricity Statistics, General Review 2009,” Central Electricity Authority, New Delhi, 2009, pp. 1-235.
[19] “Report on the Performance of the State Power Utilities for the Years 2005-06 to 2007-08,” Power Finance Corporation Ltd., New Delhi.
[20] M. Abbott, “The Productivity and Efficiency of the Australian Electricity Supply Industry,” Energy Economics, Vol. 28, 2006, pp. 444-338.
[21] A. Pahwa, X. Feng and D. Lubkeman, “Performance Evaluation of Electric Distribution Utilities Based on Data Envelopment Analysis,” IEEE Transactions on Power Systems, Vol. 18, no. 1, February 2003, pp. 400- 405.
[22] P. Chitkara, “A Data Envelopment Analysis Approach to Evaluation of Operational Inefficiencies in Power Generating Units: A Case Study of Indian Power Plants,” IEEE Transactions on Power Systems, Vol. 14, no. 2, May 1999, pp. 419-425.
NOTES
1DMU is a distinct unit within an organization that has flexibility with respect to some of the decisions it makes, but not necessarily completes freedom with respect to these decisions. Banks, police stations, hospitals, tax offices, prisons, defense bases (army, navy, and air force), schools and university departments, are examples of such units to which DEA has been applied.