Journal of Electromagnetic Analysis and Applications
Vol.4 No.11(2012), Article ID:24383,4 pages DOI:10.4236/jemaa.2012.411060
Comparison between Conventional Convective Heating and Microwave Heating: An FTIR Spectroscopy Study of the Effects of Microwave Oven Cooking of Bovine Breast Meat
![]()
Department of Physics, University of Messina, Messina, Italy.
Email: e.calabro@yahoo.com
Received September 12th, 2012; revised October 10th, 2012; accepted October 20th, 2012
Keywords: Convective Heating; Microwave Oven; FTIR Spectroscopy; Amide I Region; Bovine Breast Meat
ABSTRACT
The effects of microwave energy and conventional convective heating on bovine meat were studied in the mid-infrared region by FTIR spectroscopy, to highlight the differences between the two cooking methods. Samples of 100 g of bovine breast meat were cooked using three treatments: heating in a conventional electric oven at the temperature of 165˚C for 16 min, heating in a microwave oven at 800 W for 95 sec, and heating in the same microwave oven at 650 W for 160 sec. Significant decreases in intensity of vibration bands of CH2 methylene group at 1921 and 1853 cm–1 and of the carbonyl band at 1742 cm–1 were observed after microwave heating with respect to heating in a conventional oven, showing that Maillard reaction occurs partially using microwave oven. Spectral analysis in the amide I region after microwave cooking at 800 W for 95 sec showed that an increase in intensity occurred in the region from 1665 to 1690 cm–1 which can be attributed to β-turns, characteristic of disorder processes in the protein. Further analysis after microwave cooking at 650 W for 160 sec evidenced major increase in intensity of β-turns content and the appearance of significant increases of β-sheet component at 1635 cm–1 and 1695 cm–1 that can be attributed to aggregated β-sheets structures.
1. Introduction
The aims of cooking food are several. Cooking improves natural flavour and texture of food, improving its digestibility. Cooking food to a required temperature for a required time can destroy all harmful microorganisms in food. Nevertheless, quality of protein may be reduced due to destruction of certain aminoacids during cooking.
Indeed, many physical and chemical reactions occur during food preparation. These reactions are a result of the interaction between food components and the environmental conditions like heat, light, air and materials that are used during cooking process.
During cooking process, meat proteins denature producing structural changes in the meat, such as the destruction of cell membranes, shrinkage of meat fibers and the aggregation and formation of myofibrilar [1]. In fact, nutritional properties of the meat products depend heavily on the method of cooking, determining its compositional attributes such as appearance, flavour and juiciness of the meat product. Also, fat imparts a better texture, juiciness and flavour to the meat products [2].
Cooking process in a conventional oven consists of heating food by surrounding hot air, which is heated by a source of heat either electricity or gas.
The physical processes of heat transfer in a conventional oven are represented by radiation from the source of heat to the metal wall at the base of the oven, by conduction from the base to the other walls and by convection through the heated air currents set up in the oven to the food.
Generally, the temperatures that are used in a oven range from 130˚C to 250˚C.
The properties of meat can change if cooking occurs preheating the oven or using a composition of cooking at different temperatures. For instance, [3] showed that the fat in meat can be reduced cooking meat at low temperature and successively at high temperature for a short time.
However, conventional cooking of meat in a oven is generally done maintaining the same one temperature (for instance 160˚C) or starting with a high temperature (such as 250˚C) and then reducing to a lower temperature (150˚C) [4,5].
The domestic use of microwave-oven for cooking occurred during the 1970s and 1980s as a result of Japanese technology transfer and global marketing [6]. The microwave-oven utilizes microwave (MW) energy to cook food as well as forced-air convection heat of a conventional oven.
The working principle of a microwave oven is represented by a power source (the magnetron) emitting MWs that are absorbed by the food that is cooked in the microwave oven. The electromagnetic field (EMF) generated inside the microwave oven produces rotation and collision of polar molecules such water and ions inside the food.
The main molecular dipole inside the food is represented by water molecules that will rotate very rapidly in food (about 2450 million times a second) following the frequency of MWs, causing frictions that generate heat and leading to temperature rise. Ionic compounds in food can be accelerated by the EMF colliding with other molecules and disrupting hydrogen bonds with water generating additional heat [7,8]. Indeed, water and salt are the two major ingredients that influence dielectric properties of food.
Penetration and heating of foods by microwave energy sources are instantaneous, whereas conventional heating in a oven transfers thermal energy from food surface toward its center much slower, because the low conductivity of food material.
Some author reported that meat cooked in microwaveoven can provide a product comparable to oven preparation [9]. In contrast, other authors reported that the aroma and flavour of hot air oven cooked products are better and more acceptable as compared to microwave oven cooked products [10].
Nevertheless, although microwave-oven is widely used as a means of food preparation, insufficient information is available on the consequences of microwave heating on the composition and nutritional quality of the food. For instance, some studies revealed that microwave heating affect fat oxidation and fatty acid isomer formations [11-14].
Otherwise, previous literature showed that the effects of heat processing on protein value, utilization and availability are equivocal [15].
Therefore, the aim of this study was to investigate the effects of microwave-oven cooking on meat using Fourier Transform Infrared (FTIR) spectroscopy, comparing the results with conventional convective heating.
Indeed, FTIR spectroscopy has been used in studies regarding the analysis of the major components of milk, fat and protein composition of meats, and carbohydrates in cereal samples [16-18].
2. Materials and Methods
2.1. Breast Meat Samples
Bovine breast meat were collected from three different commercial processing plants, packed on ice, and transported to the laboratory.
The internal temperature of the bovine breast meat was about 4˚C before treatment.
Bovine breast meat were minced using a plate with 6 mm holes to obtain a more uniform cooking inside meat samples. Also, minced meat was divided into portions of 100 g each with a thickness of about 5 mm to allow a quick cooking in the ovens.
Meat samples were cooked immediately without any additional treatment.
2.2. Experimental Design
A set of meat samples, prepared as above explained, was inserted in a conventional electric oven Indesit Mod. KG 8414 XES/I. Cooking began with preheating the oven at the temperature of 165˚C; meat was cooked for 16 min at this temperature and a thermocouple was used for temperature control.
Other meat samples were subjected to heating in a domestic microwave oven model Whirlpool AVM 541/WP/ WH.
Measurements of the power density emitted during microwave oven cooking were performed using a Narda SRM 3000. Two peaks around 2440 and 2481 MHz appeared in the spectrum analysis during microwave oven cooking as represented in Figure 1. The integrated value of the power density in the range 2350 - 2550 MHz amounted to 217 mW/m2.
Some samples were subjected to heating in the microwave oven at the power level of 800 W for 95 sec, and other samples were heated in the same microwave oven at the power level 650 W for 160 sec.
After cooking the meat samples were removed from the ovens, homogenized, stored in sterile jars and immediately subjected to the following assays.
2.3. Infrared Spectroscopy
FTIR absorption spectra were recorded at room temperature of 20˚C by a spectrometer Vertex 80 v of Bruker Optics.
Breast meat samples of 10 mg (cooked as above exposed) were placed between a pair of CaF2 windows. For each spectrum 64 interferograms were collected and coadded by Fourier transformed employing a Happ-Genzel apodization function to generate a spectrum with a spectral resolution of 4 cm–1 in the range from 7000 cm–1 to 1000 cm–1. Each measure was performed under vacuum
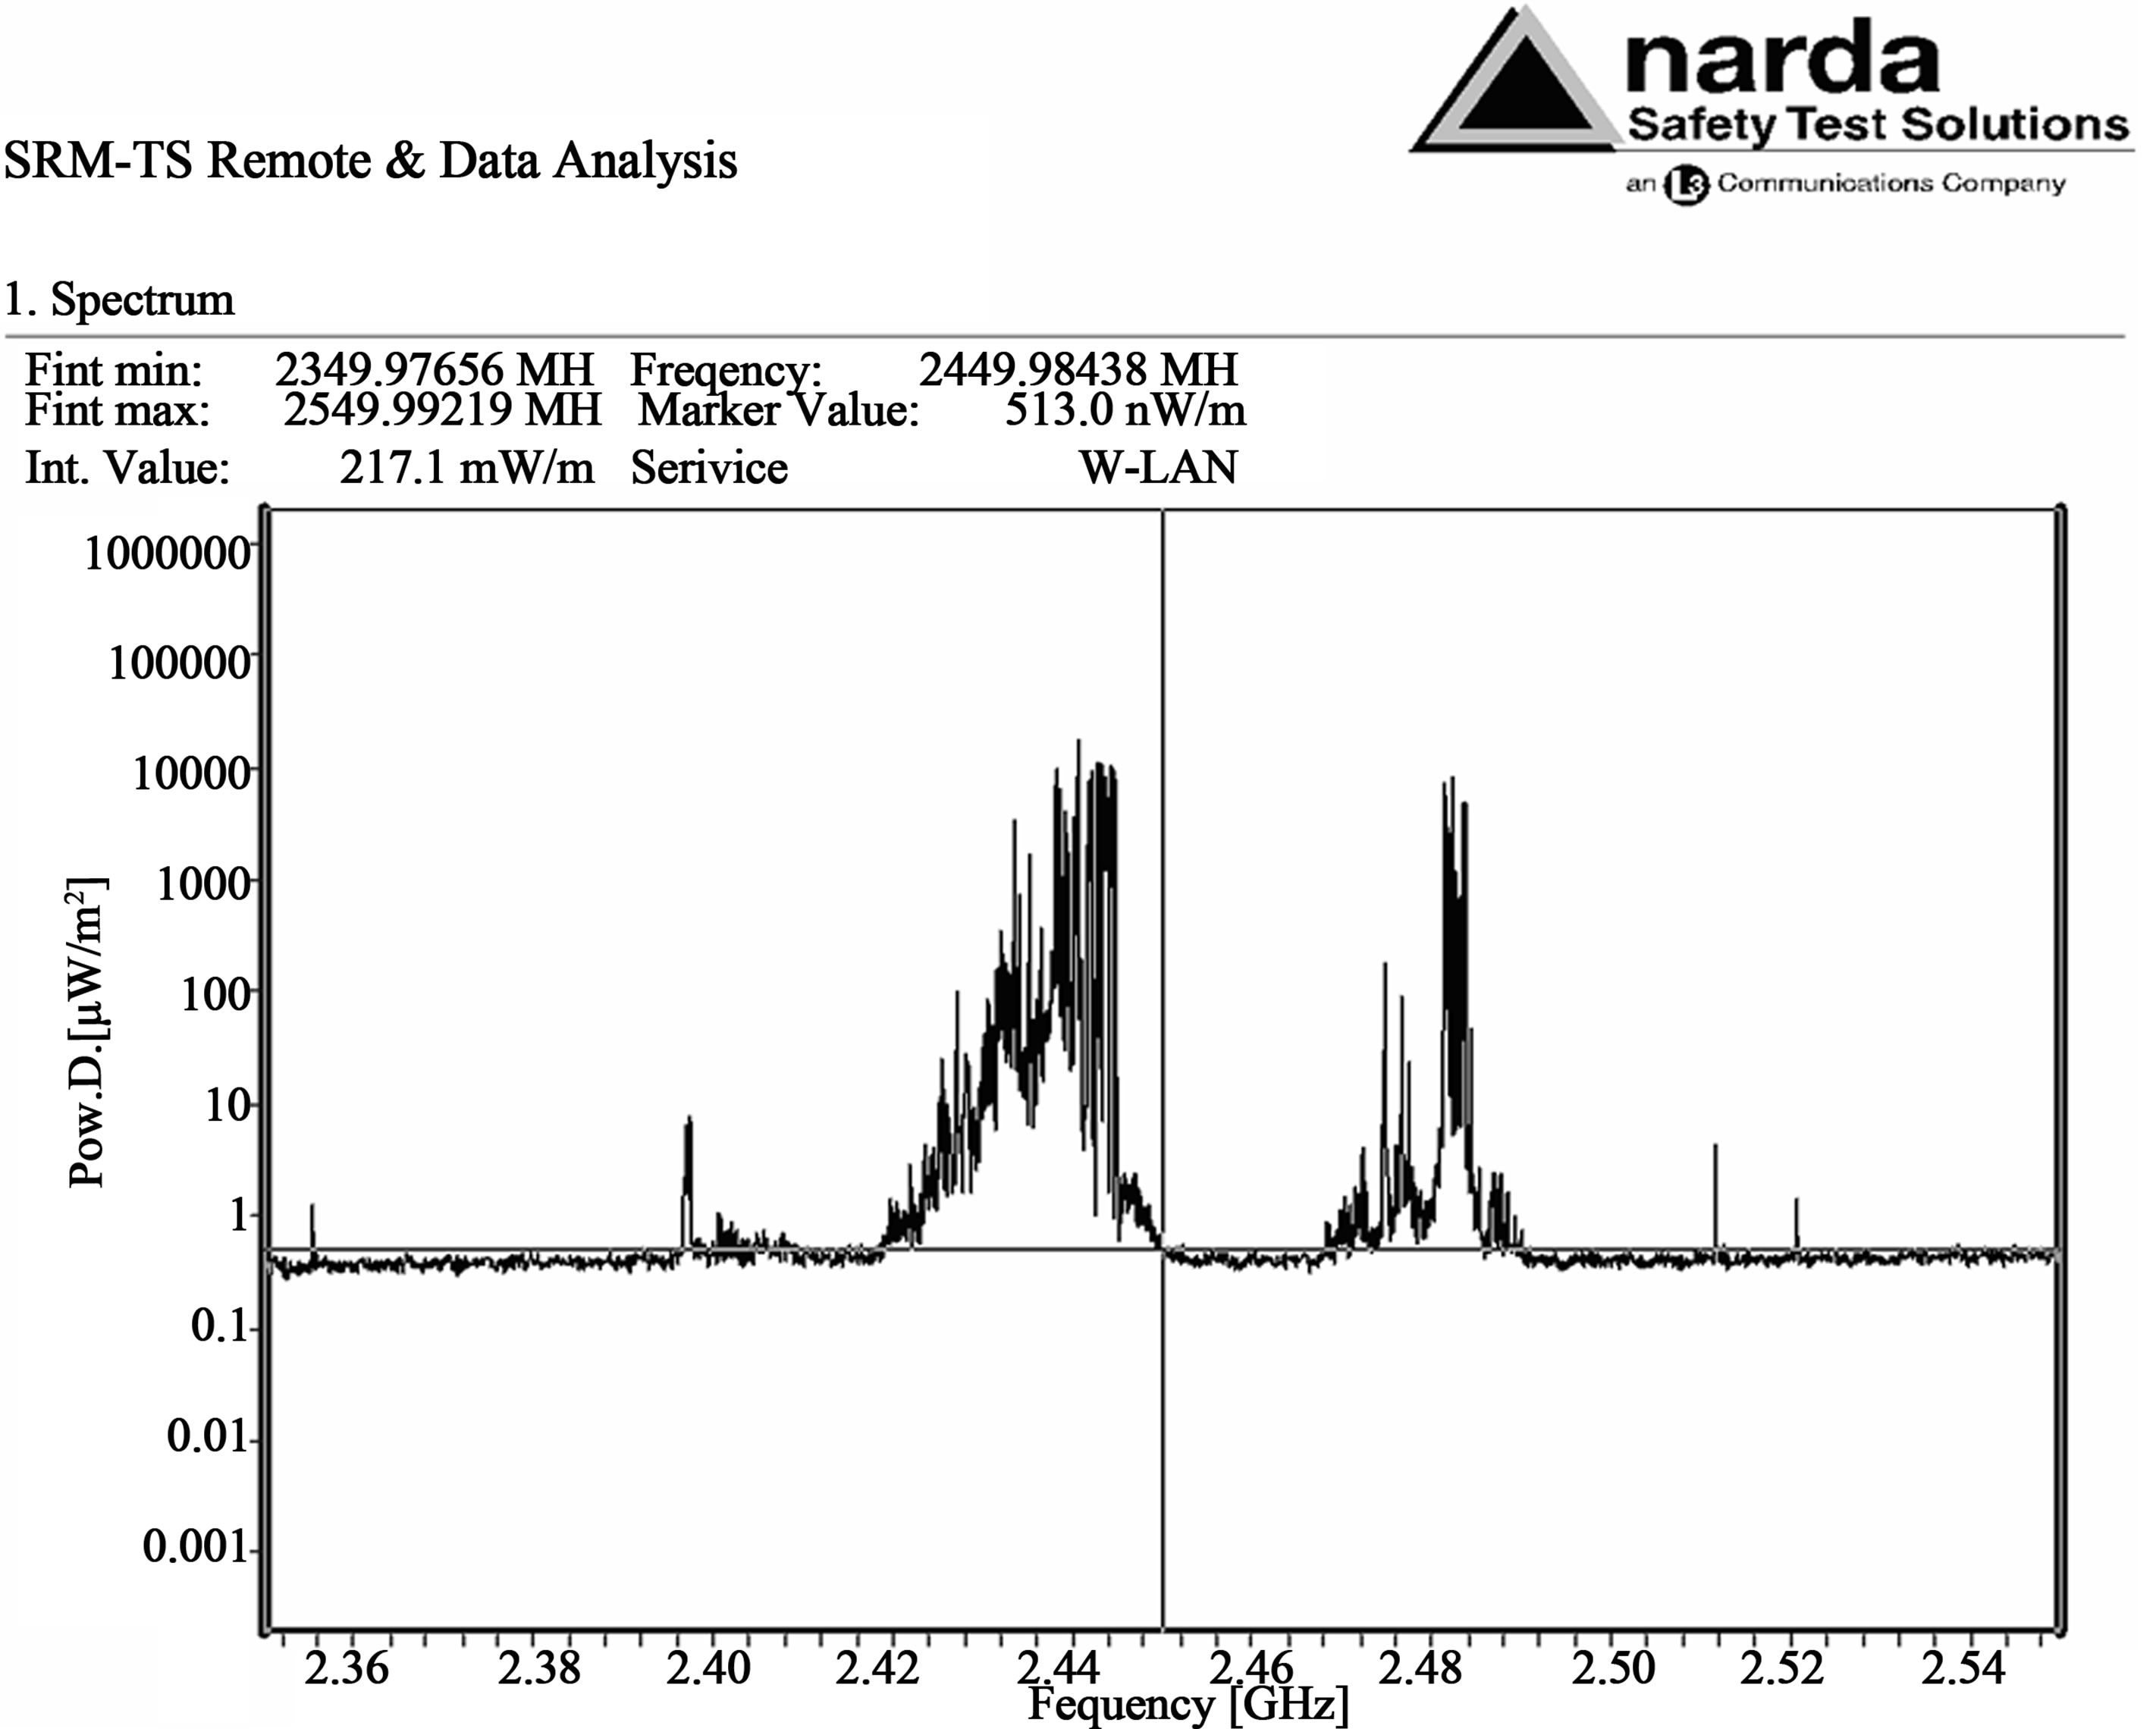
Figure 1. The spectrum analysis performed by a Narda SRM 3000 in the range 2350 - 2550 MHz of the power density levels related to MWs generated by a microwave oven Whirlpool Model AVM 541/WP/WH during bovine breast meat cooking, acquired at 25 cm from the door of the oven.
to eliminated minor spectral contributions due to residual water vapor. However, smoothing correction for atmospheric water background was performed and IR spectra were baseline corrected and area normalized.
In addition, vector normalization was used, calculating the average value of the spectrum and subtracting from the spectrum decreasing the mid-spectrum. The sum of the squares of all values was calculated and the spectrum divided by the square root of this sum.
The automatic baseline scattering correction function was used to subtract baselines from spectra, which allows to get spectra with band edges of up to the theoretical baseline.
Interactive baseline rubberband correction was used. This method also uses a rubberband which is stretched from one spectrum end to the other, and the band is pressed onto the spectrum from the bottom up with varying intensity. This method performs iteratively, depending on the number of iterations in the algorithm and the baseline as a frequency polygon consisting of n baseline points. The result spectrum will be the original spectrum less the baselines points manually set and a subsequent concave rubberband correction. We used the default value of n = 64 baseline points and 40 iterations.
FTIR spectra were smoothed by Loess algorithm and the deconvolved spectra, fitted with Gaussian band profiles. Initial values for the peak heights and widths were estimated from the deconvolved spectra.
In order to enhance the fine spectral structure, the Fourier self deconvolution (FSD) technique was used. The concept of FSD is based on the assumption that a spectrum of single narrow bands is broadened in the liquid or solid state and cannot be distinguished in the amide envelope. A curve fitting procedure can be applied to estimate quantitatively the area of each component representing a type of secondary structure [19].
3. Results and Discussion
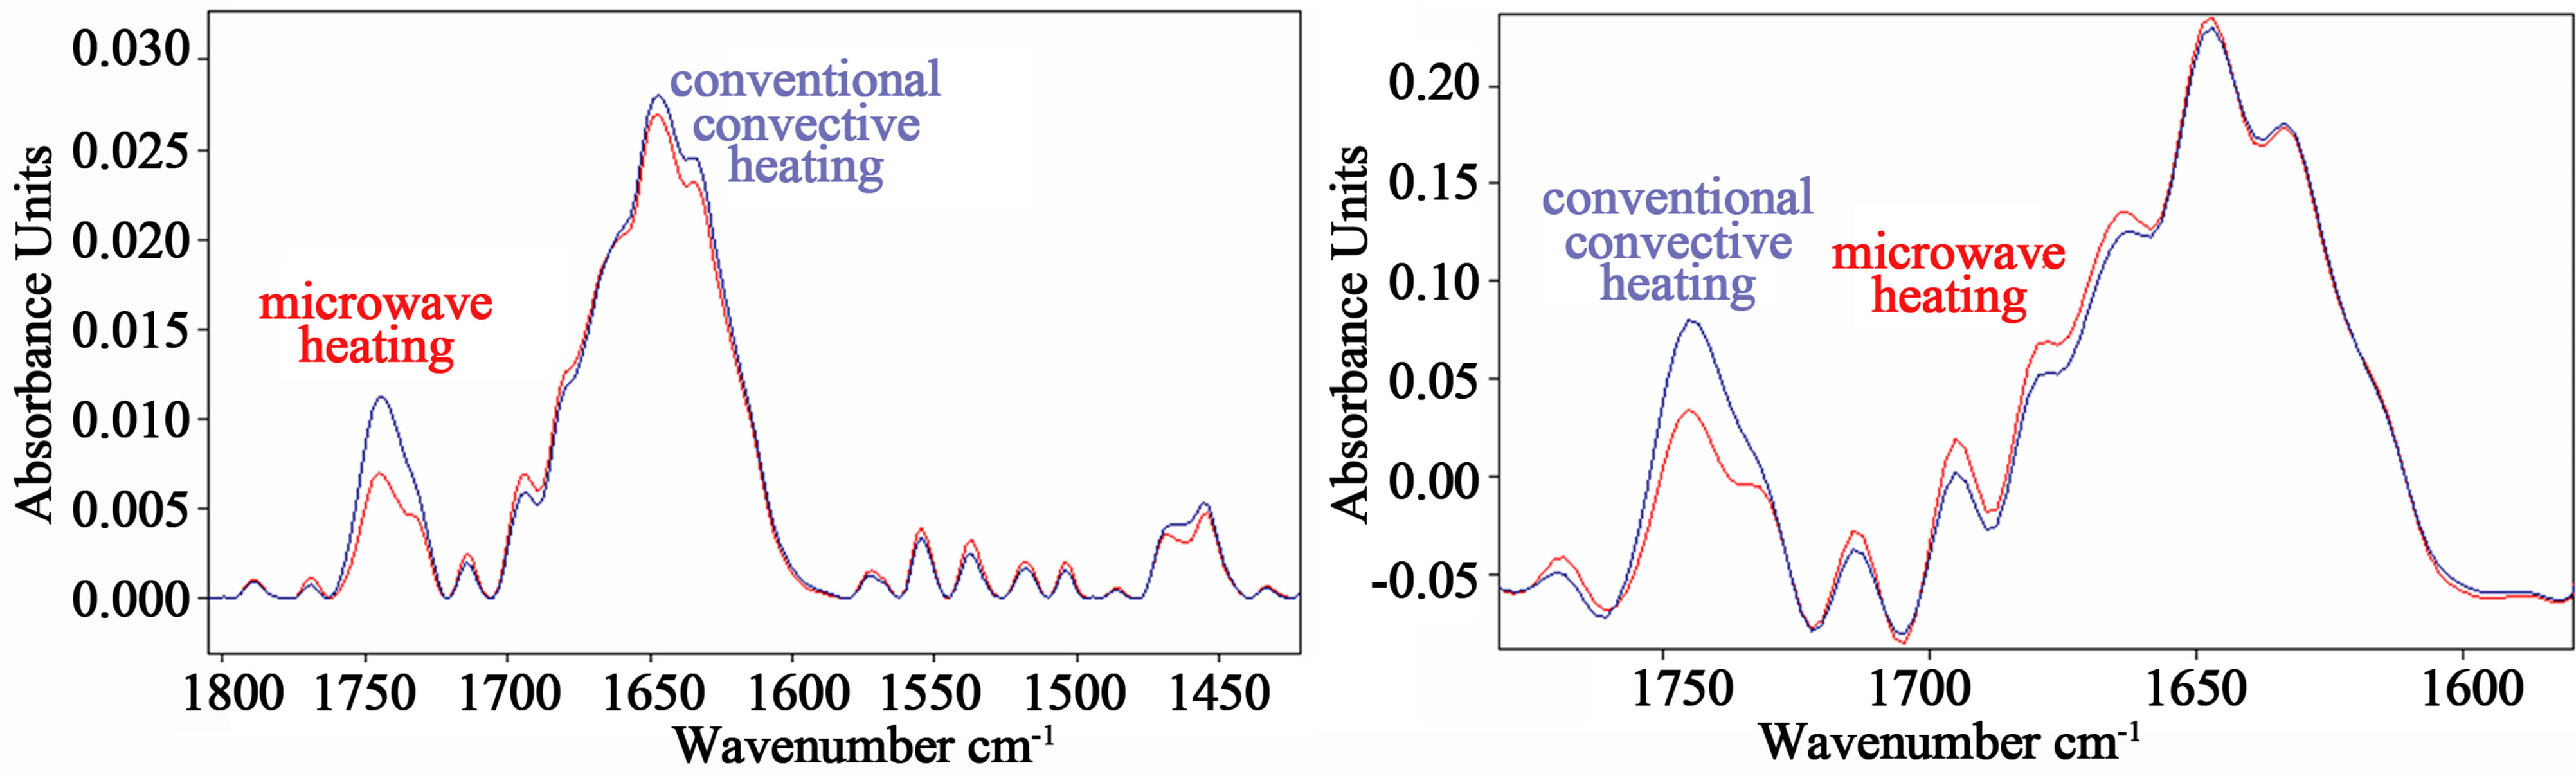
Figure 2(a) shows two typical FTIR spectra in the range 1800 - 1400 cm–1 from bovine meat cooked in a conventional electric oven at the temperature of 165˚C and in a microwave oven at the power of 800 W.
Comparison of the spectra in the range 1750 - 1600 cm–1 reveals that the major changes upon conventional heat treatment occur around 1740 cm–1, where a broad band can be observed in the spectrum from breast meat cooked in the conventional oven, whereas this band appeared less prominent for meat samples cooked in the microwave oven at 800 W for 95 sec. This band can be assigned to the C=O mode of the first alkyl chain with a trans-conformation in the C-C bond adjacent to the ester grouping, representative of triglycerides content [20].
 (a) (b)
Figure 2. (a) Two typical FTIR spectra in the range 1800 - 1400 cm–1 from bovine meat cooked in a conventional electric oven at the temperature of 165˚C and in a microwave oven at the power of 800 W; (b) Fourier self-deconvolution application to highlight the increase in intensity for meat sample spectra from the microwave oven cooking in the region 1665 - 1690 cm–1, that can be attributed to β-turns, characteristic of disorder processes in the protein. Red lines refer to spectra of meat sample cooked in microwave oven.
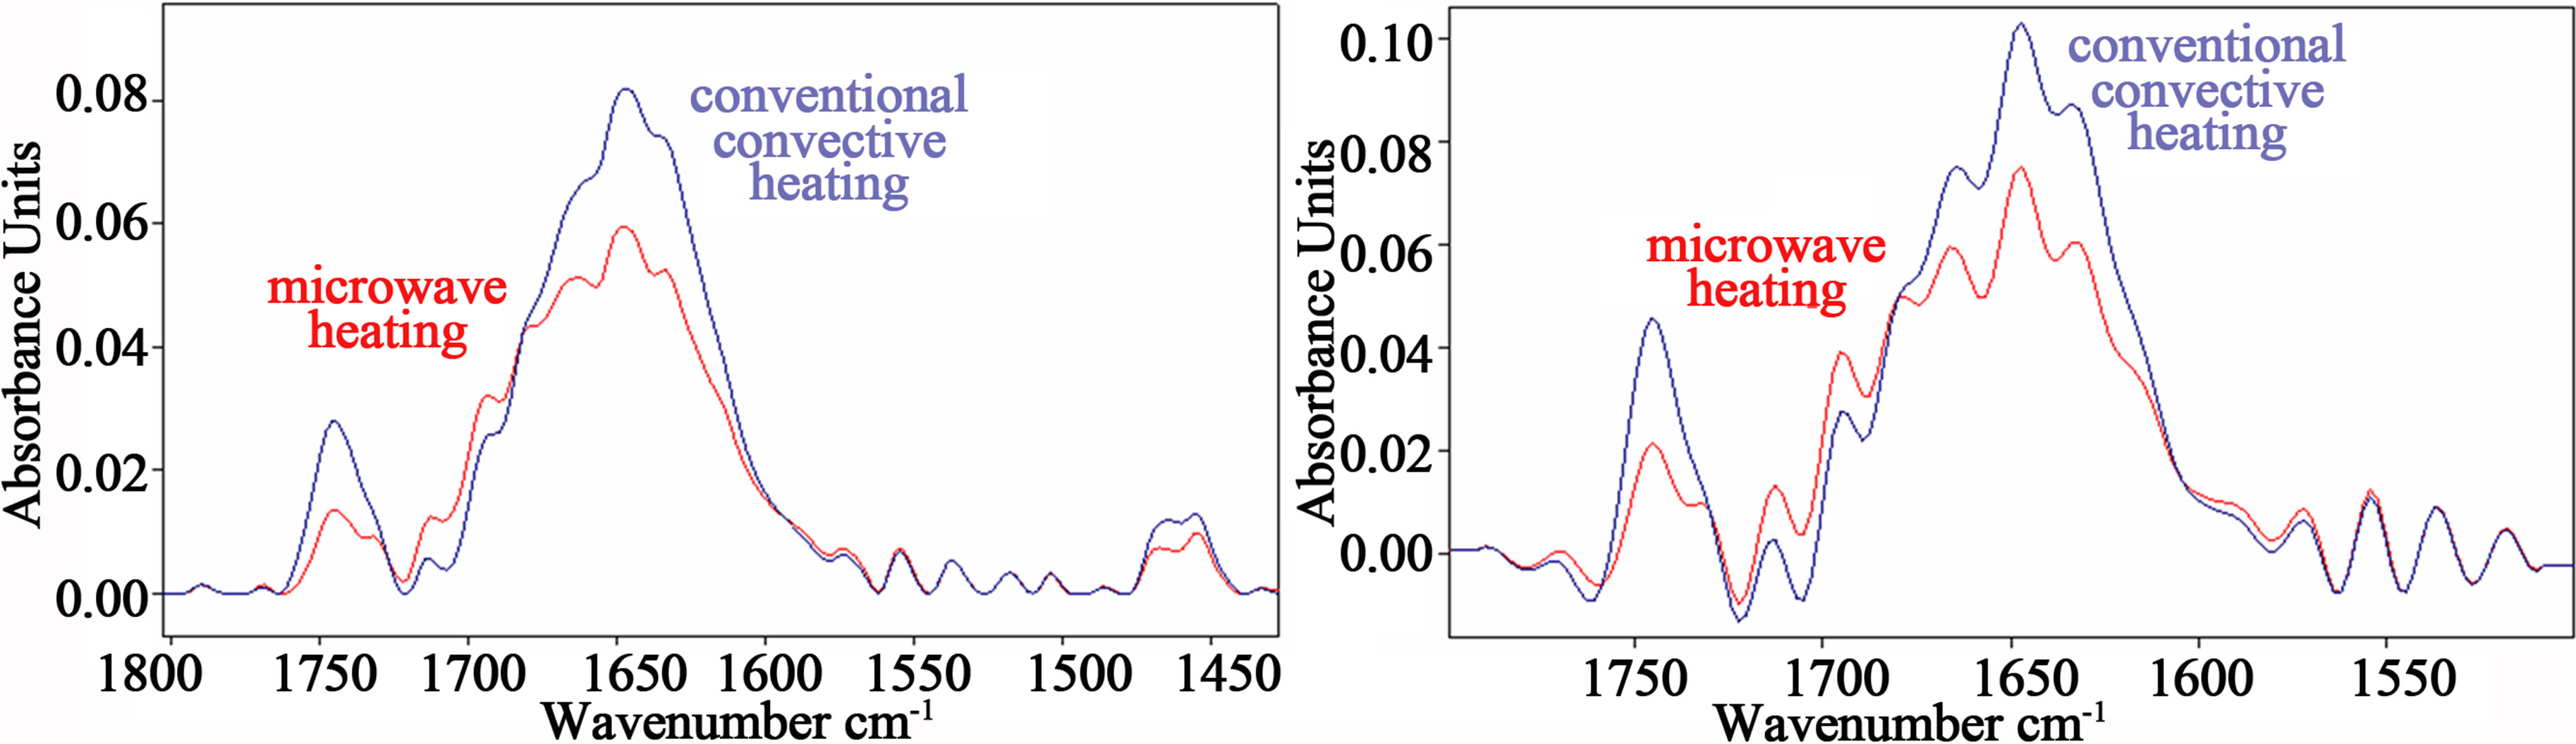
The decrease of the carbonyl band intensity after microwave oven cooking with respect to conventional cooking appeared more evident using a power level of 650 W for 160 sec, as can be observed in Figure 3(a).
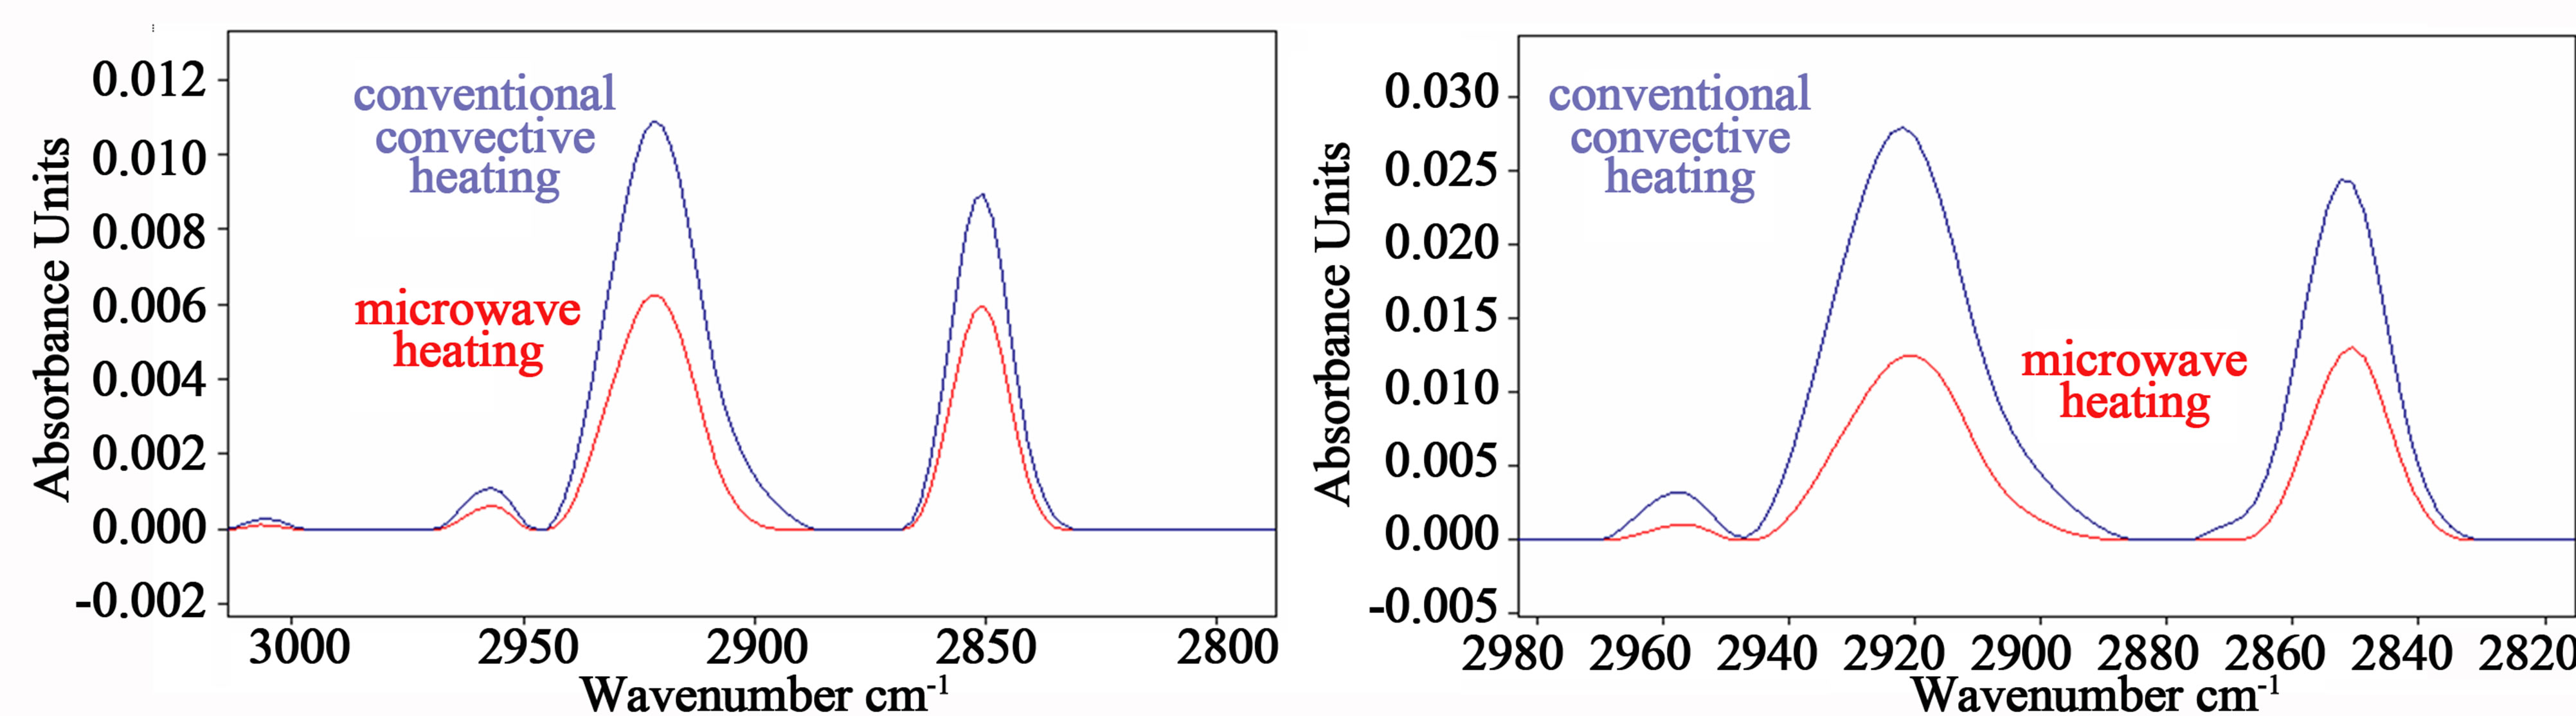
The most intense vibrations in the infrared spectra of lipid systems are the CH2 stretching vibrations and these give rise to bands in the 3000 to 2800 cm−1 region, represented in Figure 4.
In this region symmetric and asymmetric CH2 and CH3 stretching vibrations are observed, assigned to methylene and methyl group. The band close to 2960 originate from the asymmetric stretching νasCH3 of methyl groups, whereas vibration bands around 2921 and 2853 cm–1 are assigned to symmetric and asymmetric bending νsCH2 and νasCH2 of methylene, respectively [20,21].
Both bands of methylene group were clearly observed in spectra after cooking using the conventional electric oven, whereas their intensity after microwave oven cooking decreased in proportion to the cooking time, as can be observed in Figure 4 (red lines refer to spectra of meat sample cooked in microwave oven).
Applying a statistical analysis (t-test) to the integrated area of νsCH2 stretching vibration bands of different spectra, it was found that their intensity after microwave oven cooking were significantly decreased in comparison to the intensity after conventional oven cooking (p < 0.01).
The increase in intensity of the carbonyl band at 1742 cm–1 and of the methylene group after meat cooking in the conventional oven can be attributed to Maillard reaction.
This reaction is one of the important consequences of the thermal processing of foods represented by a series of reactions which are initiated by the interaction between the carbonyl group of a reducing sugar and a free amino group of an aminoacid or a protein, producing the formation of brown pigments and numerous compounds responsible for browning, texture and flavor during baking and roasting by means of complex reactions [22].
Maillard reaction follows the formation of the initial intermediates, including Amadori and Heyn’s products among which there are CH2 and C=O compounds [23,24], explaining the relevant presence of their vibration bands in the spectra of meat sample cooked in the conventional oven. Conversely, the symmetric and asymmetric CH2 vibrations and the C=O carbonyl band at 1742 cm–1 were lower in intensity after meat cooking by microwave oven, showing that Maillard reaction occurs partially using this type of cooking.
Otherwise, this result is in agreement with the hypothesis that lipid oxidation occurs during microwave cooking, a result that was evidenced by [11-13] showing that heating of oil samples in microwave oven enhances lipid oxidation, and by [14] who observed that microwave heating milk causes a significant increase in the level of the cholesterol oxidation products.
However, the most prominent band in the bovine breast meat spectrum is the amide I band in the region between 1700 and 1500 cm–1, centered at 1648 cm–1, corresponding mainly to an α-helix structure content due to C=O stretching vibration and a N-H bending mode, and a low intensity amide II, coupling of the N-H bending and C-N stretching modes. These bands are related to proteins content, whose most representative component in meat is myoglobin. Indeed, it is an iron-oxygen-binding protein found in the muscle tissue of vertebrates which represents their myofiber.
The analysis of the typical spectra represented in
 (a) (b)
Figure 3. (a) Two representative FTIR spectra in the range 1800 - 1400 cm–1 from bovine meat cooked in a conventional electric oven at the temperature of 165˚C and in a microwave oven at the power of 650 W. The decrease of the carbonyl band intensity at 1740 cm–1 after microwave oven cooking appeared more evident using a power level of 650 W for 160 sec; (b) Fourier self-deconvolution analysis evidenced a relevant increase in intensity of β-turns content in amide I, and a significant increase of β-sheet component at 1635 cm–1 and 1695 cm–1 with respect to the α-helix structure, comparing microwave oven and conventional oven cooking spectra. Red lines refer to spectra of meat sample cooked in microwave oven.
 (a) (b)
Figure 4. Representative spectra in the infrared region from 3000 to 2800 cm−1. The band close to 2960 cm–1 originate from the asymmetric stretching νasCH3 of methyl groups, and the vibration bands at 2921 and 2853 cm–1 are assigned to symmetric and asymmetric bending νsCH2 and νasCH2 of methylene group, respectively. The intensities of both bands of methylene group were observed to decrease significantly after microwave oven cooking in proportion to the cooking time in comparison to conventional heating: the red spectra in (a) and in (b) correspond to microwave cooking of bovine meat for 95 sec and 160 sec, respectively.
Figures 2 and 3 showed that microwave oven cooking altered the amide I region. Otherwise, alterations of proteins secondary structure produced by exposure to mobile phone microwaves was evidenced [25-28].
Breast meat cooking in the microwave oven at the power level of 800 W for 95 sec produced low alterations in the amide I region, above all in the region from 1665 to 1695 cm–1 (see Figure 2(a)).
In order to enhance the fine spectral structure of amide I region, Fourier self-deconvolution (FSD) technique was applied using a Lorentzian shape, with bandwidth = 10.96, deconvolution factor = 2, noise reduction factor = 0.5.
The increase in intensity of meat sample spectra from the microwave oven cooking in the region 1665 - 1690 cm–1 was highlighted (see Figure 2(b)), that can be attributed to β-turns, characteristic of disorder processes in the protein [29,30].
As compared to the conventional cooked meat spectra, the analysis of meat sample spectra after cooking in the microwave oven at the power of 650 W for a longer time (160 sec) revealed more dramatic spectral alterations in the amide I region (represented in Figure 3(a)) and more evidenced by FSD analysis showed in Figure 3(b).
Indeed, besides the increase in intensity of β-turns content in the amide I region, a relative increase of β-sheet component at 1635 cm–1 and 1695 cm–1 with respect to the α-helix structure was observed, that can be considered significant in comparison to the correspondent vibration intensity levels of meat sample spectra after cooking in the conventional oven (p < 0.05).
In addition, a shift of about 1.5 cm–1 toward lower frequency of the β-sheet content at 1635 cm–1 was observed comparing microwave oven and conventional oven cooking spectra (see Figure 3(b)).
The shift toward lower wavenumbers during the microwave heating and the intensity increase can be attributed to an increasing transition dipole coupling due to a higher content in aggregated β-sheets structures. Such an increase between the low and the high frequency β-component has been described as characteristic for thermally aggregated proteins indicating intermolecular β-sheet structure with very strong hydrogen bonds in comparison to that observed from β-sheets in native proteins [31].
Indeed, high β-sheet to α-helix ratio may result in low access to intestinal digestive enzymes, resulting in low protein value. Even if tissue contain the same protein content, their nutritive value may be different if their α- helix and β-sheet ratios in the protein secondary structures are different.
Furthermore, the broad band around 1650 cm–1 assigned to α-helical structures, shows reduced band intensity upon increasing MWs exposure indicating that the content in α-helical structures is reduced during microwave oven cooking.
All these results showed that the alterations of meat’s protein secondary structure increase with increasing of time exposure to MWs during microwave oven cooking.
4. Conclusions
The effects of microwave energy on bovine breast meat were studied in the mid-infrared region by FTIR spectroscopy in comparison to conventional oven cooking, using three heating treatments: heating in a conventional electric oven at the temperature of 165˚C for 16 min, heating in a microwave oven at 800 W for 95 sec, and heating in the same microwave oven at 650 W for 160 sec.
Increases in intensity of the carbonyl band at 1742 cm–1 and of the methylene group at 1921 and 1853 cm–1 after meat cooking in the conventional oven were observed, that can be attributed to Maillard reaction; these effects were reduced after microwave oven cooking, showing that Maillard reaction occurs partially with this type of cooking.
The most representative alteration occurred in the amide I region, because microwave cooking at 800 W for 95 sec produced an increase in intensity in the region 1665 - 1690 cm–1, attributed to β-turns and characteristic of disorder processes in the protein.
Microwave cooking at a lower power (650 W) but for a longer time (160 sec) evidenced also significant increases of β-sheet component at 1635 cm–1 and 1695 cm–1 that can be attributed to aggregation processes of β- sheets structures. This result showed that alterations in the protein secondary structure increase with increasing of cooking time in a microwave oven.
REFERENCES
- E. Tornberg, “Effects of Heat on Meat Proteins—Implications on Structure and Quality of Meat Products,” Meat Science, Vol. 70, No. 3, 2005, pp. 493-508. doi:10.1016/j.meatsci.2004.11.021
- M. Kumar and B. D. Sharma, “The Storage Stability and Textural, Physico-Chemical and Sensory Quality of LowFat Ground Pork Patties with Carrageenan as Fat Replacer,” International Journal of Food Science & Technology, Vol. 39, No. 1, 2004, pp. 31-42. doi:10.1111/j.1365-2621.2004.00743.x
- S. H. Ko, S.-H. Yoo, S. Y. Lee, S. H. Cho, K.-H. Kim and R. Hwang, “Effect of Long Low Temperature-Short High Temperature Cooking Cycle on Physicochemical Properties of Beef,” Food Science and Technology Research, Vol. 17, No. 1, 2011, pp. 11-16.
- T. H. Powell, M. E. Dikeman and M. C. Hunt, “Tenderness and Collagen Composition of Beef Semitendinosus Roasts Cooked by Conventional Convective Cooking and Modeled, Multi-Stage, Convective Cooking,” Meat Science, Vol. 55, No. 4, 2000, pp. 421-425. doi:10.1016/S0309-1740(99)00171-0
- L. E. Jeremiah and L. L. Gibson, “Cooking Influences on the Palatability of Roasts from the Beef Hip,” Food Research International, Vol. 36, No. 1, 2003, pp. 1-9. doi:10.1016/S0963-9969(02)00093-5
- D. M. P. Mingos and D. R. Baghurst, “Application of Microwave Dielectric Heating Effects to Synthetic Problems in Chemistry,” In: H. M. Kingston and S. J. Haswell, Eds., Microwave-Enhanced Chemistry. Fundamentals, Sample Preparation and Applications, ACS Publications, Washington, 1997, pp. 3-53.
- T. Ohlsson, “Domestic Use of Microwave Ovens,” In: R. Macrae, R. K. Robinson and M. J. Sadler, Eds., Encyclopaedia of Food Science Food Technology and Nutrition, Academic Press, London, 1993, pp. 1232-1237.
- C. R. Buffler, “Microwave Cooking and Processing: Engineering Fundamentals for the Food Scientist,” Van Nostrand Reinhold, New York, 1993.
- L. Fulton and C. Davis, “Roasting and Braising Beef Roasts in Microwave Ovens,” Journal of the American Dietetic Association, Vol. 83, No. 5, 1983, p. 560.
- V. D. Pawar, F. A. Khan and B. S. Agarkar, “Effect of Fat/Whey Protein Concentrate Levels and Cooking Methods on Textural Characteristics of Chevon Patties,” Journal of Food Science and Technology, Vol. 39, No. 4, 2002, pp. 429-431.
- T. Albi, A. Lanzon, A. Guinda, M. C. Pérez-Camino and M. Leon, “Microwave and Conventional Heating Effects on Some Physical and Chemical Parameters of Edible Fats,” Journal of Agricultural and Food Chemistry, Vol. 45, No. 8, 1997, pp. 3000-3003. doi:10.1021/jf970168c
- H. Yoshida, N. Hirooka and G. Kajimoto, “Microwave Heating Effects on Relative Stabilities of Tocopherols in Oils,” Journal of Food Science, Vol. 56, No. 4, 1991, pp. 1042-1046. doi:10.1111/j.1365-2621.1991.tb14637.x
- H. Yoshida and G. Kajimoto, “Microwave Heating Affects Composition and Oxidative Stability of Sesame (Sesamum indicum) Oil,” Journal of Food Science, Vol. 59, No. 3, 1994, pp. 613-616. doi:10.1111/j.1365-2621.1994.tb05575.x
- S. M. Herzallah, “Influence of Microwaving and Conventional Heating of Milk on Cholesterol Contents and Cholesterol Oxides Formation,” Pakistan Journal of Nutrition, Vol. 4, No. 2, 2005, pp. 85-88. doi:10.3923/pjn.2005.85.88
- P. Yu, S. Tamminga, A. R. Egan and D. A. Christensen, “Probing Equivocal Effects of Heat Processing of Legume Seeds on Performance of Ruminants—A Review,” Asian-Australasian Journal of Animal Sciences, Vol. 17, No. 6, 2004, pp. 869-876.
- F. R. Van de Voort, “Fourier Transform Infrared Spectroscopy Applied to Food Analysis,” Food Research International, Vol. 25, No. 5, 1992, pp. 397-403. doi:10.1016/0963-9969(92)90115-L
- K. F. Ng-Kwai-Hang, J. E. Moxley and F. R. van de Voort, “Factors Affecting Differences in Milk Fat Test Obtained by Babcock, Rose-Gottlieb and Infrared Methods and in Protein Test From Infrared Milk Analysis,” Journal of Dairy Science, Vol. 71, No. 2, 1988, pp. 290- 298. doi:10.3168/jds.S0022-0302(88)79557-0
- J. M. Olinger and P. R. Griffiths, “Effects of Sample Dilution and Particle Size/Morphology on Diffuse Reflection Spectra of Carbohydrate Systems in the Nearand Mid-Infrared. Part 1: Single Analytes,” Applied Spectroscopy, Vol. 47, No. 6, 1993, pp. 687-694. doi:10.1366/0003702934066965
- W. K. Surewicz and H. H. Mantsch, “New Insight into Protein Secondary Structure from Resolution-Enhanced Infrared Spectra,” Biochim et Biophys Acta, Vol. 952, No. 2, 1988, pp. 115-130. doi:10.1016/0167-4838(88)90107-0
- B. Stuart, “Infrared Spectroscopy: Fundamentals and Applications,” John Wiley & Sons, Hoboken, 2004.
- P. Dumas and L. Miller, “The Use of Synchrotroninfraredmicrospectroscopy in Biological and Biomedical Investigations,” Vibrational Spectroscopy, Vol. 32, No. 1, 2003, pp. 3-21. doi:10.1016/S0924-2031(03)00043-2
- L. C. Maillard, “Action des acides aminés sur les sucres; formation des mélanoidines par voie methodique,” Comptes Rendus de l'Académie des Sciences, Vol. 154, 1912, pp. 66-68.
- J. E. Hodge, “Dhydrated Foods. Chemistry of Browning Reaction in Model Systems,” Journal of Agricultural and Food Chemistry, Vol. 1, No. 15, 1953, pp. 928-943. doi:10.1021/jf60015a004
- M. Namiki, “Chemistry of Maillard Reactions: Recent Studies on the Browning Reaction Mechanism and the Development of Antioxidants and Mutagens,” Advances in Food Research, Vol. 32, 1988, pp. 115-184. doi:10.1016/S0065-2628(08)60287-6
- E. Calabrò and S. Magazù, “Inspections of Mobile Phone Microwaves Effects on Proteins Secondary Structure by means of Fourier Transform Infrared Spectroscopy,” Journal of Electromagnetic Analysis & Applications, Vol. 2, No. 11, 2010, pp. 607-617. doi:10.4236/jemaa.2010.211080
- E. Calabrò, S. Condello, M. Currò, N. Ferlazzo, D. Caccamo, S. Magazù and R. Ientile, “Modulation of HSP Response in SH-SY5Y Cells Following Exposure to Microwaves of a Mobile Phone,” World Journal of Biological Chemistry, Vol. 3, No. 2, 2012, pp. 34-40. doi:10.4331/wjbc.v3.i2.34
- E. Calabrò and S. Magazù, “Electromagnetic Fields Effects on the Secondary Structure of Lysozyme and Bioprotective Effectiveness of Trehalose,” Advances in Physical Chemistry, Vol. 2012, 2012, Article ID: 970369. doi:10.1155/2012/970369
- E. Calabrò, S. Magazù and S. Campo, “Microwave-Induced Increase of Amide I and Amide II Vibration Bands and Modulating Functions of Sodium-Chloride, Sucrose and Trehalose Aqueous Solutions: The Case Study of Haemoglobin,” Research Journal of Chemistry and Environment, 2012, accepted and in press.
- M. Jackson and H. H. Mantsch, “The Use and Misuse of FTIR Spectroscopy in the Determination of Protein Structure,” Critical Reviews in Biochemistry and Molecular Biology, Vol. 30, No. 2, 1995, pp. 95-120. doi:10.3109/10409239509085140
- J. Kong and S. Yu, “Fourier Transform Infrared Spectroscopic Analysis of Protein Secondary Structures,” Acta Biochimica et Biophysica Sinica, Vol. 39, No. 8, 2007, pp. 549-559. doi:10.1111/j.1745-7270.2007.00320.x
- H. Fabian and W. Mäntele, “Infrared Spectroscopy of Proteins,” In: J. M. Chalmers and P. R. Griffiths, Eds., Handbook of Vibrational Spectroscopy, John Wiley & Sons Ltd., Chichester, 2002, pp. 3399-3425.