Journal of Electromagnetic Analysis and Applications
Vol.4 No.8(2012), Article ID:21530,9 pages DOI:10.4236/jemaa.2012.48044
Simulation of Multi-Frequency Induced Currents in Biophysical Models and Agar Phantoms of Breast Cancer
![]()
1Universidad del Ejército y FAM/EMGS-Laboratorio Multidisciplinario de Investigación, México City, México; 2Instituto Politécnico Nacional/Escuela Superior de Medicina-Sección de Investigación y Posgrado, México City, México.
Email: *c.cesar.gonzalez@gmail.com
Received June 6th, 2012; revised July 10th, 2012; accepted July 25th, 2012
Keywords: Inductive; Phase; Shift; Breast; Cancer
ABSTRACT
Breast cancer is the most frequent malignant neoplasm and the leading cause of cancer death in women in the world. Early detection techniques have been proposed on the basis of bioelectrical measurements. The aim of this study was to evaluate analytically and experimentally the inductive phase shift as a function of multi-frequency induced currents in breast cancer conditions. Virtual simulation by biophysical models and experimental measurements by magnetic induction in agar phantoms were developed to estimate the inductive phase shift as a function of the bulk electrical properties in typical breast volumes with tumors in specific positions. The analytical and experimental results are qualitatively consistent and provide evidence that the inductive phase shift has a potential clinical value to detect cancerous tumors toward inside a typical volume of breast tissue.
1. Introduction
Breast Cancer (BC) is the most frequent malignant neoplasm and the leading cause of cancer death in women in the world. Of the nearly 6 million of malignant tumors that occur in women, the most common is BC with about 21% of cases [1,2]. Current limitations in the treatment of BC are associated to late diagnosis of the disease and the inability to continuously monitor the therapeutic response, since even with current imaging systems, a low or no availability of equipments on the first level health care does not allow early screening in women with potential risk of developing BC [3].
To counter the limitations mentioned above, early detection techniques have been proposed by measurements of tissue electrical properties based on the principle that in the hyper-vascularization of malignancies promotes changes in Electrical Impedance (EI) of the tissue. This has suggested the use of bioimpedance measurements for the detection of cancer in different organs and tissues. Scharfetter and collaborators have considered the Electrical Impedance Spectroscopy (EIS) as a possibility to produce information on abnormal conditions in tissues [4]. Some researchers such as Newell and Holder have proposed the Electrical Impedance Tomography (EIT) as another important method to assess and monitor tumors in different organs and tissues [5,6]. EIT uses an array of electrodes to inject currents and measure subsensory voltages. The data are used to reconstruct a map of the EI of the tissue, the main disadvantage is that the measurements depend on proper electrode-skin galvanic coupling and sweating or the hydration level of the skin frequently affects it.
Griffiths and Watson have proposed the use of bioelectrical measurements through magnetic induction at a single frequency with noninvasive coils as a valuable alternative to monitor, non-invasively, the health of organs and tissues [7-9]. Other authors such as Al-Zeiback and Korjenevsky have agreed to propose non-contact measurements for the development of alternative electrical imaging Magnetic Induction Tomography (MIT) [10- 12]. Recently, MIT has been proposed to obtain threedimensional images on the basis of a matrix-free reconstruction method [13].
The sensitivity of the EIT and the MIT is a function of the electrical properties of the organ or tissue under study (mainly electrical conductivity) and its primary application has focused on the detection of edema (fluid accumulation). The application of bio-impedance measurements in the detection of malignant tumors has technical feasibility because the electrical conductivity of cancerous tissue is differentiable with respect to normal tissue, for example, in a study reported by Burdette [14], human breast tissue tumor shows an increase in electrical conductivity from 4 to 8 mS/cm compared to normal tissue.
Our group has proposed bioelectric measurements through multi-frequency magnetic induction as a valuable alternative to monitor, non-invasively, growths in breast tissue. We have developed a prototype inductor-sensor low intensity magnetic field at non-ionizing frequencies; the system uses the technique of Magnetic Induction Spectroscopy (MIS) to measure the volumetric electrical properties of tissue by magnetic fields at multiple frequencies. The aim of this study was to evaluate analitically and experimentally changes in the inductive phase shift as a function of multi-frequency induced currents in biophysical models and agar phantoms of breast cancer with tumoral volumes in representative positions. The present report is structured as follows: 1) The introduction section reviews an epidemiological view of breast cancer around the world, relevant studies regarding the use of bioelectronic measurements to detect the disease as well as the goal of this study; 2) In the virtual method section is described the biophyscial concept proposed to detect tumoral volumes in breast by magnetic induction, a description of the used three-dimensional breast model, simulation criteria accordingly to time-harmonic and quasistatic assumption for inductive phase shift estimation as well as the mathematical analysis; 3) The experimental design with agar phantom and an experimental inductive spectrometer prototype are detailed; 4) Analytical and experimental results are discussed and concluded.
2. Virtual Simulation Method and Experimental Design
2.1. Biophysical Concept
The geometrical configuration of the biophysical concept proposed to detect non-invasively malignant neoplasms in breast tissue by MIS measurements is shown in Figure 1. Two coupled coils of different radii in an inductor-sensor arrangement were coaxially centred and spaced in such a way that a typical breast tissue volume is placed along the centre line. An alternating current Iejwt is injected to the inductor coil to generate a primary magnetic field B and to induce Eddy currents in the tissue volume as well in the sensor coil by magnetic induction, the induced currents promotes a perturbation of the primary magnetic field (ΔΒ) as a function of the bulk conductive electrical properties of the breast and tumour volumes, and generates an inductive phase shift (Δθ), which is detected as a composite magnetic field B + ΔΒ in the sensor coil. Since the phase shift of the total detected magnetic field in the sensing coil could be obtained experimentally through an arrangement “voltage relative to voltage” [11, 12]. Hence, the phase difference voltage relative to voltage between the inductor and sensor coils is used to estimate the inductive phase shift.
2.2. Three-Dimensional Simulation Study
2.2.1. 3D Ideal Breast Model
The three-dimensional pixel model of the ideal semisphere breast considered was designed on the basis of tridimensional polygons (meshes), which use orthogonal bi-dimensional views as reference guides. The semi-sphere and coil configuration were designed in proportional dimensions in the scale 1:10 by the geometry module of the commercial software COMSOL Multiphysics V3.3a (COMSOL, Inc. Boston Ma. USA, 2005). This software was also the plattform for biophysical simulation by the finite element method. The pixel model includes healthy and tumor breast tissue as structural components (subdomains). Circular inductive and sensor coils were placed along the model in such a way that the semi-sphere breast volume occupied a concentric position between the coils (see Figure 2).
2.2.2. Simulation Criteria
The breast and tumor volume tissues were considered to be homogeneous and isotropic with electrical properties of NaCl 0.9% and 3% respectively; those values were selected to generate electrical conductivity differences in the order 1:4 as healthy and tumoral ideal breast tissue conditions.
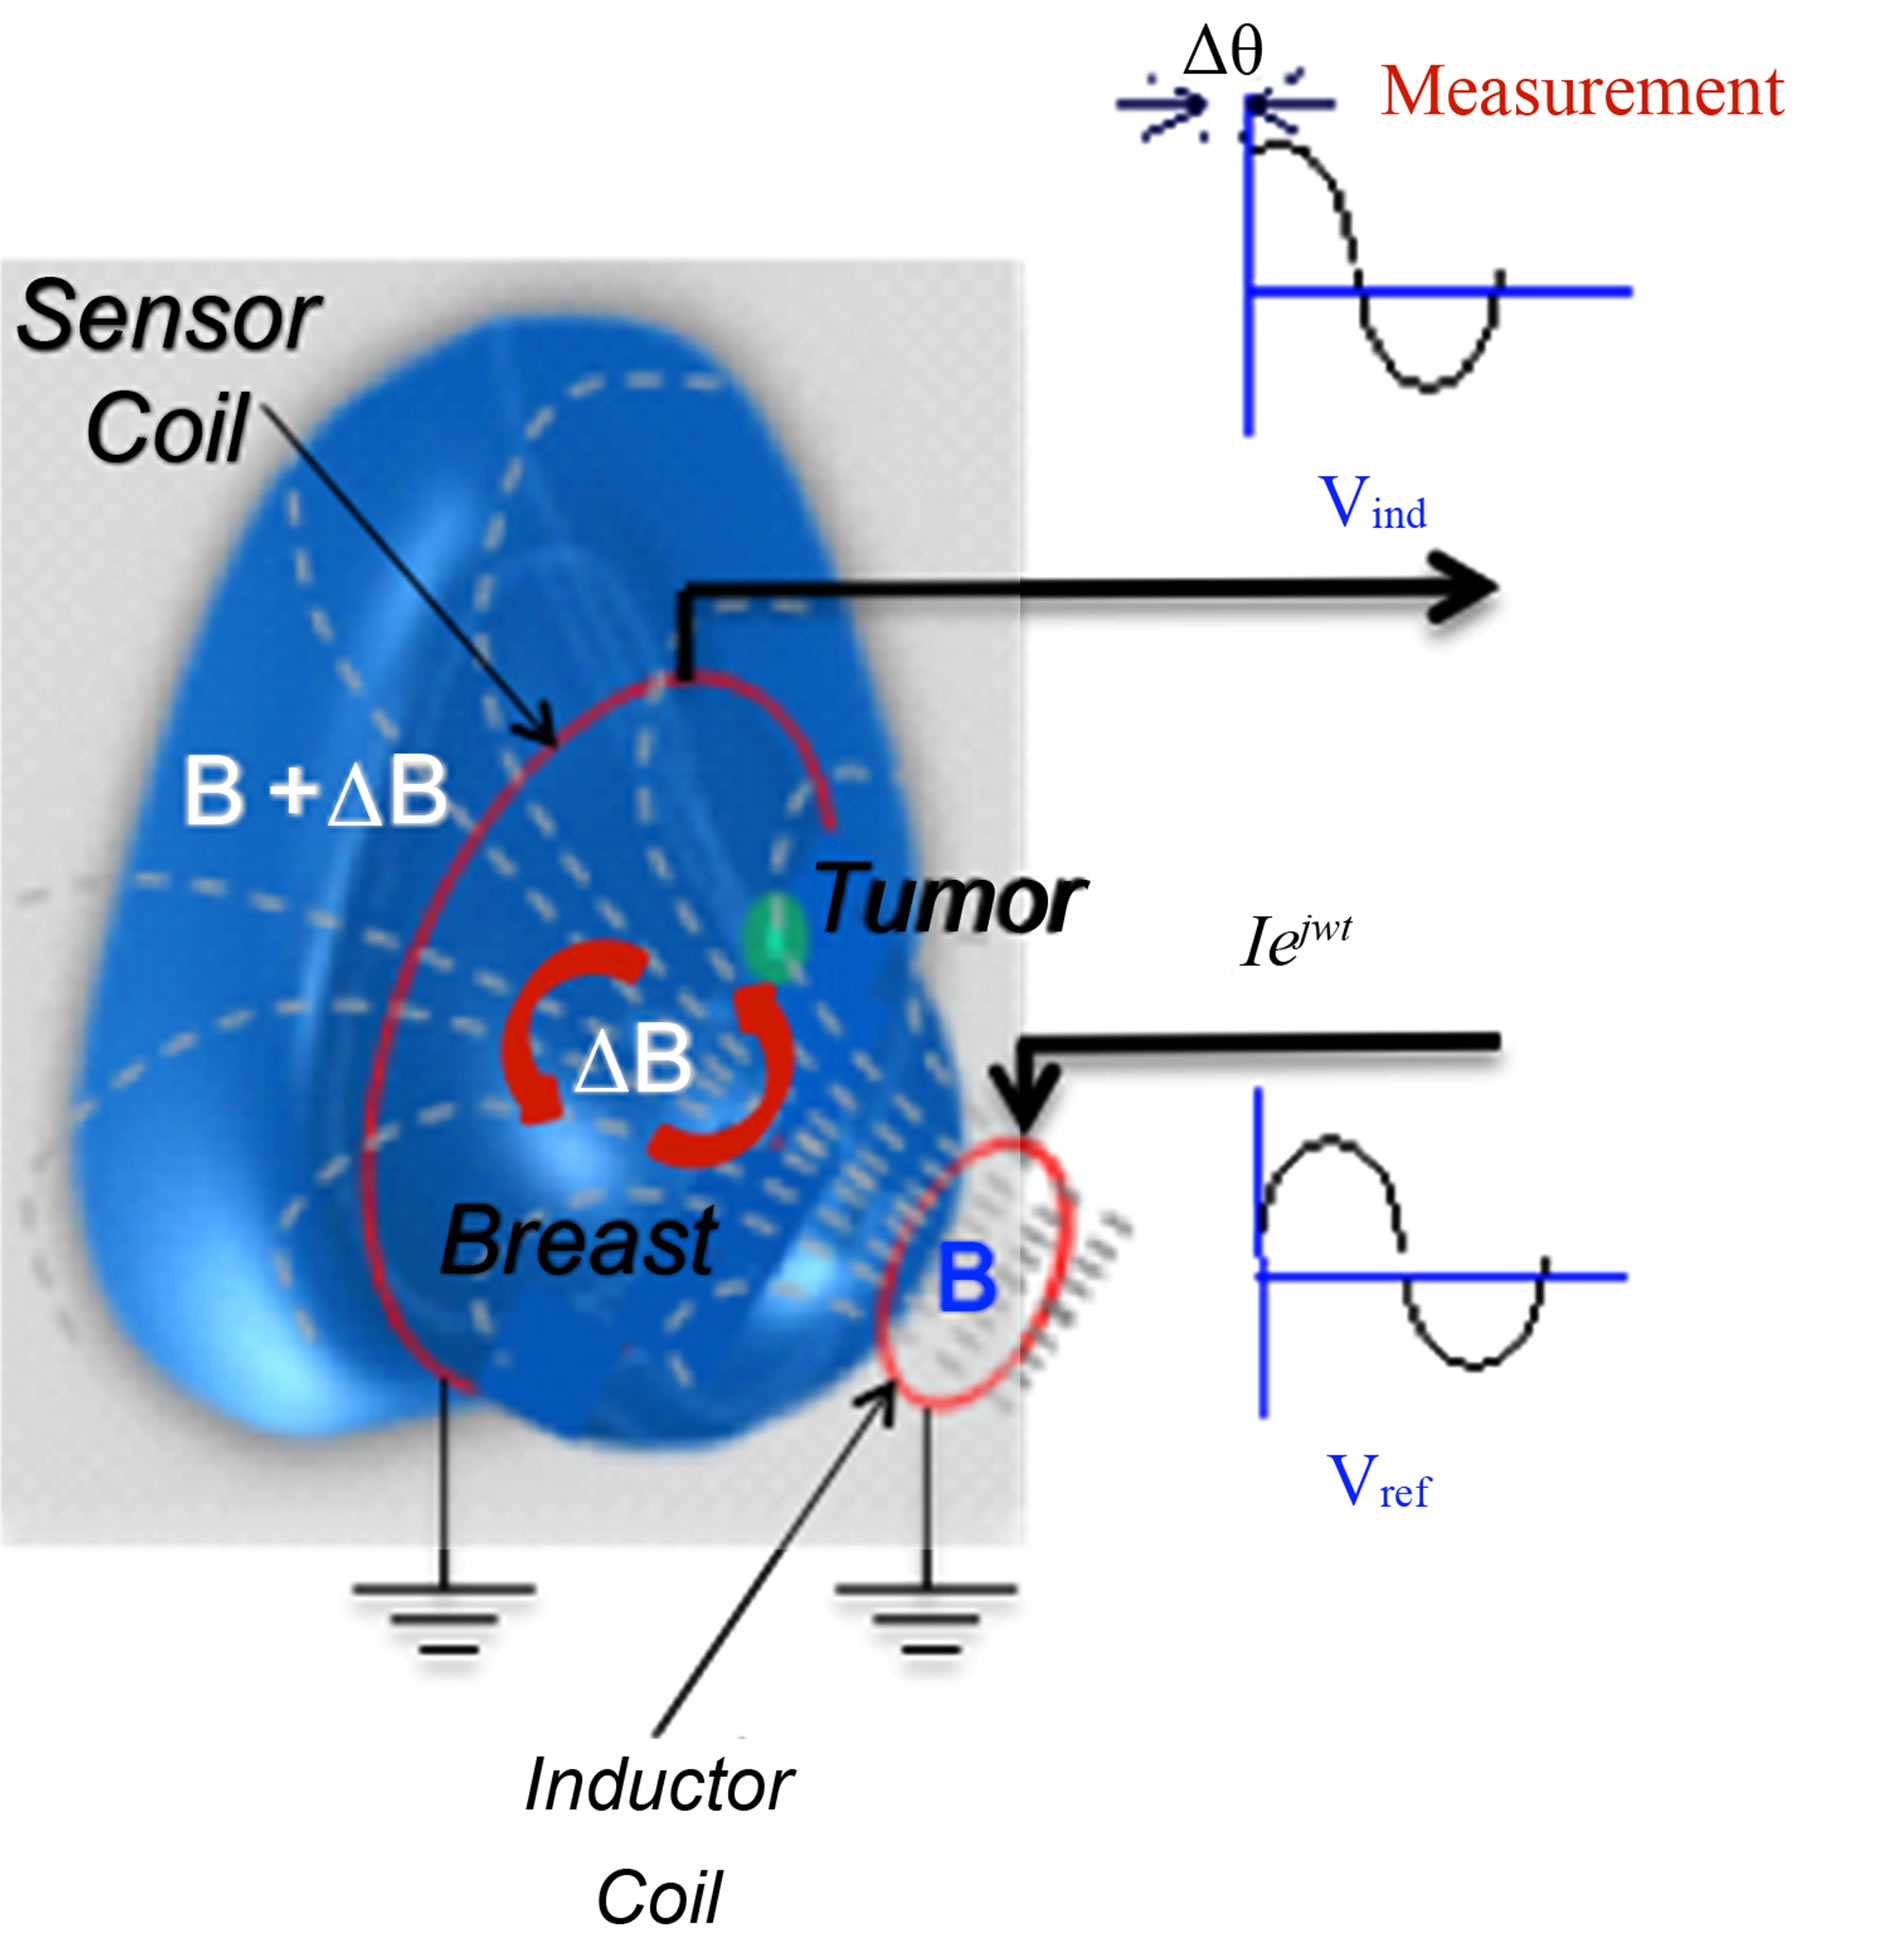
Figure 1. Biophysical concept for non-invasive detection of malignant neoplasms in breast tissue by MIS measurements. An alternating current Iejwt flowing in an inductor coil generates a primary magnetic field B, the bulk electrical properties of the breast and tumour volumes generates a perturbation (ΔΒ) as a measurement inductive phase shift (Δθ), which is detected as a composite magnetic field B + ΔΒ in a sensor coil. The phase difference relative to coils voltage is used to estimate the inductive phase shift.
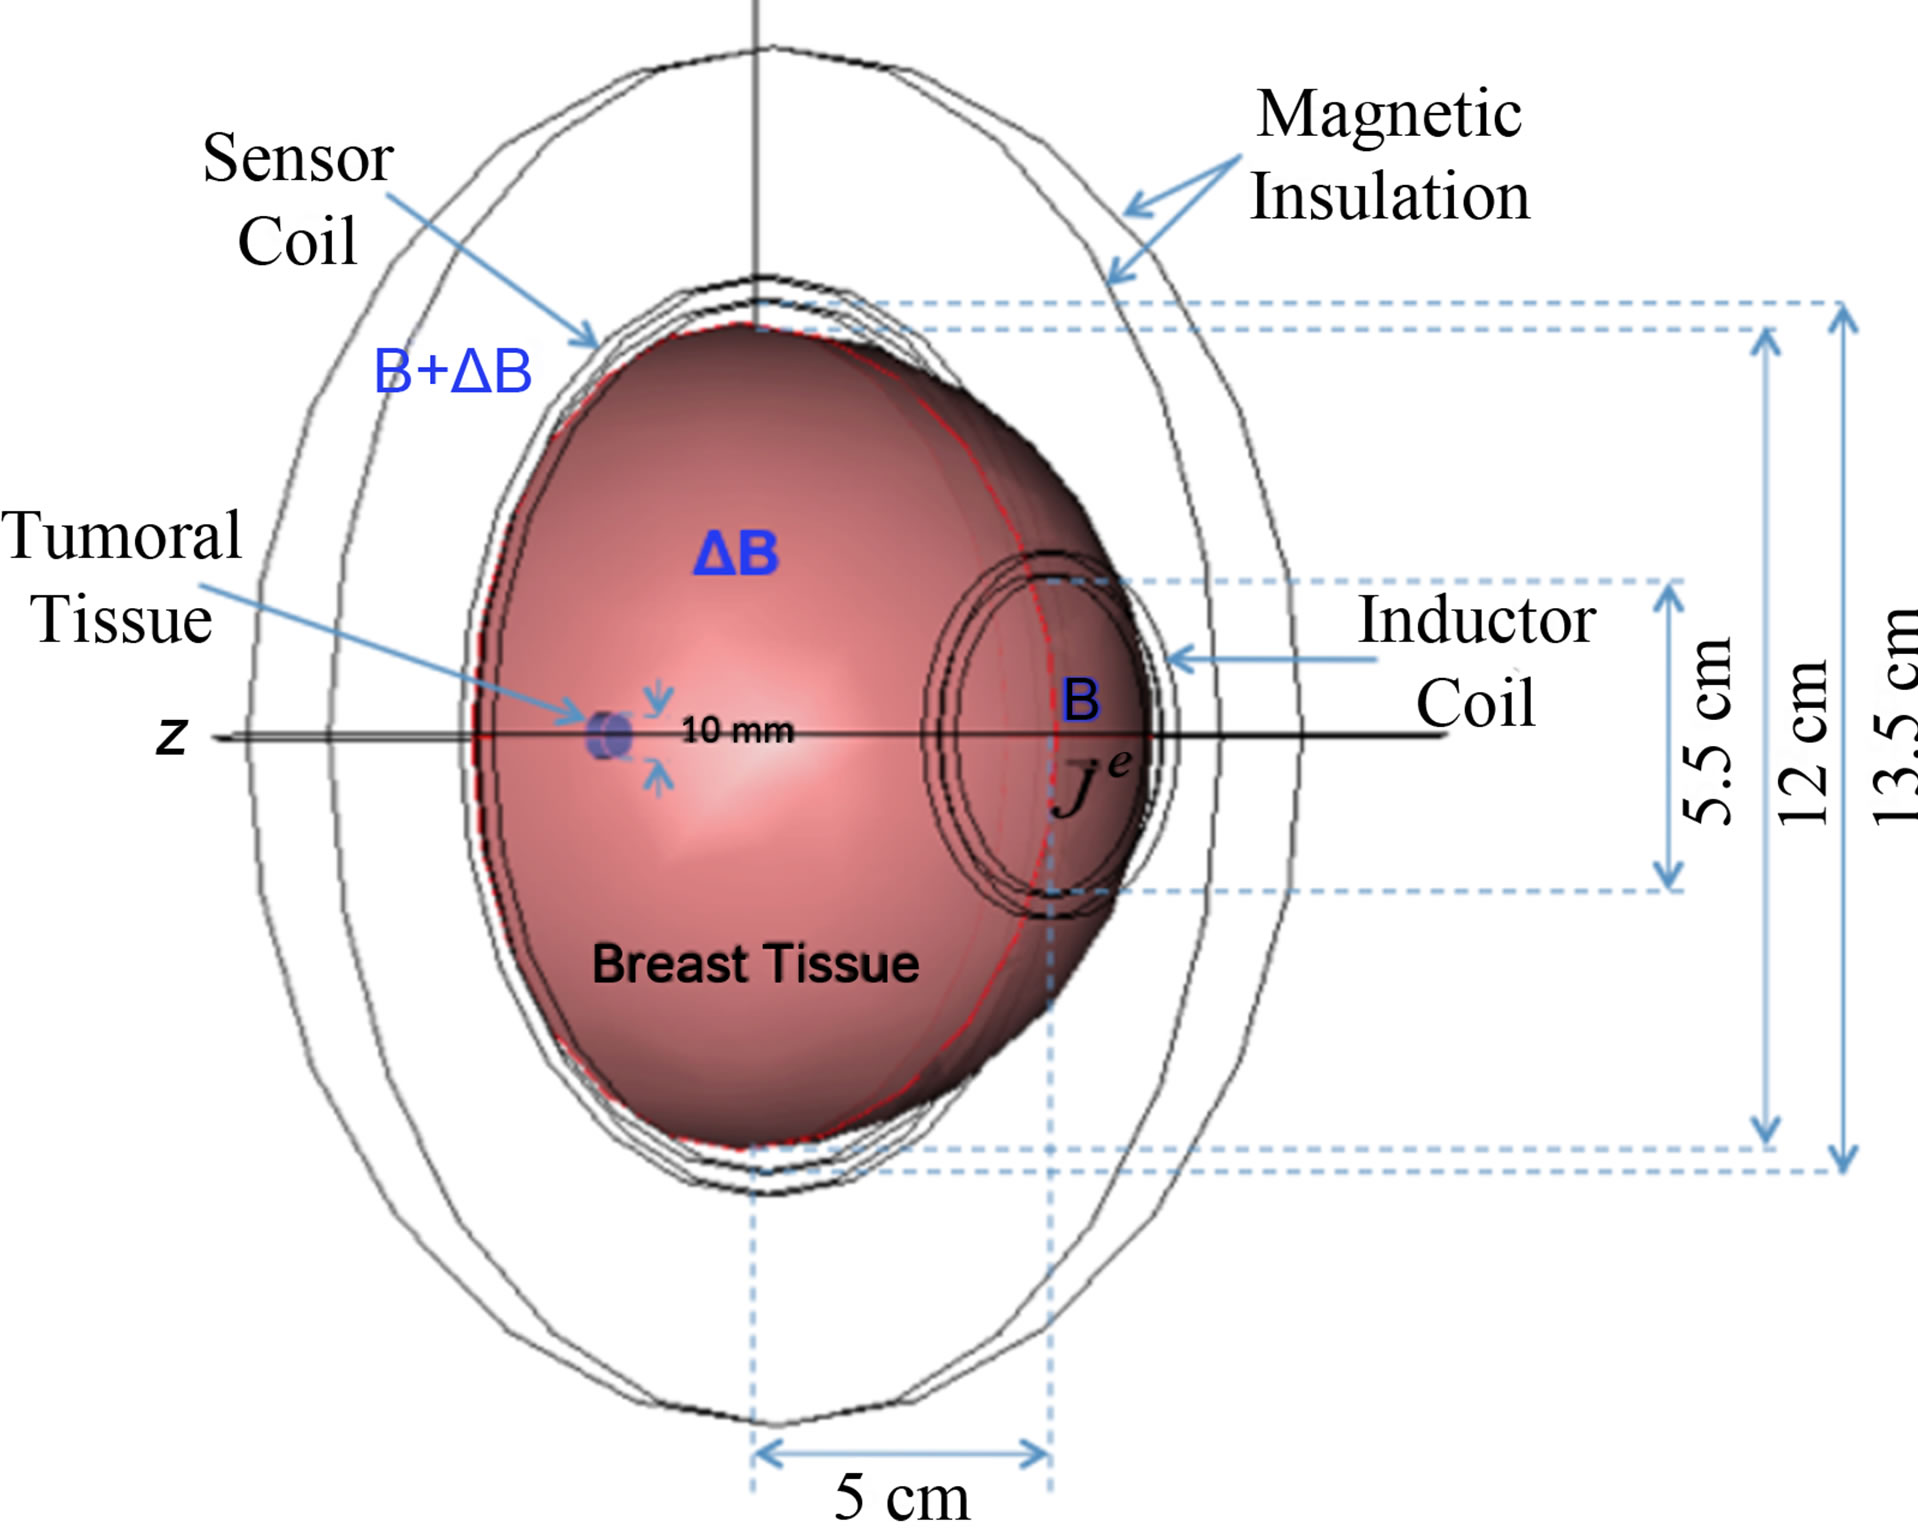
Figure 2. Three-dimensional pixel model for virtual simulation of ideal semi-sphere breast and cylinder tumour designed on the basis of tridimensional polygons (meshes). The breasttumour model is placed coaxially centred along the inductor-sensor coils configuration.
Theoretically, ionic solutions such as aqueous NaCl exhibit no dielectric dispersion at frequencies below 1 MHz, thus the conductivity should be considered constant and just a function of the electrolytic concentration. In this study electrical conductivity of NaCl 0.9% and 3% were taken as 1.93 y 6.46 S/m respectively; accordingly with molar conductivity criteria reported in [15]. The whole simulated model was surrounded by a sphere of 20 cm of radius that had electrical parameters correspond to the air. The inductor and sensor coils were taken to have electrical properties of copper (σ = 5.998 × 10⁷ S/m and εr = 1), a thickness of 0.5 cm and diameters of 5.5 and 13.5 cm respectively. A sinusoidal current in the inductive coil was considered as a magnetic field generation signal. We simulate different induced current densities inside the semi-sphere model by 1 Ampere/m2 of alternating currents in the inductor coil at four frequencies (0.001, 0.01, 0.1 and 1 MHz). The induced Eddy currents into the model promote an inductive phase shift spectrum detected in the sensor coil. To investigate the effect of the tumor position inside the semi-sphere, four representative tumor positions were evaluated (1, 2 and 4 cm, as well as in the center with respect to the external border). Figure 3 shows the simulation of electrical conductivity distribution specified to breast and tumor tissue as well as tumor positions evaluated into the geometrical volume configuration.
2.2.3. Time-Harmonic and Quasi-Static Assumption
In the time-harmonic case we omit the displacement currents in the Ampere’s equation [16]. To simplify initial conditions; we consider a non-moving geometry (ν = 0) and no external electric potential gradient (ΔV = 0) on the border of the breast pixel model. In addition, we have assumed that the border of the sphere surrounding the system defined in above section is grounded. Thus, we can obtain:
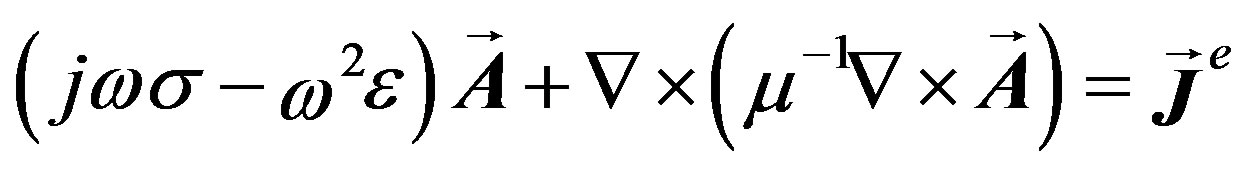 (1)
(1)
where: σ is the medium conductivity (siemens/meter), ω is the angular frequency (rad/s),  is a current density generated externally (ampere/meter2), μ is the medium permeability (henry/meter) and ε is the medium permittivity (farad/meter). In this study Equation (1) was solved to obtain the magnetic vector potential
 , a detailed deduction of (1) and its solution is shown in [17].
2.2.4. Inductive Phase Shift Estimation
We consider the semi-sphere breast model and coil configuration shown in Figure 1 with an alternating current Iejwt flowing through the inductor coil. The presence of a conductive sample (the semi-sphere breast model) produces phase shift in the sensor coil current as a function of the structural composition and its electrical properties of the sample (σ, ε). In this study four different structural compositions are represented by the tumor position, which are detected trough changes in the induced current phase at the sensor coil. The induced sensor coil current can be separated in its complex coefficients [18] given by:
 (2)
(2)
where the argument can be obtained:
 (3)
(3)
We define a basal induced current argument in the sensor coil as (ωt + q) and the argument influenced by the tumor position as (ωt + q1). To estimate the inductive phase shift (Δq) we can use the argument differences at specific frequency and time according to the following expression:
 (4)
(4)
2.2.5. Mathematical Analysis
The mathematical analysis was performed with COMSOL Multiphysics (COMSOL, Inc. Boston Ma. USA, 2005) which employs the finite element method to solve (1) for the magnetic vector potential. Every structural component (subdomain) of the model was meshed in triangular elements. To define boundary conditions the inner electrical parameters of the surrounded sphere correspond to the air and represent electric and magnetic insulation. The induced complex current densities in the sensor coil were calculated by post-processing options available in COMSOL Multiphysics (subdomain integration). Those values were used to estimate spectra of inductive phase shift at the
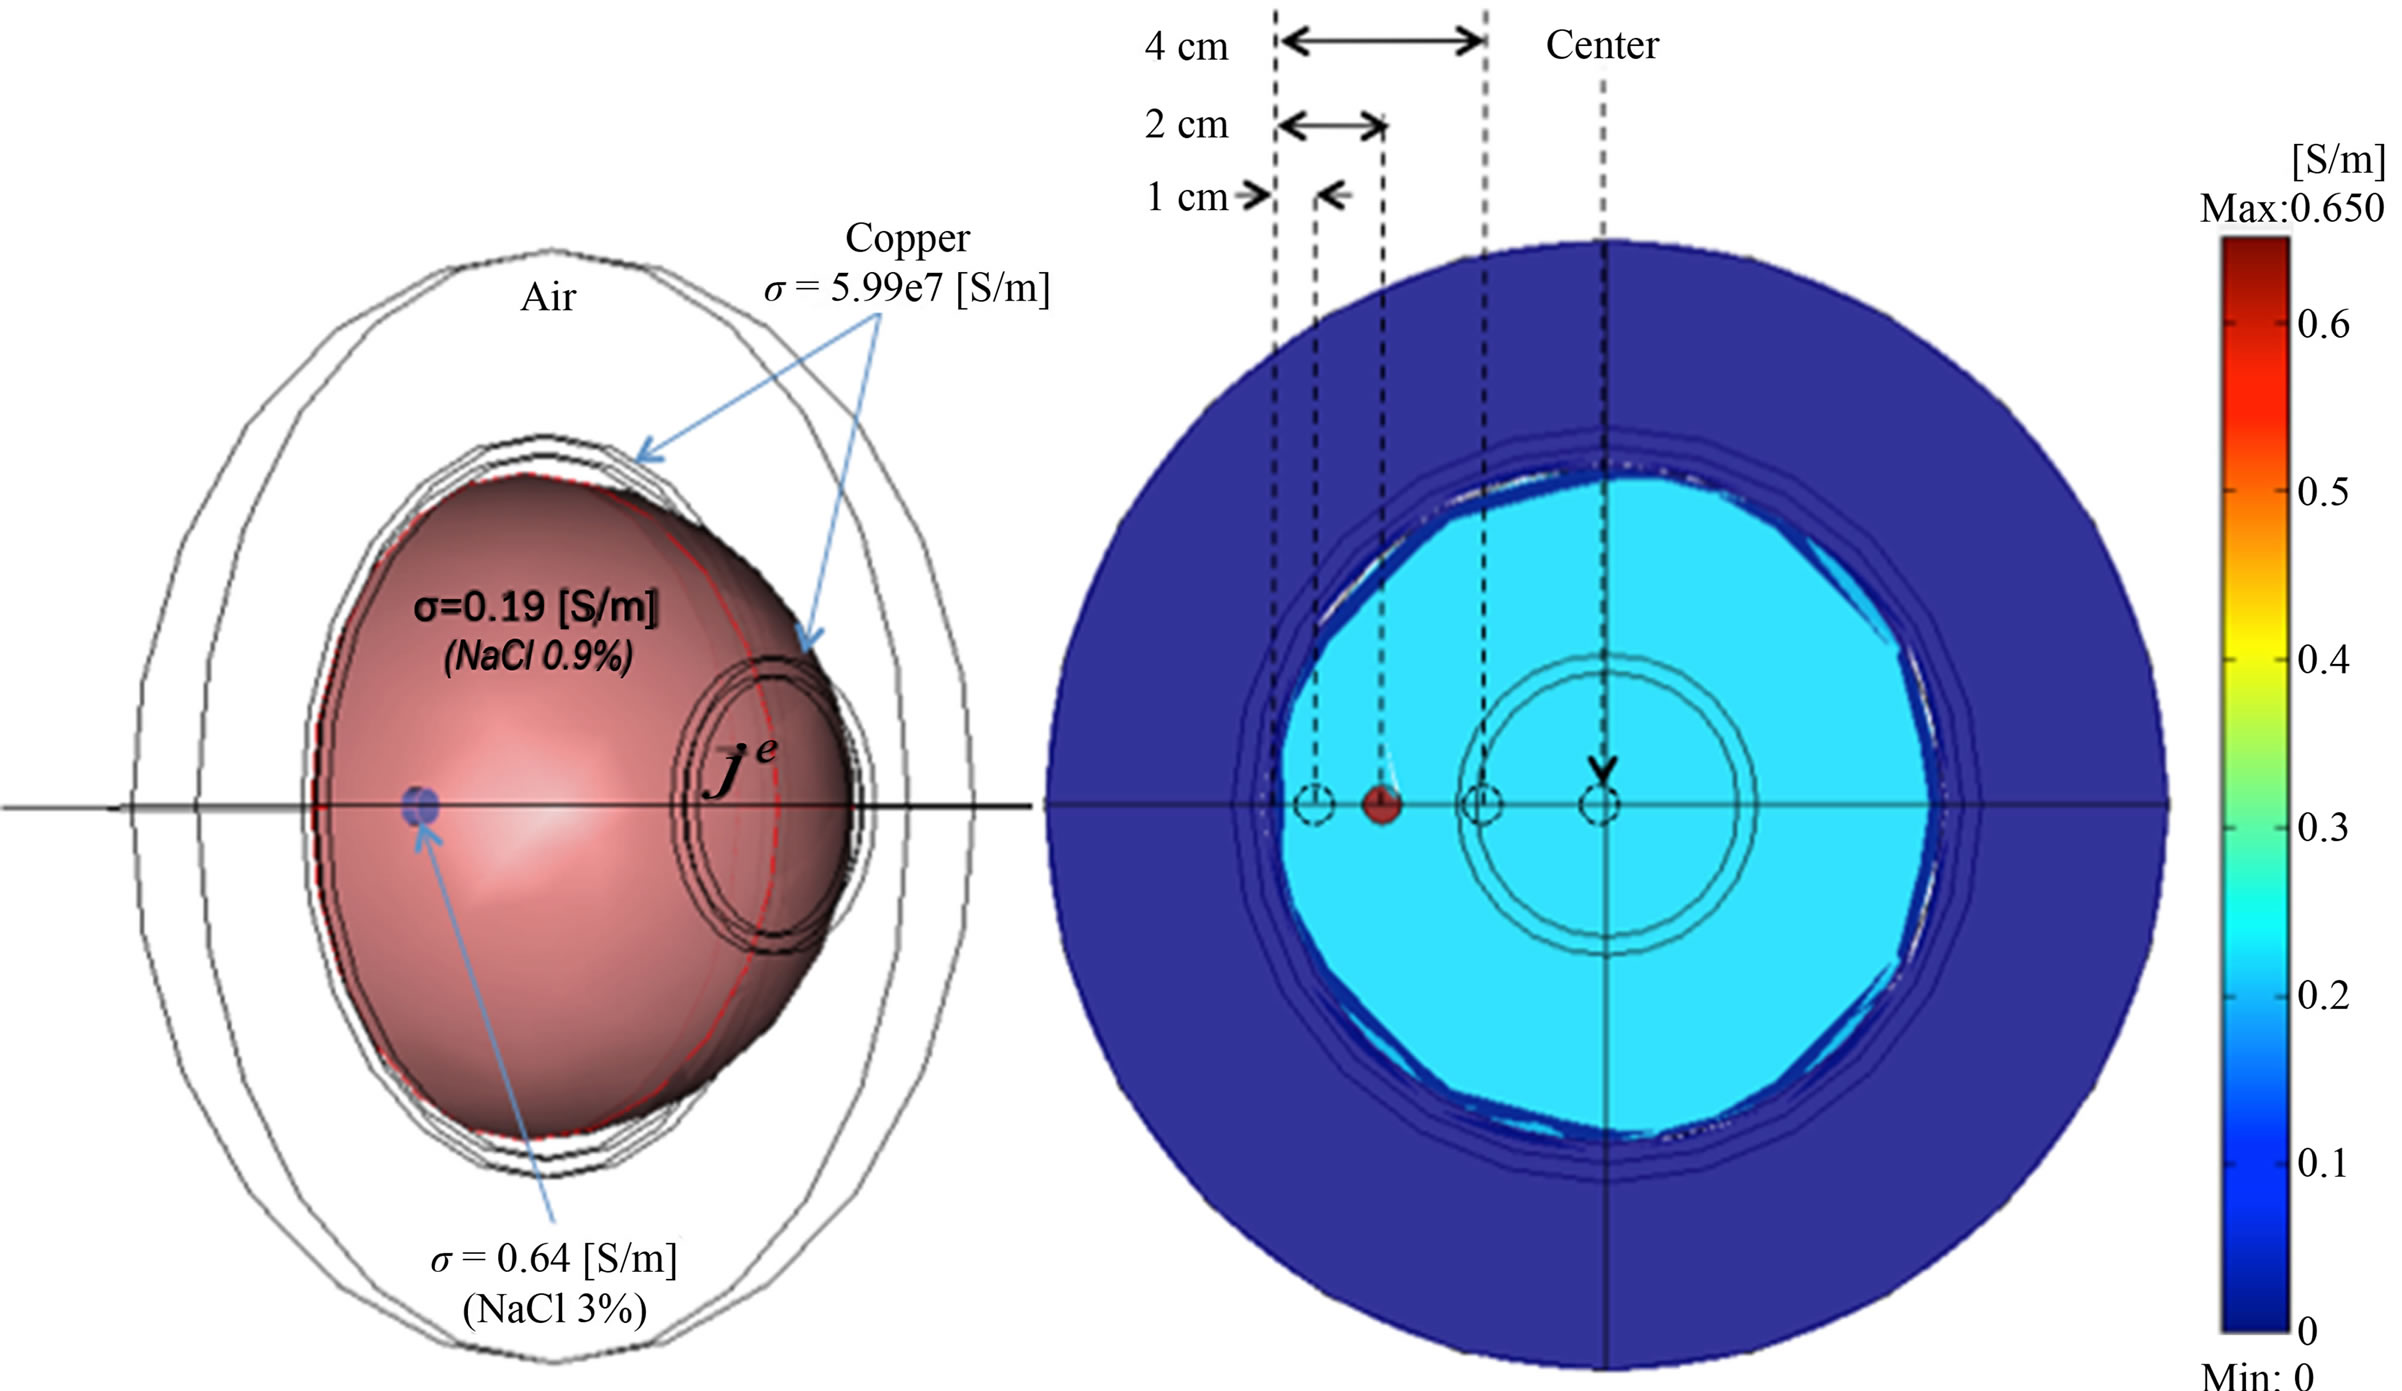
Figure 3. Electrical conductivity distribution specified for simulated breast and tumor tissue as well as geometrical tumour positions evaluated into three-dimensional pixel models. Four representative tumour positions are considered (1, 2 and 4 cm, as well as in the centre with respect to the external border).
evaluated frequencies (0.001, 0.01, 0.1 and 1 MHz). Phase shift simulations without tumor volume were taken as basal values. Inductive phase shift values were estimated as homogenized data with respect to the semi-spherical breast model without tumor. All calculations were developed by a personal computer Dell Precision 490 with two processors double core Intel® Xeon® 5130 2GHz (Dell Inc. Round Rock, Texas, USA).
2.3. Experimental Study
2.3.1. Agar Phantom Design
Agar phantoms to emulate semi-spherical breast volumes were designed and build with saline solution (C. S. PISA calve 3608), Agar (Invitrogen Cat No. 30391) and Sucrose (Gibco BRL Cat. No. 5503UA) accordingly to the technique previously described in [19]. In brief, a volume of 275 ml of NaCl 0.9%, Agar 5% and Sucrose 3% were homogenized at 90˚C and dropped in a semi-spherical ceramic model. Additional cylindrical phantoms to emulate tumor volumes of 1 ml were developed with NaCl 3% (J. T. Baker, Cat. No. 3624-01) Agar 5% and Sucrose 3%, such cylinders were inserted in the posterior side of the semi-spherical phantom at four representative tumor positions (1, 2, and 4 cm with respect to the external border, as well as in the center of the model) see Figure 4. An additional phantom without tumor cylinder was built.
2.3.2. Experimental Inductive Spectrometer Prototype
An experimental inductive spectrometer to use MISmeasurements in a typical breast tissue volume was designed and constructed. Figure 5 shows a block diagram of the experimental prototype and the measurement concept. The system consists of five modules: digital synthesizer, transceiver, phase detector, data acquisition and data processing. A brief description of the different modules follows: the digital synthesizer was implemented by a signal generator AD9958 (Analog Device Inc. Norwood, MA, USA), which supplies a signal Icos(ωt) of approximately 10 mA in the range of 0.001 - 1 MHz at pre-programmed steps (0.001, 0.01, 0.1 and 1 MHz) controlled by PC. The transceiver consists of an arrangement of inductor and sensor coils coaxially centred as the concept shown in Figure 2. Both coils were built from five turns of magnet wire AWG32 rolled on a coil holder ergonomically adapted to the anatomy of the breast. The inductorsensor coils geometrical disposition correspond to diameters f1 = 5.5 and f2 = 13.5 cm respectively, both coils spaced a distance d = 5 cm as shown in Figure 2. The coil inductances, as calculated on the basis of Faraday’s law, were 14.9 and 89.9 μH for inductor and sensor respectively. The estimated mutual inductance coefficient was M = 0.01 μH approximately. A resonance frequency of the digital synthesizer-inductor coil system was determined experimentally around 90 KHz; this frequency is
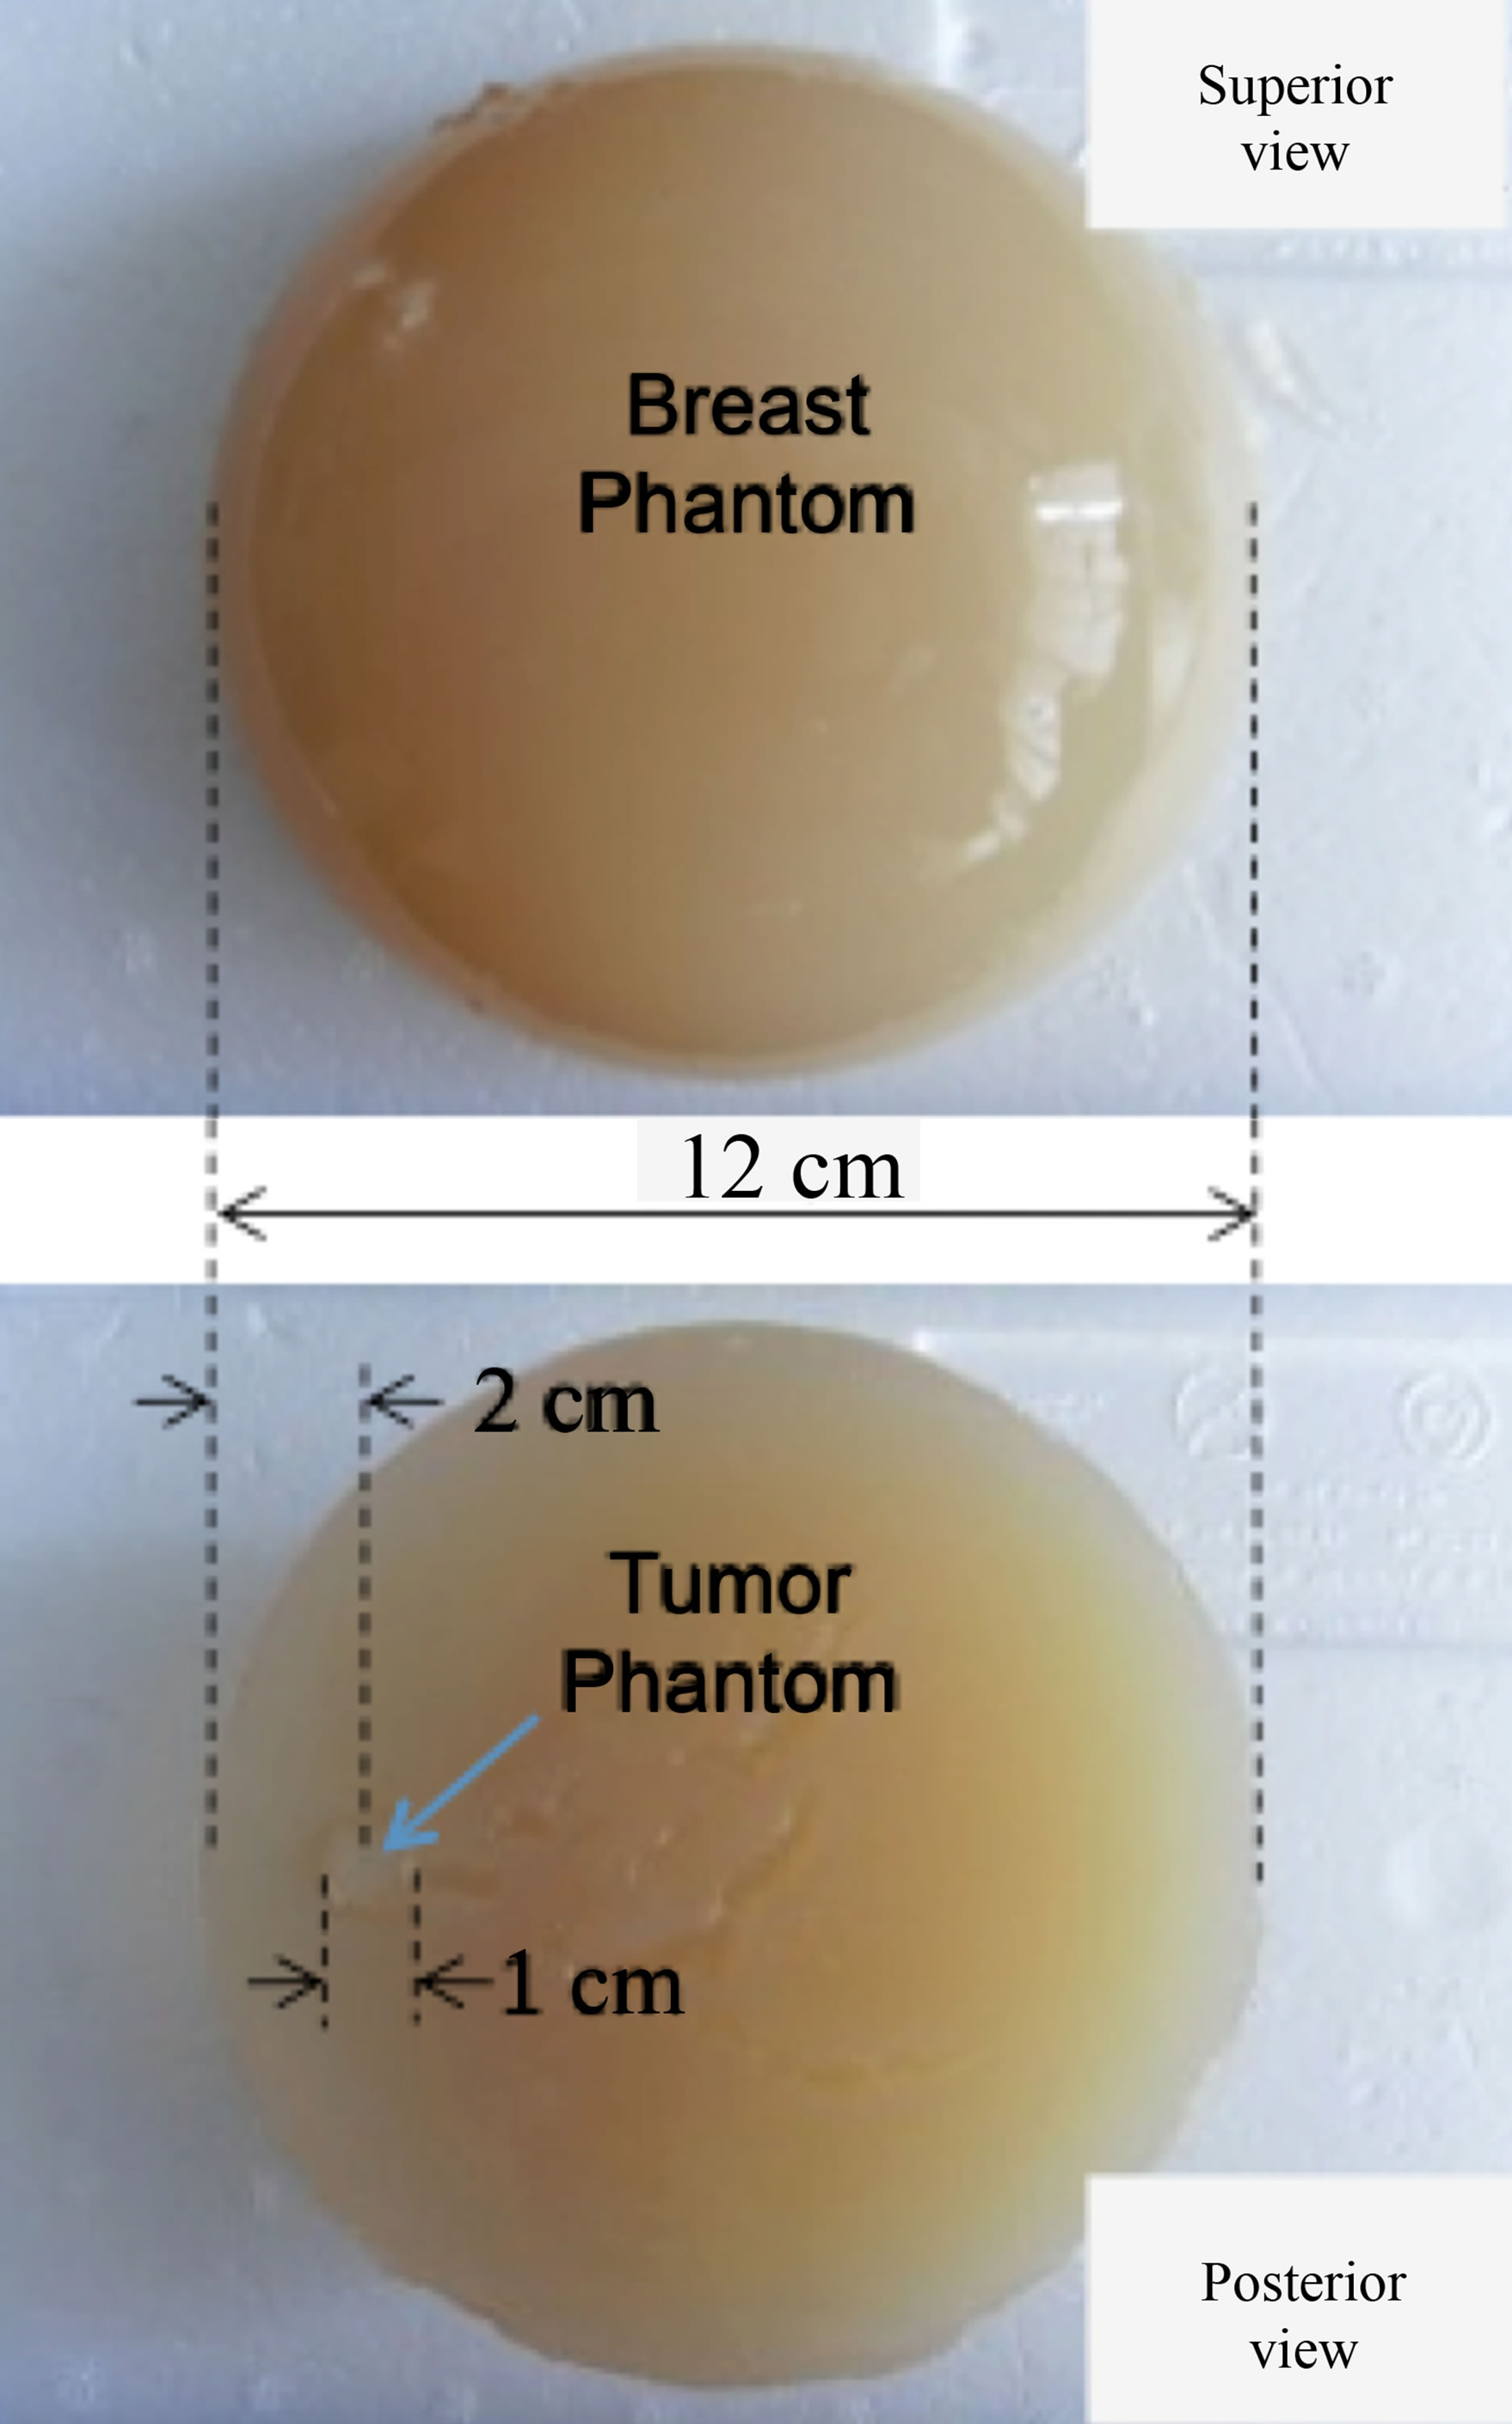
Figure 4. Agar phantoms to emulate healthy and tumor conditions in a typical breast tissue volume. Semi-spherical healthy breast volumes of 275 ml were built with NaCl 0.9%, Agar 5% and Sucrose 3%. Cylindrical tumor volumes of 1 ml were built with NaCl 3%, Agar 5% and Sucrose 3%, and were inserted in the posterior side of the semi-spherical phantoms at four tumor positions (1, 2 and 4 cm, as well as in the center with respect to the external border). Figure shows a representative tumor position at 2 cm with respect to the external border of the healthy tissue.
excluded from the analysis. To avoid inductive pickup the leads of the coils are twisted. The inductor coil generates the primary magnetic field B and it induces a current in the sensor coil by magnetic induction, a perturbation of the primary magnetic field (ΔB generates an inductive phase shift (Δq) as a function of the bulk electrical properties of the breast and tumour volumes, which is detected as a composite magnetic field B + ΔB in the sensor coil. A phase detector as the voltage phase difference between the inductor and sensor coils estimates the inductive phase shift. The phase detector was designed on the basis of the AD8302 (Analog Devices Inc. Norwood, MA, USA). The AD8302 is a fully integrated RF IC for measuring differences in phase between two signals with a resolution of 10 mV/degree. The signals of the inductor and sensor coils were connected trough a 5× preamplifier SR445 (Standford Research System Inc. Sunnyvale, CA, USA) directly to the digital synthesizer and phase detector module as shown in Figure 5. The data acquisition (A/D) module uses a 10-Bit Analog-to-Digital module of the microcontroller 18F4550 (Microchip Technology Inc. Chandler, Arizona, USA). For each frequency, the data are an average of 1024 measurements. Figure 6 shows the experimental inductive spectrometer prototype manufactured.
2.3.3. Experimental Design
Agar phantoms were built as described in previous sub-

Figure 5. Block diagram of the experimental inductive spectrometer prototype designed and build for non-invasive detection of malignant neoplasms in a typical breast volume. The system consists of five modules: digital synthesizer, transceiver, phase detector, data acquisition and data processing. The biophysical concept to measure inductive phase shift by MIS is shown.
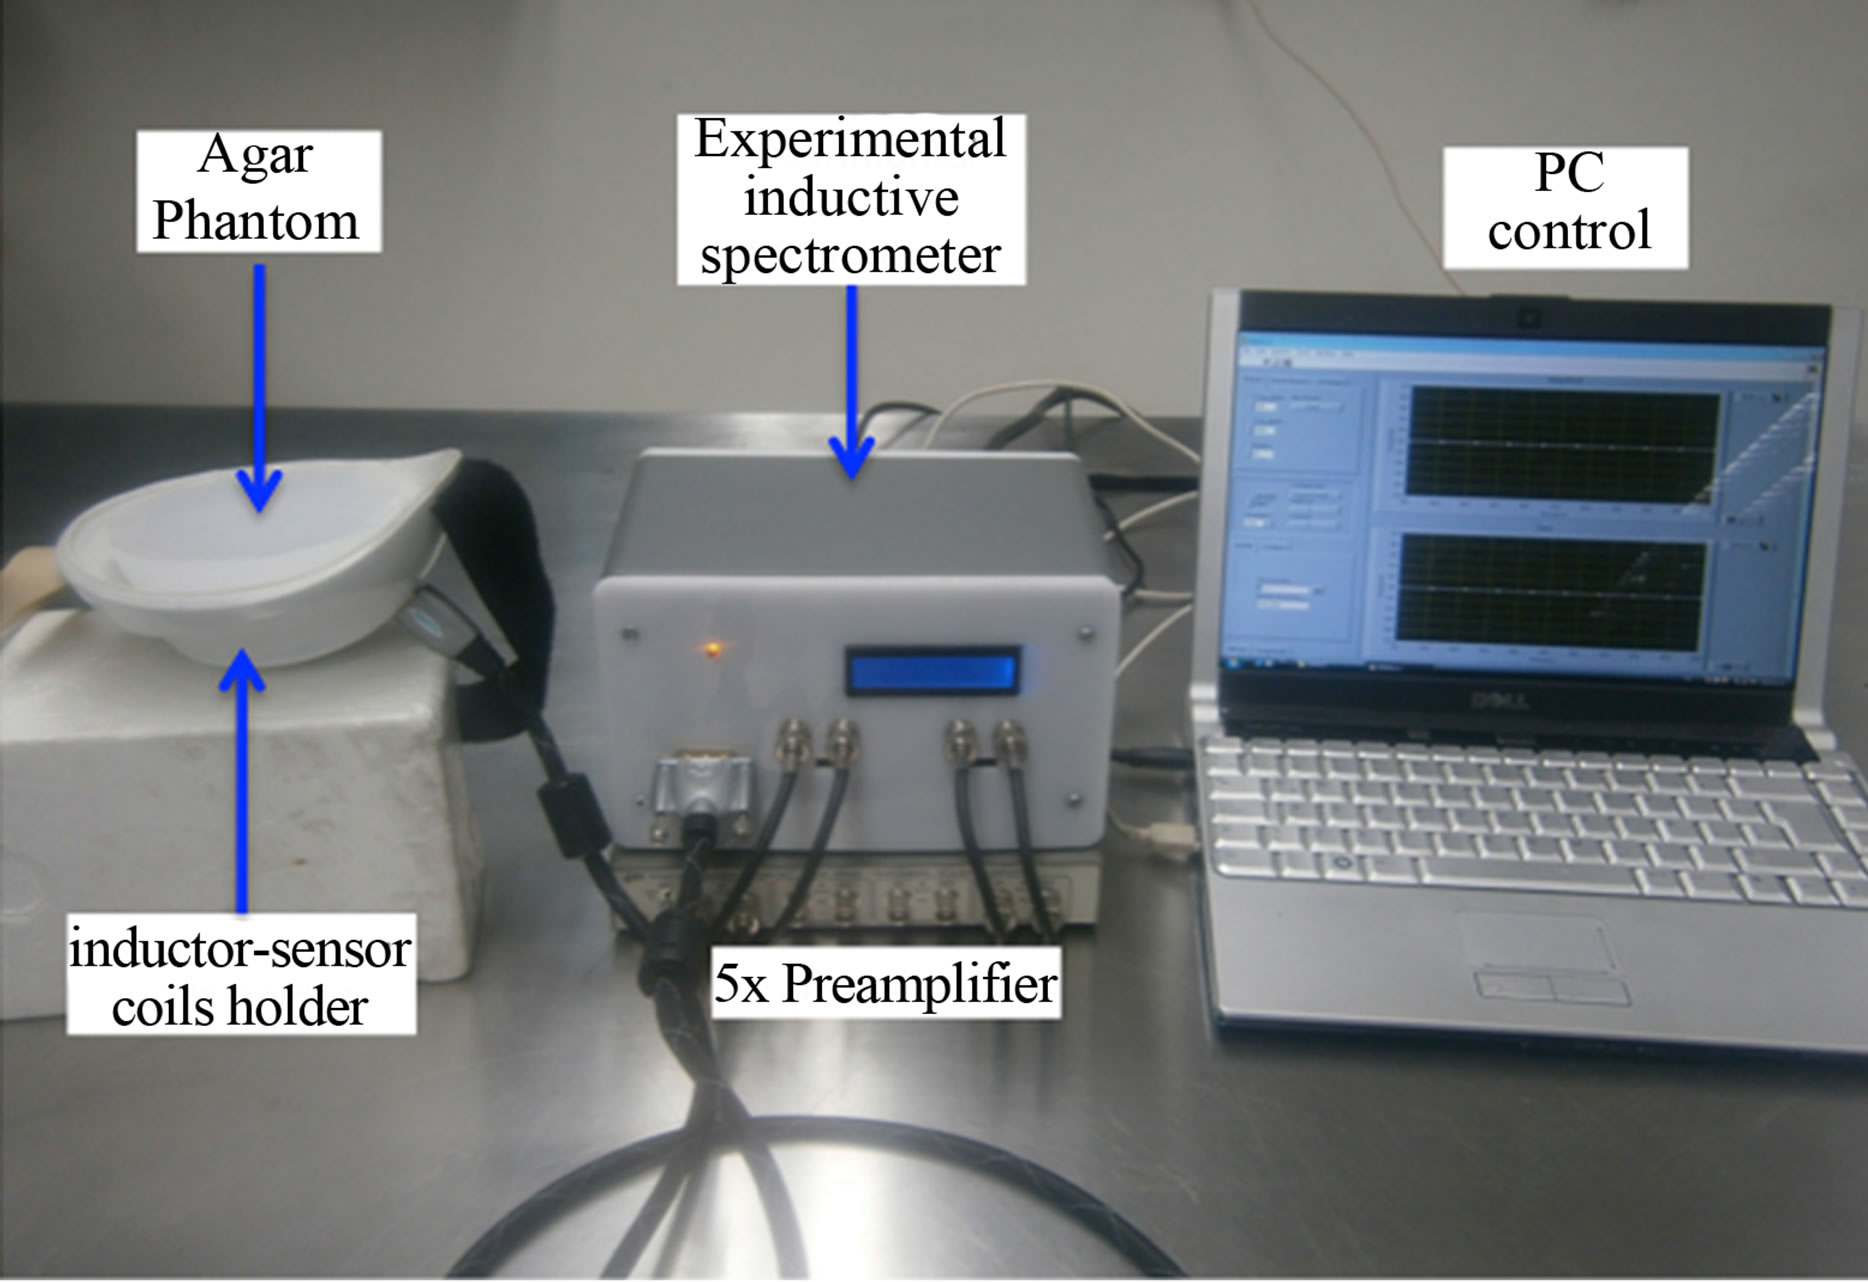
Figure 6. Experimental inductive spectrometer prototype manufactured to detect non-invasively malignant neoplasms in a typical breast volume by inductive phase shift measurements. Experimental setup to measure inductive phase shift in agar phantoms at preprogramed frequencies. Agar phantoms are placed in the arrangement of inductor-sensor coils coaxially centered on a plastic support ergonomically adapted to the mama anatomy.
section, and were placed in the arrangement of inductorsensor coils coaxially centered on the plastic support in such a way that keep the coil configuration showed in Figure 2. Spectra of inductive phase shift were measured by the experimental inductive spectrometer prototype manufactured at our laboratory, and at the frequencies described in previous subsections. Inductive phase shift values were estimated as homogenized data with respect to the semi-spherical breast agar without tumor cylinder. A picture of the experimental set-up is shown in Figure 6.
3. Results
The simulation of induced current density in biophysical breast models with four tumor positions as well as its corresponding agar phantoms are shown in Figure 7. The induced current density lines show a major concentration around the tumoral volume consistently with a major electrical conductivity determined in this region, interestingly; a major concentration of current lines is observed when the tumor position shifts to the center, this behaviour is a function of the bulk electrical properties of the breast and tumour volumes and must reflect the perturbation of the primary magnetic field and its generated inductive phase shift, which is detected as a composite magnetic field in the sensor coil. Figure 8 shows theoretical and experimental inductive phase shift estimations. To compare qualitative behaviors in the same dynamic range, every position data were homogenized with respect to the no-tumor phantom measurements (Δθ_Xcm/Δθ_no tumor). The obvious observation suggests that increments of inductive phase shift as a function of frequency are more evident in the phantom with tumor position in the center, this condition is coherent in both; analytical and experimental estimations, and seems reflect the effect of a major concentration of induced current density lines around the tumor volume as far as the tumor position shifts to the center, this observation is discussed in detail in following section.
4. Discussion
The analytical estimations indicate a major concentration of the induced current density lines as the tumor position shifts to the center, consistently; increments of theoretical and experimental inductive phase shift, as a function of frequency and when the tumor position shifts to the center are evident. The observations suggest that increments of the electrical conductivity (tumor volumes) in the central region of the biophysical model promotes major perturbbations of the primary magnetic field B. It could be explained by the Biot-Savart Law, which relates magnetic fields to the currents which are their sources. Electric current in a circular loop creates a magnetic field, which is more concentrated in the center and along the axis “z” of the loop (see axis “z” in Figure 2). The application of the Biot-Savart principle on the centerline of a current loop involves integrating the z-component in such a way
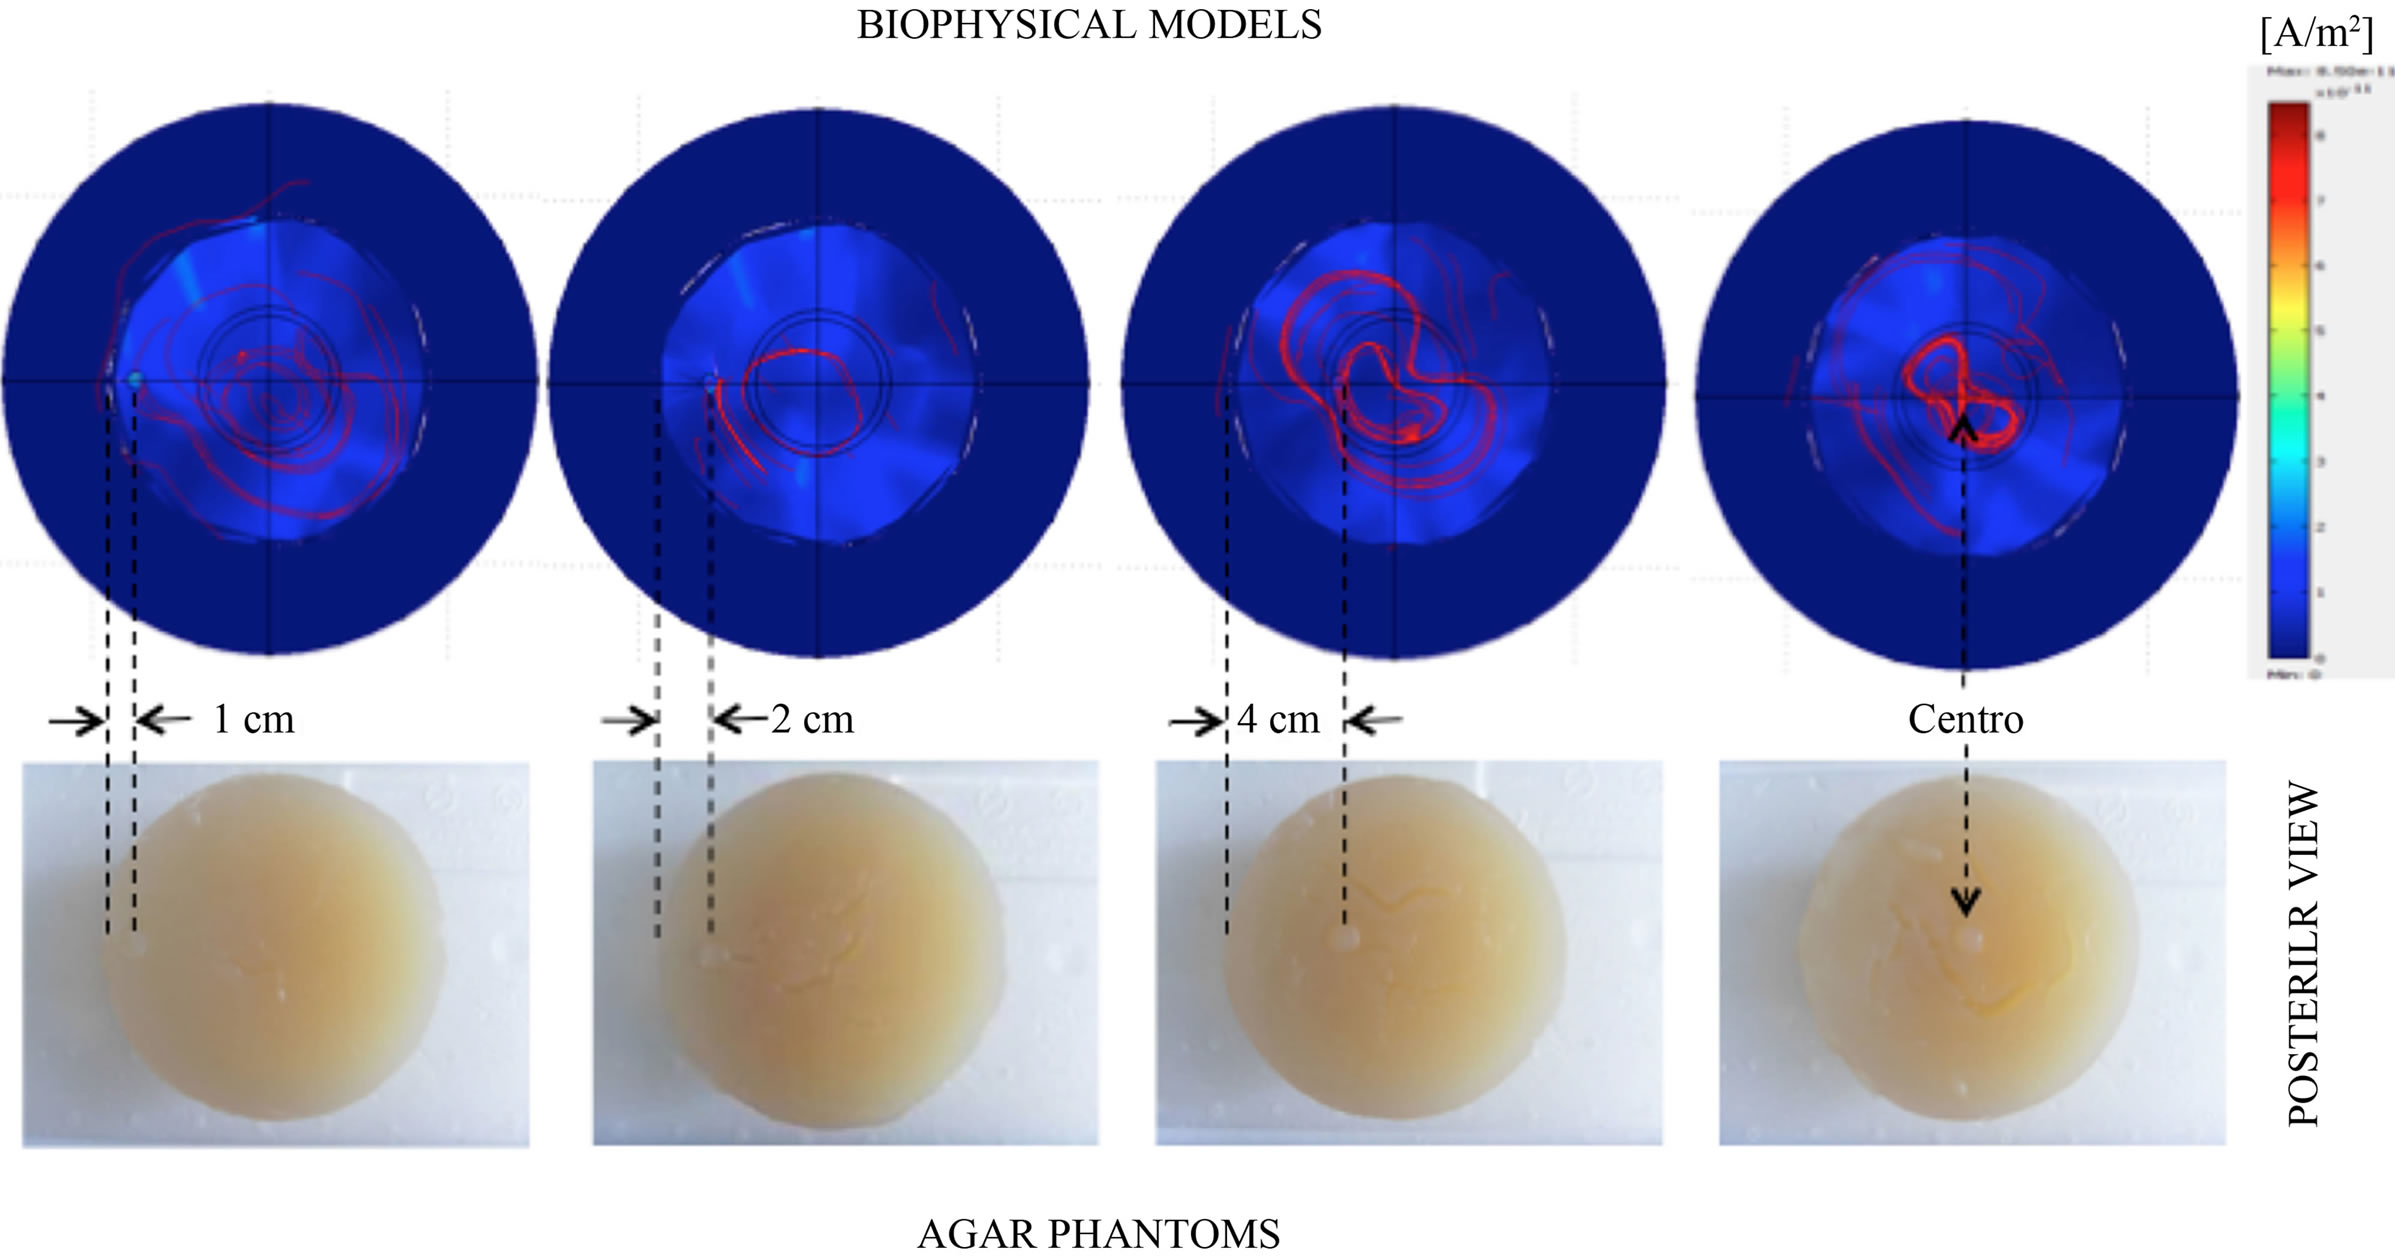
Figure 7. Simulation of the induced current densities in biophysical breast models with four tumor positions as well as its corresponding agar phantoms views. A major concentration of induced current density lines is observed when the tumor position shifts to the center.
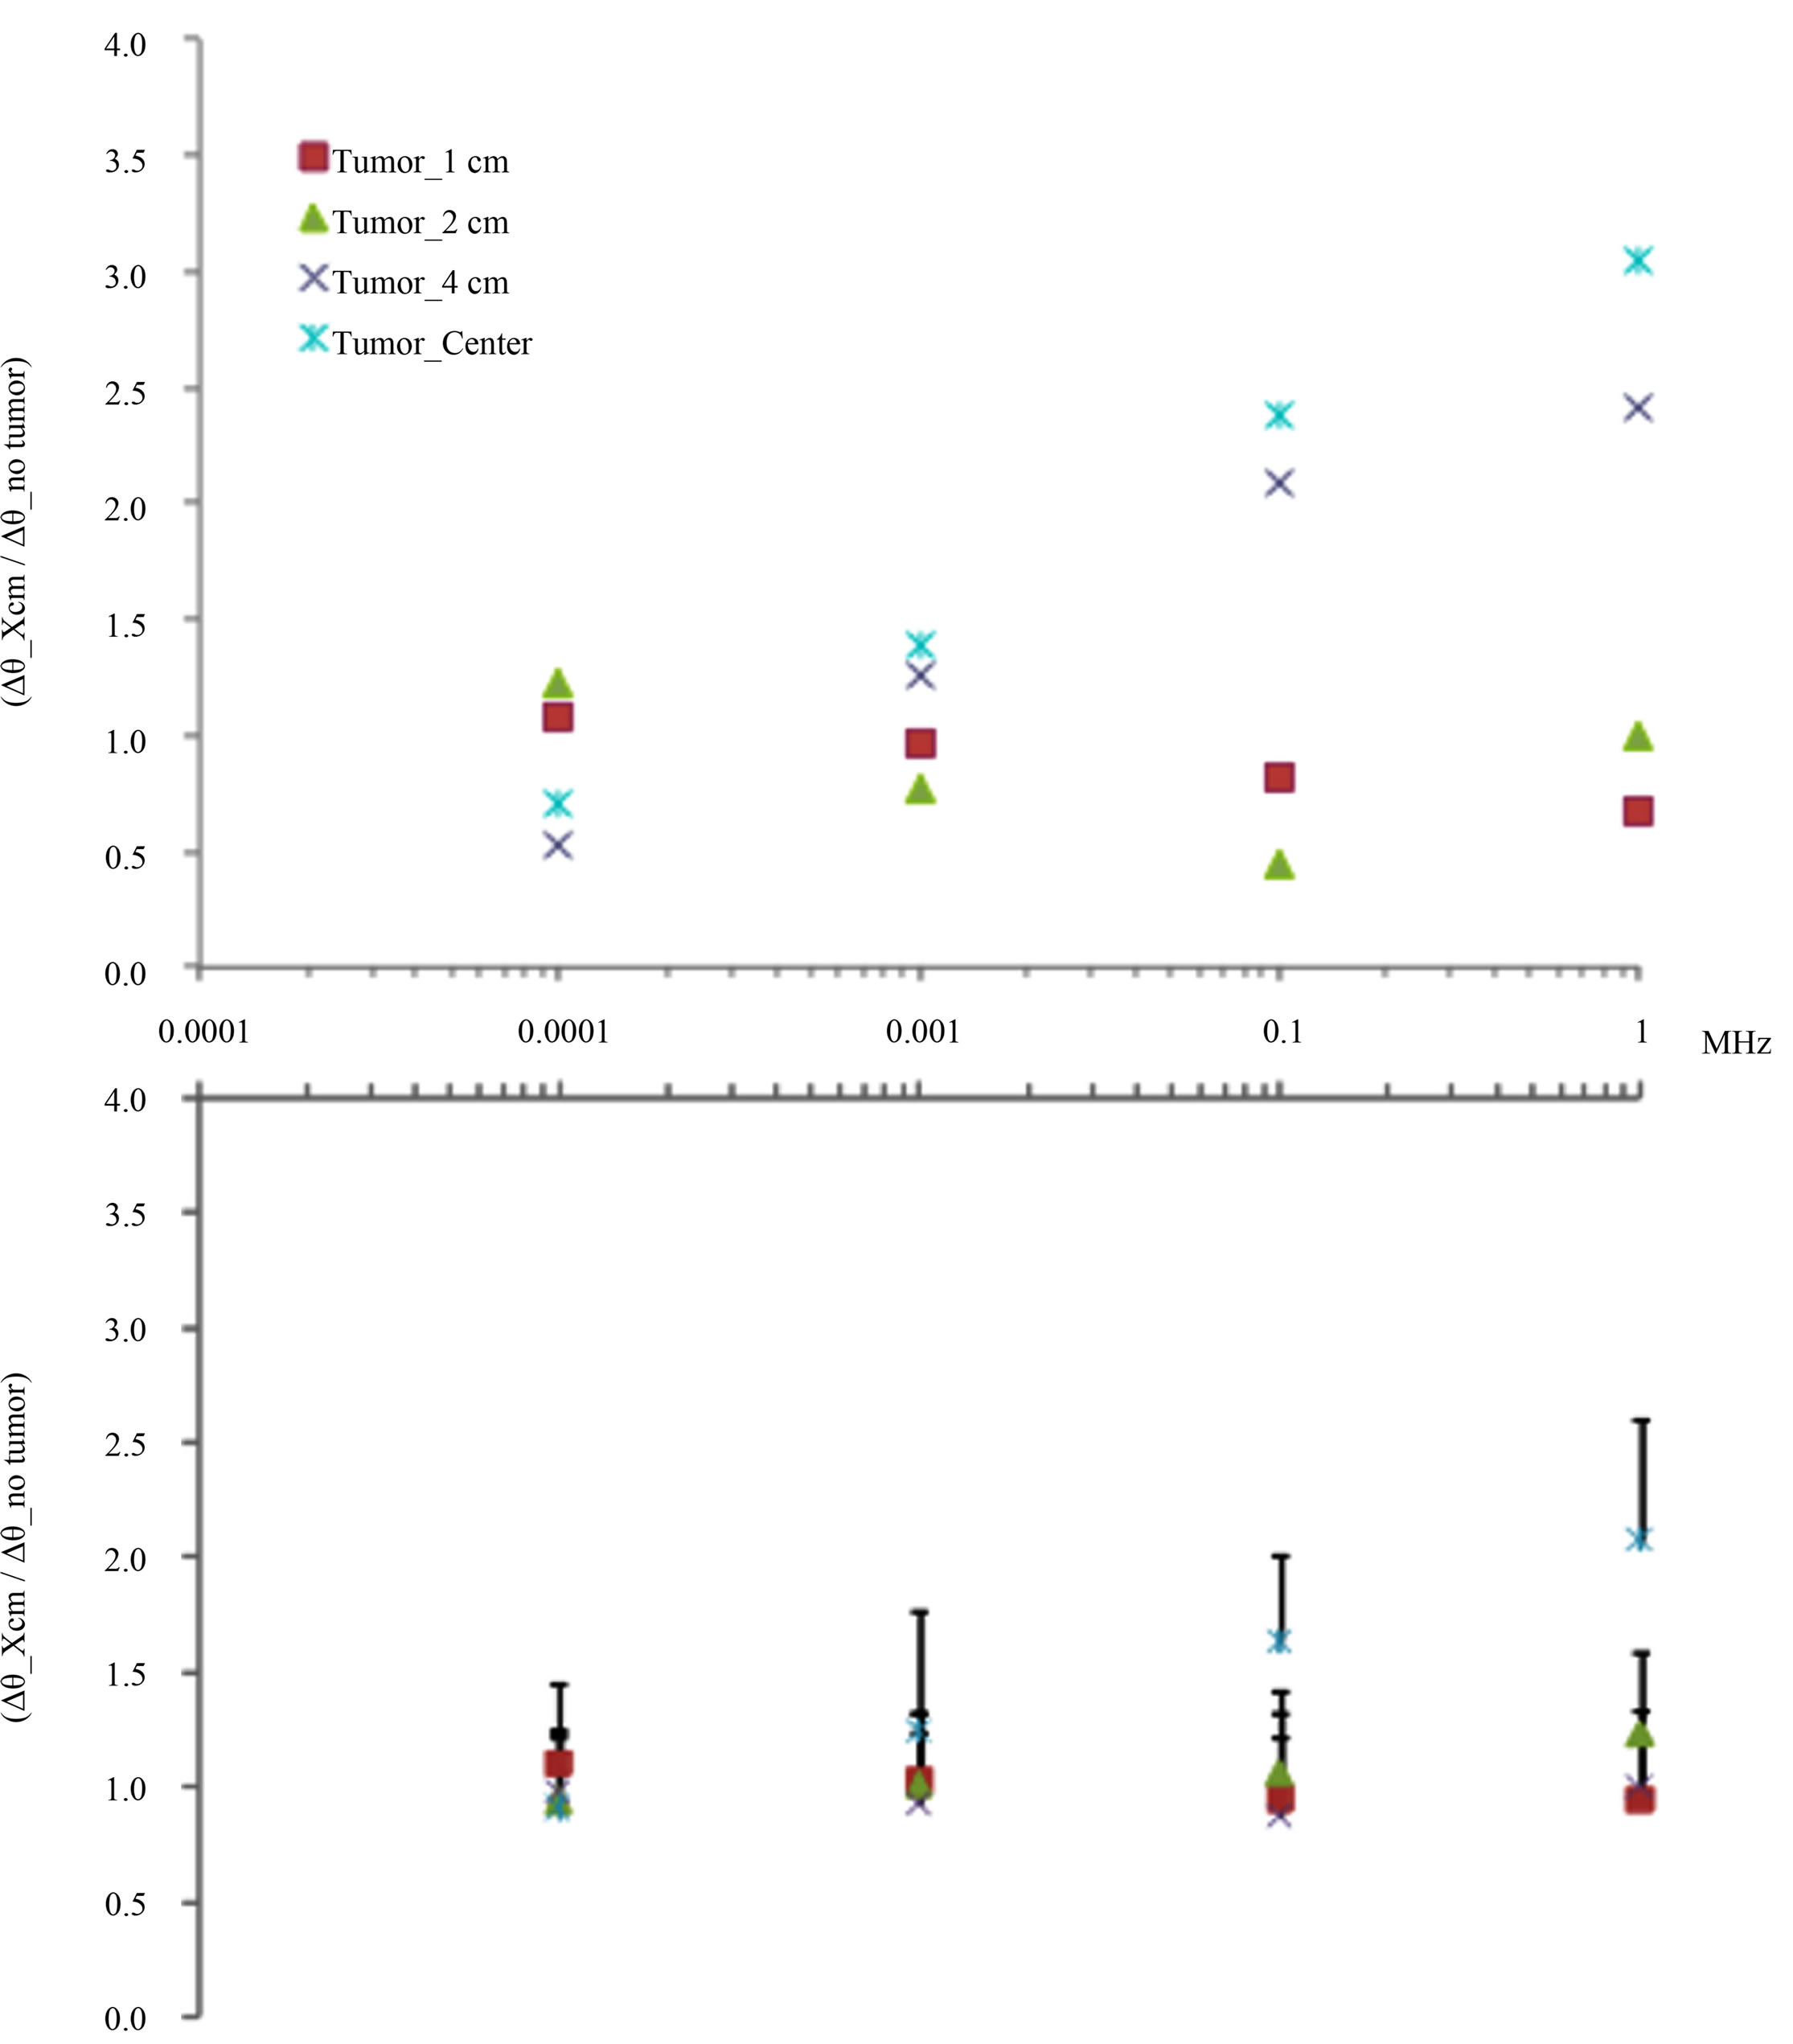
Figure 8. Theoretical estimations and experimental measurements of inductive phase shift in typical healthy-tumor breast tissue biophysical models (upper) and agar phantoms (lower) with four tumor positions (1, 2 and 4 cm, as well as in the center with respect to the external border). To compare qualitative behaviors, every position data were homogenized with respect to no-tumor phantom estimation and measurements (Δθ_Xcm/Δθ_no tumor). Increments of inductive phase shift as a function of frequency are more evident in the phantom with tumor position in the center.
than the magnetic field at a distance along the axis “z” of the loop is given by:
 (5)
(5)
where R = 2.75 cm and I = 10 mA are the radius and current of the loop respectively. Accordingly to the defined geometrical and electrical model parameters, the estimated magnetic field at the center of the coil (z = 0), is approximately Bz=0 = 11.42 mG. Given the cylindrical symmetry of the model configuration, the magnitude B at the four tumor positions are calculated by its components Bz and By only, thus; the magnetic field magnitude in terms of Bz=0 at the four evaluated tumor positions (z = 5 cm, y = 5 cm), (z = 5 cm, y = 4 cm), (z = 5 cm, y = 2 cm) and (z = 5 cm, y = 0 cm) calculated on the basis of Biot-Savart Law and the numerical method reported in [20] are approximately 0.046Bz=0, 0.062Bz=0, 0.097Bz=0, and 0.113Bz=0 respectively. Then, the effect of a concentric distribution of the magnetic flux density given by the geometrical configuration of the inductor element is evident when changes in electrical conductivities are focused in concentric positions inside the model.
The observed increments of magnetic inductive phase shift, as a function of frequency must be limited by the skin depth effect, a calculation of the penetration depth (δ) as a function of frequency for saline was done according to the expression: , where μ0 is the permeability of free space. The fluid was taken as a 0.9% NaCl solution with electrical conductivities of 1.93 S/m and a relative permittivity εr = 80. The result shows that at 1 MHz, the skin depth is around 36 cm, this value is larger than the thickness of the biophysical model evaluated (5 cm), then; losses by the skin depth effect is negligible and the experimental results correspond to the coupling in the close field, where the electrical conductivity of the coupling material (tissue volumes) play a relevant role.
Given the explored bandwidth, the electrical conductivity of NaCl 0.9% and 3% should not vary with frequency because ionic solution exhibit no dielectric dispersion [13], therefore; in the agar phantoms evaluated the inductive phase shift observed must be influenced mostly by the tumoral position. In this sense, EIM measurments by the proposed coils configuration seems to have the hability to detect non-invasively neoplasms volumes as small as 1 ml, even located towards the interior of a characteristic breast tissue volume; where detection by physical palpation has limitations. In practice is possible that experimental artefacts as parasite capacitances might introduce frequency-dependent variations.
5. Conclusion
The analytical and experimental observations suggest that EIM measurments have a potential value to detect non-invasively small neoplasms (1 ml) inside a characteristic breast tissue volume, and the proposed coils configuration seems to have technical viability to detect neoplasms located towards the interior of breast tissues.
6. Acknowledgements
This material is based upon work supported by a grant of the “Programa de Igualdad entre Mujeres y Hombres SEDENA 2012”, dependent of the Ministry of Defense, México.
REFERENCES
- J. Stagg, R. W. Johnstone and M. J. Smyth, “From Cancer Immunosurveillance to Cancer Immunotherapy,” Immunological Reviews, Vol. 220, No. 1, 2007, pp. 82-101. doi:10.1111/j.1600-065X.2007.00566.x
- F. M. Knaul, G. Nigenda, R. Lozano, et al., “Breast Cancer in Mexico: A Pressing Priority,” Reproductive Health Matters, Vol. 16, No. 32, 2008, pp. 113-123.
- World Health Organization, “Breast Cancer: Prevention and Control,” 23 April 2012. http://www.who.int/topics/cancer/breastcancer/es/index1.html
- H. Scharfetter, W. Ninaus, B. Puswald, G. I. Petrova, D. Kovachev and H. Hutten, “Inductively Coupled Wideband Transceiver for Bioimpedance Spectroscopy (IBIS),” Annals of the New York Academy of Sciences, Vol. 873, 1999, pp. 322-334. doi:10.1111/j.1749-6632.1999.tb09480.x
- J. C. Newell, P. M. Edic, X. Ren, J. L. Larson-Wisemanand and M. D. Danyleiko, “Assessment of Acute Pulmonary Edema in Dogs by Electrical Impedance Imaging,” IEEE Transaction on Biomedical Engineering, Vol. 43, No. 2, 1996, pp. 133-138. doi:10.1109/10.481982
- D. S. Holder, C. A. Gonzalez-Correa, T. Tidswell, A. Gibson, G. Gusick and R. H. Bayford, “Assessment and Calibration of a Low-Frequency System for Electrical Impedance Tomography (EIT), Optimized for Use in Imaging Brain Function in Ambulant Human Subjects,” Annals of the New York Academy of Sciences, Vol. 873, 1999, pp. 512-519. doi:10.1111/j.1749-6632.1999.tb09500.x
- H. Griffiths, W. R. Steward and W. Gough, “Magnetic Induction Tomography—A Measuring System for Biological Materials,” Annals of the New York Academy of Sciences, Vol. 873, 1999, pp. 335-345 doi:10.1111/j.1749-6632.1999.tb09481.x
- H. Griffiths, “Magnetic Induction Tomography,” Measurement Science and Technology, Vol. 12, No. 8, 2001, pp. 1126-1131. doi:10.1088/0957-0233/12/8/319
- S. Watson, R. J. Williams, W. A. Gough and H. Griffiths, “A Magnetic Induction Tomography System for Samples with Conductivities Less than 10 s·m−1,” Measurement Science and Technology, 2008, Vol. 19, No. 4, pp. 5501- 5511. doi:10.1088/0957-0233/19/4/045501
- S. Al-Zeiback and N. H. Saunders, “A Feasability Study of in Vivo Electromagnetic Imaging,” Physics in Medicine and Biology, Vol. 38, No. 1, 1993, pp. 151-160. doi:10.1088/0031-9155/38/1/011
- A. V. Korzhenevskii and V. A. Cherepenin, “Magnetic Induction Tomography,” Journal of Communications Technology and Electronics, Vol. 42, No. 4, 1997, pp. 469- 474.
- A. V. Korjenevsky and V. A. Cherepenin, “Progress in Realization of Magnetic Induction Tomography,” Annals of the New York Academy of Sciences, Vol. 873, 1999, pp. 346-352. doi:10.1111/j.1749-6632.1999.tb09482.x
- H. Y. Wei and M. Soleimani, “Three-Dimensional Magnetic Induction Tomography Imaging Using a Matrix Free Krylov Subspace Inversion Algorithm,” Progress in Electromagnetics Research, Vol. 122, 2012, pp. 29-45. doi:10.2528/PIER11091513
- E. C. Burdette, “Electromagnetic and Acoustic Properties of Tissues in Pyisical Aspects of Hyperthermia,” American Association of Physicist in Medicine, Vol. 8, 1982, pp. 105-150.
- C. Gabriel, A. Peyman and E. H. Gran, “Electrical Conductivity of Tissue at Frequencies below 1 MHz,” Physics in Medicine and Biology, Vol. 54, No. 16, 2009, pp. 4863-4878. doi:10.1088/0031-9155/54/16/002
- E. M. Purcell, “Electricity and Magnetism, Berkeley Physics Course,” Berkeley Physics, Vol. 2, 1984, pp. 263- 265.
- C. A. Gonzalez, R. Rojas and B. Rubinsky, “Circular and Magnetron Inductor/Sensor Coils to Detect Volumetric Brain Edema by Inductive Phase Shift Spectroscopy: A Sensitivity Simulation Study,” Proceedings of the 13th International Conference on Electrical Bioimpedance and 8th Conference on Electrical Impedance Tomography, Graz, 29 August to 2 September 2007, pp. 315-319.
- A. D. Taghjian and S. R. Best, “Impedance, Bandwidth, and Q of Antennas,” IEEE Transactions on Antennas and Propagation, Vol. 53, No. 4, 2005, pp. 1298-1325. doi:10.1109/TAP.2005.844443
- S. A. Solazzo, Z. Liu, M. Lobo, et al., “Radiofrequency Ablation: Importance of Background Tissue Electrical Conductivity—An Agar Phantom and Computer Modeling Study,” Radiology, Vol. 236, 2005, pp. 495-502. doi:10.1148/radiol.2362040965
- A. Franco, “Física Con Ordenaor,” 30 May 2012. http://www.sc.ehu.es/sbweb/fisica_/elecmagnet/campo_magnetico/espira/espira_1.xhtml
NOTES
*Corresponding author.