International Journal of Communications, Network and System Sciences
Vol.10 No.07(2017), Article ID:77663,13 pages
10.4236/ijcns.2017.107007
QoE Assessment of Fairness between Players in Networked Virtual 3D Objects Identification Game Using Haptic, Olfactory, and Auditory Senses
Ryo Arima, Mya Sithu, Yutaka Ishibashi
Graduate School of Engineering, Nagoya Institute of Technology, Nagoya, Japan

Copyright © 2017 by authors and Scientific Research Publishing Inc.
This work is licensed under the Creative Commons Attribution International License (CC BY 4.0).
http://creativecommons.org/licenses/by/4.0/


Received: May 11, 2017; Accepted: July 11, 2017; Published: July 14, 2017
ABSTRACT
In this paper, we carry out QoE (Quality of Experience) assessment to investigate influences of olfactory and auditory senses on fairness for a networked virtual 3D object identification game with haptics. In the game, two players try to identify objects which are placed in a shared 3D virtual space. In the assessment, we carry out the game in four cases. Smells and sounds are presented in the first case, only sounds are done in the second case, and only smells are done in the third case. In the last case, we present neither smell nor sound. As a result, we demonstrate that the fairness deteriorates more largely as the difference in conditions between two users becomes larger.
Keywords:
Networked Game, Object Identification, Haptic Sense, Olfactory Sense, Auditory Sense, Fairness, QoE

1. Introduction
By using haptic and olfactory senses in addition to visual and auditory senses, various kinds of multisensory communications become utilizable for users at remote different places [1] [2] [3] [4] . With the advantage of multisensory communications, we can realize various applications such as networked games, arts, entertainment, and remote education with high sense of presence [5] - [10] . To provide higher sense of presence to users, a number of researchers have been investigating effects of the senses on Quality of Experience (QoE) [11] by dealing with a variety of multisensory communications.
In [6] , Murray et al. investigate human perception on synchronization errors between olfactory and visual media, and those between olfactory and audio- visual media by QoE assessment. They show that the allowable range of media synchronization error between olfactory and audio-visual media is much larger than that between olfactory and visual media with the advantage of synchronized audio and visual media. From results of QoE assessment using several video clips with olfaction, Ghinea et al. also show that the combinations of olfactory sense with other senses lead to increase of the sense of presence [7] . In [6] [7] [8] [9] [10] , by using olfaction for several types of games in virtual environments, it is illustrated that the sense of presence and users’ enjoyment for the games can be enhanced largely. Although there are various types of work for QoE on the sense of presence for several kinds of applications in networked virtual environments, investigations for other QoE parameters are not necessarily enough; for example, fairness between players in networked games is not investigated sufficiently. In the networked games, not only the sense of presence, fairness between players is also important to reflect the game ability of each player to win-loss records. However, we cannot sometimes use some senses by sickness, injury, surroundings, and so on.
In [12] , the authors examine influences of the difference in time until smells reach players on QoE about the fairness. As a result, they illustrate that as the time difference becomes larger, the fairness deteriorates. In [13] , the authors investigate the influence of network delay on the fairness between two players in a balloon bursting game with olfactory and haptic senses by QoE assessment. As a result, they find that the allowable range of absolute difference in network delay is within around 150ms. They also illustrate that MOS (Mean Opinion Score) [14] of fairness can be estimated from the average difference in the number of correct judgments or the delay difference with a high degree of accuracy. From the results in [12] and [13] , we can know the relationship between the fairness and the factors, the time difference and the delay difference. There may be other factors which largely affect the fairness between players. However, what kinds of factors largely affect the fairness is not necessarily clear enough. Thus, we need to assess the fairness in various networked games. In [15] , the authors carry out an experiment to investigate how much correctly 3D objects are identified with haptic, olfactory, and auditory senses in a virtual environment by using an object identification system. As a result, they illustrate that the object identification accuracy can be improved largely by adding sounds and smells to the objects. However, the system is standalone, and we also need to assess the influence of olfactory and auditory senses on the fairness in networked games. In such games, whether olfactory/auditory sense is used or not may strongly affect the fairness, and it is very important to investigate the influence in the networked games.
In this paper, we investigate the influence of olfactory and auditory senses on the fairness by QoE assessment for a networked virtual 3D object identification game with haptics by switching four cases depending on whether olfactory and auditory senses are employed or not. In the first case, olfactory and auditory senses are employed. Only auditory sense is done in the second case, and only olfactory sense is done in the third case. In the last one, neither olfactory nor auditory sense is done. The remainder of this paper is organized as follows. Section 2 describes our networked virtual 3D object identification game. The assessment system is outlined in Section 3. Assessment results are presented in Section 4, and Section 5 concludes the paper.
2. Networked Virtual 3D Object Identification Game
The system configuration of the game is shown in Figure 1, where each PC has a display, a haptic interface device (Geomagic Touch [16] ), a headset, and an olfactory display (SyP@D2 [17] ). The two PCs are connected to each other via a network. The game is developed by enhancing the virtual 3D object identification system with haptic, olfactory, and auditory senses [15] so that two players can play.
In the game, two players try to identify each object which is placed in a shared 3D virtual space (see Figure 1), and they cannot see the object initially because the screen is black. We use nine objects which have different features such as the shape, softness, smell, sound, smoothness, and characteristics (see Figure 2 and Table 1). We selected nine objects which have smells or sounds from among sixteen ones in [15] in order to clarify effects of olfactory and auditory senses well. In the virtual space of Figure 1, there are four objects actually; each question symbol indicates where an object exists in the space, and we can see two objects (high-hat cymbals and grapefruit) in the space for the reason mentioned later. Each player operates his/her haptic interface device to move a cursor of the device in the virtual space. While the player touches an object with the cursor (see the virtual space in Figure 1), he/she perceives the reaction force through the device and can recognize the shape and softness of the object.
The reaction force F is calculated by using the spring-damper model [18] as follows:
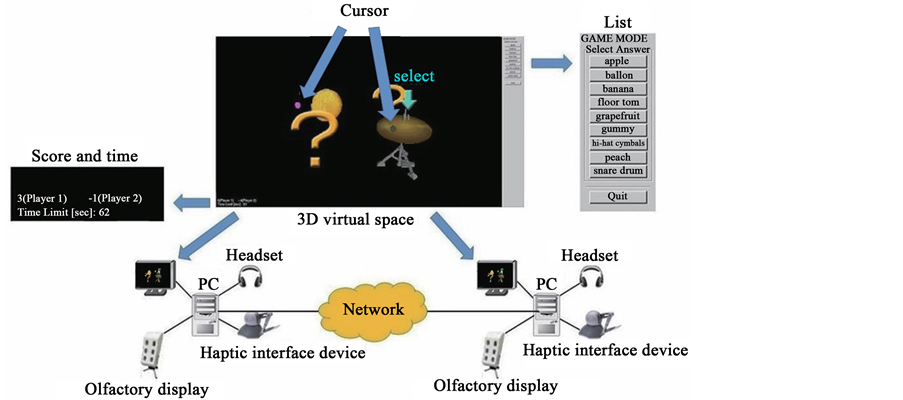
Figure 1. System configuration of networked virtual 3D objects identification.

Figure 2. Displayed images of objects.

Table 1. Shapes, softness, smell, sounds, and characteristics of objects.
(1)
where Ks is the spring coefficient, Kd is the damper coefficient, is defined as a vector from the contact point of the object surface to the cursor of the haptic interface device | | denotes the penetration depth), and is the velocity of the cursor (see Figure 3). If the cursor is not in contact with the object surface, the values of and are equal to zero.
If an object has a sound (e.g., snare drum), he/she can hear a sound via the headset when he/she hits the surface of the object excluding balloon. Balloon is burst and disappeared when he/she pushes it strongly with the device; then, he/she hears a sound of bursting via the headset. If an object has a smell (e.g., apple), he/she can perceive the smell of the object generated from the olfactory display by moving it toward his/her viewpoint (i.e., by bringing it close to front) as in [12] . The olfactory display outputs the smell by blowing air into a smell cartridge attached to the main body.
In this paper, we assume that the smell of a fruit reaches a certain distance from the center of the fruit as in [12] . In other words, the range which the smell reaches is a sphere as shown in Figure 4. The sphere is called the smell space
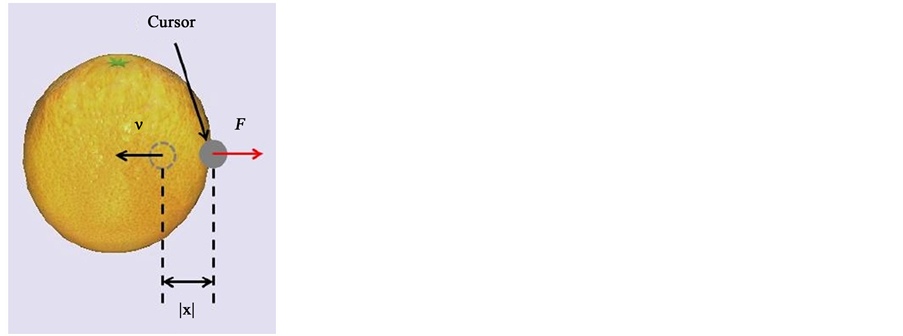
Figure 3. Reaction force when surface is touched by haptic interface device.
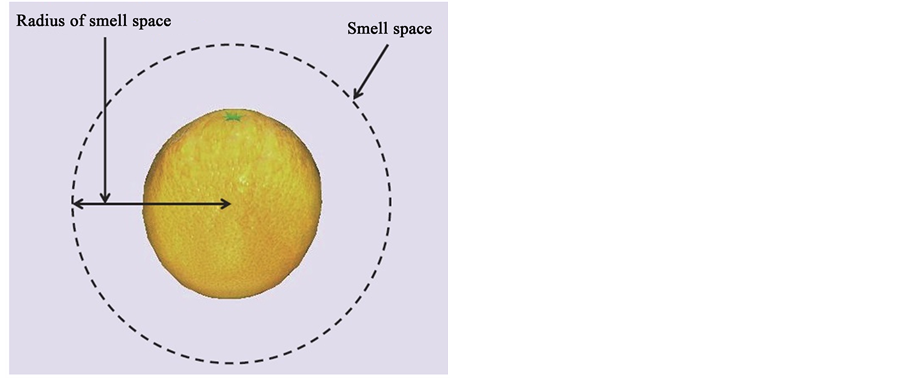
Figure 4. Smell space of fruit.
[19] (corresponds to the aroma aura in [20] ). When the viewpoint of a player enters the smell space of a fruit, the smell of the fruit is diffused by SyP@D2. When the viewpoint of the player goes out of the smell space, the diffusion of the smell is stopped. In this paper, we make sizes of the fruits in the virtual space and the radius of the smell space to be approximately the same to those in [12] . We set the distance between the olfactory display and each player’s nose to 0.3 m as in [12] . It takes about two seconds on average for the smell to reach the player. Although the output timing of the sound and smell is different in this system, we do not try to adjust this because of the following two reasons. The first reason is that in a real world, output timings of sound and smell of objects are not the same. A user can hear a sound of an object as soon as he hits the object, but he needs to take the object close to his nose to get a smell. The second reason is that we investigate the fairness by focusing on the presence/absence of olfactory or auditory senses, not focusing on their output timings. When we run the game, a white board appears at center of the virtual space and two cursors appear under the board. When the two cursors touch the board from above, the game starts (see Figure 5(a)). The purpose is to maintain the fairness high at the beginning of the game by setting the positions of the cursors at almost the same location. Then, the board disappears and four objects are placed. Each question symbol is
 (a)
(a)
 (b)
(b)
 (c)
(c)
 (d)
(d)
 (e)
(e)
Figure 5. Displayed images of virtual space. (a) Start of game; (b) Object selection; (c) Correct answer; (d) Three correct answers; (e) End of game.
displayed at a location where an object exists in the space (see Figure 5(b)). When a cursor that each player moves by using a haptic interface device touches the object, the word “select” is displayed above the object and the object is selected to answer what it is (see Figure 5(b)). The object continues to be selected until he/she touches another object. In the virtual space of each player, a cursor of the other player is displayed, but the word “select” of the other player is not displayed.
When each player identifies the selected object, he/she answers the object’s name by using a mouse from among a list (see Figure 1). If his/her answer is correct, the object appears (Figure 5(c)) as mentioned earlier, and he/she gets one point. Otherwise, the object does not appear and he/she loses one point. The two players can select the same object simultaneously as shown in Figure 5(d). The players’ score and time to the end of the game are displayed at the lower left corner of the virtual space (Figure 1). In this way, the two players compete for the score.
3. Assessment System
In our assessment, we connect the two PCs directly by an Ethernet cable (100BASE-TX) instead of the network in Figure 1. Subjects assess the fairness of the game in four cases (Smell & Sound, Sound, Smell, and None). Smells and sounds are presented in Case Smell & Sound, only sounds are done in Case Sound, and only smells are done in Case Smell. In Case None, we present neither smell nor sound. We employ haptic sense in all the cases. When the conditions of a pair of subjects are the same as each other, the game is regarded as fair [12] . We do not tell the subjects what their conditions are. The order of the cases provided to each subject is random. Four objects randomly-selected from among nine objects are placed in the 3D virtual space. When the pair answers all the four objects correctly (see Figure 5(e)) or the time in the game exceeds 90 seconds, new four objects are placed again until the end of game. Totally twelve objects are used in each stimulus (i.e., each game competition).
Before the assessment, we first explained the shape, softness, smell, sounds and characteristics of the nine objects to subjects. Each pair of subjects practiced the game in Case None, where the game is fair. We regarded a score in this case as the standard score. After the practice, whenever the game finishes, each subject was asked to give a value of 1 to 5 for each stimulus based on the five-grade quality scale (see Table 2) by comparing to the standard score, and they took a rest for two minutes. We obtained MOS by averaging the values of all the subjects. The room temperature was set to 26˚C [13] . Each subject operated the haptic interface device and the mouse with only the dominant hand. In this work, we carried out the assessment with 16 subjects [11] (males) whose ages were between 22 and 24. It is also important to carry out QoE assessments with females and people (both males and females) with different ages to know whether there is a gender and age biases on assessment results or not. This is our future work.
Table 2. Five-grade quality scale.
4. Assessment Results
In Figure 6, we show MOS of fairness for combinations of the four cases presented to each pair of subjects. For example, the combination of (Case Sound, Case Smell) means that Case Sound is presented to a subject of the pair and Case Smell is presented to the other subject. In Figure 7, we plot MOS of fairness for each case in every combination. In the figure, for example, the combination of (Case Sound, Case Smell) means that the left bar shows MOS of Case Sound and the right bar shows that of Case Smell. Figure 8 shows the number of correct answers for each combination of cases. Also, in Figure 9, we show the number of correct answers for each case in every combination. Moreover, the number of incorrect answers for each combination is drawn in Figure 10, and the number of incorrect answers for each case in every combination is plotted in Figure 11. The 95% confidence intervals are also plotted in all the figures.
From Figure 6, we see that MOS values are high in (Case Smell & Sound, Case Smell & Sound), (Case Sound, Case Sound), (Case Smell, Case Smell), and (Case None, Case None). This is because the subjects are in the same condition, and they feel the fairness high. We carried out T-test [21] to examine whether significant differences. As a result, we noticed that there is no significant difference between conditions with 5% level of significance between the four conditions. We also find in Figure 6 that MOS becomes smaller as the number of different conditions of a pair of subjects becomes larger. In (Case Smell & Sound, Case None) and (Case Sound, Case Smell), we see that the MOS values are low because there are two different conditions between subjects of each pair. For example, in (Case Smell & Sound, Case None), one of the subjects can perceive both smells and sounds of objects when the other subject can perceive neither smell nor sound. Also, in (Case Smell & Sound, Case Sound) and (Case Smell & Sound, Case Smell), there is only one different condition between the two subjects. Therefore, the MOS values are higher than those of the combinations which have two different conditions between the subjects. As a result of T-test, we noticed that there are significant differences between the conditions. However, in Figure 6, even though the number of different conditions is the same, MOS of (Case Smell & Sound, Case Smell) is smaller than that of (Case Smell\&Sound, Case Sound). The reason is as follows. In order to perceive the smell of an object, a subject has to move an object closer to his viewpoint. Thus, it is easy to find the different conditions between himself/herself and the oppo-
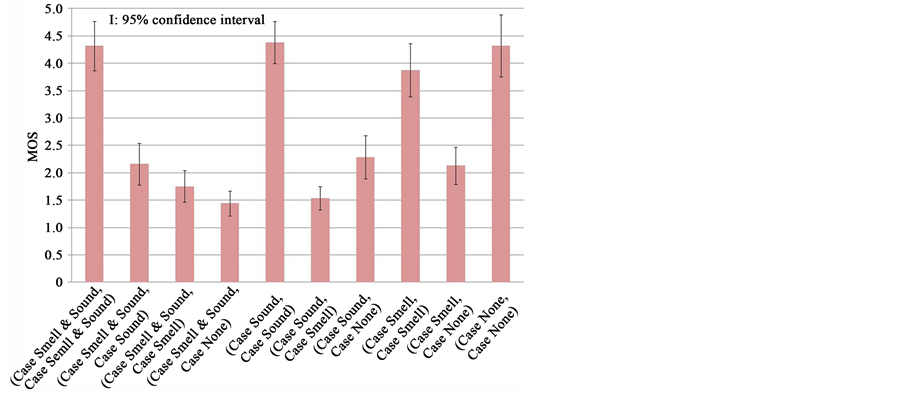
Figure 6. MOS of fairness for combinations of cases.

Figure 7. MOS of fairness for each case of combination.
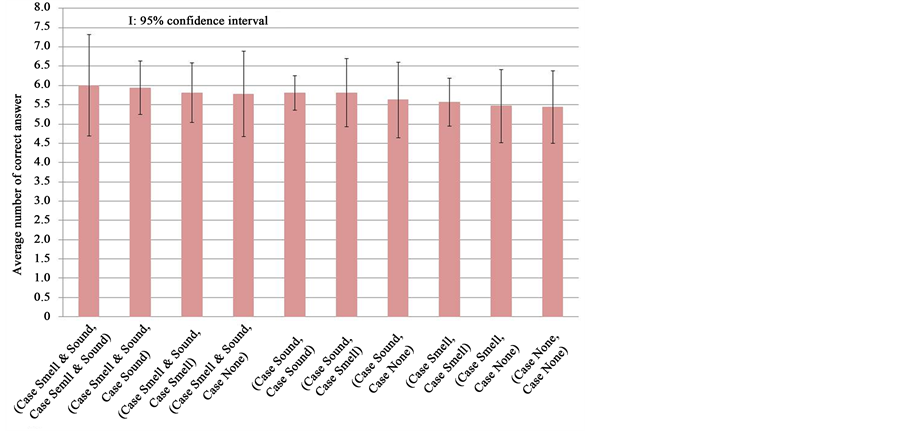
Figure 8. Average number of correct answers for combinations of cases.

Figure 9. Average number of correct answers for each cases of combination.
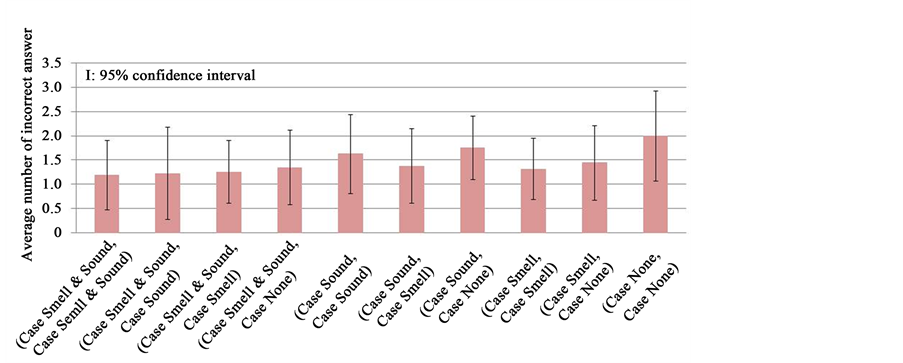
Figure 10. Average number of incorrect answers for combinations of cases.

Figure 11. Average number of incorrect answers for each case of combination.
nent from the movement of the object in the virtual environment. For the same reason, MOS of (Case Smell, Case None) is also smaller than that of (Case Sound, Case None). From the analysis of T-Test, we also see that there are significant differences between the combinations.
From Figure 7, we find that MOS of a subject of each pair who uses more senses is somewhat larger than that of the other subject of the pair. For example, in (Case Smell & Sound, Case None), MOS of a subject in Case Smell & Sound is larger than that of a subject in Case None. This means that the subject who uses less senses easily notice the difference conditions between himself/herself and his/her opponent.
In Figure 8, we cannot see large differences among the numbers of correct answers for the combination of cases. As the maximum number of correct answers is twelve, we get the average value about 6.
Figure 9 reveals that a subject who uses more senses than his opponent obtains more scores. In (Case Sound, Case Smell), the number of correct answers in Case Sound is larger than that in Case Smell. This is because the subject of Case Sound can answer faster than the opponent as he can hear a sound as soon as he hits an object with sound. Note that it takes about two seconds on average for a smell to reach a subject. Therefore, he gets chance to be able to identify more number of objects than the opponent.
From Figure 10, we notice that the number of incorrect answers of the subject who can perceive smell is smaller than the subject who cannot perceive the smell. For example, in (Case Sound, Case None) and (Case Smell, Case None), the average number of incorrect answers in (Case Smell, Case None) is smaller than that in (Case Sound, Case None). This is because the number of objects with smell is larger than the number of objects with sounds. That is, the five objects have smells, and the four objects have sounds. Also, whether olfaction is presented or not, balloon (i.e., one of soft objects) can be easily distinguished from gummy candy, which is the other soft object. Therefore, there are more opportunities for a subject who can perceive smells to make correct answers. In Figure 11, we also note that the subject who can perceive smells make less incorrect answers than his opponent. For example, in (Case Sound, Case Smell), the average number of incorrect answers in Case Smell is smaller than that in Case Sound.
5. Conclusions
In this paper, we investigated the influence of whether olfactory and auditory senses are used or not on the fairness between players in a networked virtual 3D object identification game with haptics by carrying out QoE assessment. As a result, we found that MOS of fairness is large when a pair of subjects is in the same conditions, and it is small when they are in different conditions. We also noticed that MOS when only smell is presented is smaller than that when only sounds are done. We further illustrated that MOS becomes smaller as the number of different conditions of a pair of subjects becomes larger. We saw that MOS values are different among the pairs of subjects depending on the type of perceived media even though there exists the same number of different conditions for the pairs. These results may help to game developers when they take measures for game design in terms of fairness in the virtual environment.
As our future work, we need to obtain more generalized results about fairness. To this end, we will add new types of objects in the game to assess the fairness. For example, it is important to carry out the assessment by using other types of smells. Effects of olfactory sense should be investigated in several types of networked multisensory applications. We will further carry out the assessment with people who have different backgrounds and different ages.
Acknowledgements
This work was also done in cooperation with TSUJI WELLNESS COOKING CO., LTD., Olfactory Multimedia Labo., Exhalia, and SHIONO KORYO KAISHA, LTD.
Cite this paper
Arima, R., Sithu, M. and Ishibashi, Y. (2017) QoE Assessment of Fairness between Players in Networked Virtual 3D Objects Identification Game Using Haptic, Olfactory, and Auditory Senses. Int. J. Communications, Network and System Sciences, 10, 129-141. https://doi.org/10.4236/ijcns.2017.107007
References
- 1. Nakamono, T., Cho, N., Nitikarn, N., Yszynski, B.W., Takushima, H. and Kinoshita, M. (2008) Experiment on Teleolfaction Using Odor Sensing System and Olfactory Display Synchronous with Visual Information. International Conference on Artificial Reality and Telexistence (ICAT), Yokohama, 1-3 December 2008, 85-92.
- 2. Oh, S. and Hahn, M. (2009) The Ontology for a Multi-Sensory Media Service. The 11th International Conference on Advanced Communication Technology (ICACT), Phoenix Park, 15-18 February 2009, 1025-1030.
- 3. Sithu, M., Ishibashi, Y., Huang, P. and Fukushima, N. (2015) Influence of Network Delay on Quality of Experience for Soft Objects in Networked Real-Time Game with Haptic Sense. International Journal of Communications, Network and System Sciences (IJCNS), 8, 440-455.https://doi.org/10.4236/ijcns.2015.811040
- 4. Huang, P. and Ishibashi, Y. (2013) QoS Control and QoE Assessment in Multi-Sensory Communications with Haptics. IEICE Transactions on Communications, E96-B, 392-403.https://doi.org/10.1587/transcom.E96.B.392
- 5. Hoshino, S., Ishibashi, Y., Fukushima, N. and Sugawara, S. (2011) QoE Assessment in Olfactory and Haptic Media Transmission: Influence of Inter-Stream Synchronization Error. IEEE International Communications Quality and Reliability (CQR) Workshop, Naples, 10-12 May 2011, 1-6.https://doi.org/10.1109/cqr.2011.5996082
- 6. Murray, N., Qiao, Y., Lee, B. and Muntean, G. (2013) Subjective Evaluation of Olfactory and Visual Media Synchronization. ACM Multimedia Systems, New York, 162-171.
- 7. Ghinea, G. and Ademoye, O.A. (2012) The Sweet Smell of Success: Enhancing Multimedia Applications with Olfaction. ACM Transmission on Multimedia Computing, Communications, and Applications, 8, 1-20. https://doi.org/10.1145/2379790.2379794
- 8. Nakamoto, T., Otaguro, S., Kinoshita, M., Nagahama, M., Ohinishi, K. and Ishida, T. (2008) Cooking up an Interactive Olfactory Game Display. IEEE Computer Graphics Applications, 28, 75-78. https://doi.org/10.1109/MCG.2008.3
- 9. Zhang, L., Sun, S. and Xing, B. (2016) Exploring Olfaction for Enhancing Multisensory and Emotional Game Experience. Lecture Notes in Computer Science, 9654, 111-121.https://doi.org/10.1007/978-3-319-40259-8_10
- 10. Davis, S.B., Davies, G., Haddad, R. and Lai, M. (2006) Smell Me: Engaging with an Interactive Olfactory Game. The Human Factors and Ergonomics Society 25th Annual Meeting, Springer, London.
- 11. ITU-T Rec. P. 10/G. 100 Amendment 1 (2007) New Appendix I—Definition of Quality of Experience (QoE). http://www.scirp.org/reference/ReferencesPapers.aspx?ReferenceID=1251573
- 12. Ishibashi, Y., Hoshino, S., Zeng, Q., Fukushima, N. and Sugawara, S. (2014) QoE Assessment of Fairness in Networked Game with Olfaction: Influence of Time It Takes for Smell to Reach Player. Springer’s Multimedia Systems Journal (MMSJ), Special Issue on Network and Systems Support for Games, 20, 621-631.https://doi.org/10.1007/s00530-014-0382-0
- 13. Nakano, S., Maeda, Y., Ishibashi. Y., Fukushima, N., Huang, P. and Psannis, K. (2015) Influence of Network Delay on Fairness between Players in Networked Game with Olfactory and Haptic Senses. IEICE Technical Report, Shibaura Institute of Technology, Tokyo.
- 14. ITU-R BT. 500-12 (2009) Methodology for the Subjective Assessment of the Quality of Television Pictures. International Telecommunication Union, Geneva.
- 15. Sithu, M., Arima, R. and Ishibashi, Y. (2016) Experiment on Object Recognition with Haptic, Olfactory, and Auditory Senses in Virtual Environment. IEICE Technical Report, Nagoya Institute of Technology, Nagoya.
- 16. Salisbury, J.K. and Srinivasan, M.A. (1997) Phantom-Based Haptic Interaction with Virtual Objects. IEEE Computer Graphics and Applications, 17, 6-10.https://doi.org/10.1109/MCG.1997.1626171
- 17. Exhalia. http://www.exhalia.com/
- 18. SensAble Technologies, Inc. (2004) 3D Touch SDK Open Haptics Toolkit Programmer’s Guide. SensAble Technologies, Inc., Cambridge.
- 19. Huang, P., Ishibashi, Y., Fukushima, N. and Sugawara, S. (2012) QoE Assessment of Olfactory Media in Remote Ikebana with Haptic Media. IEEE International Workshop on Communications Quality and Reliability (CQR), San Diego, 15-17 May 2012, 1-6. https://doi.org/10.1109/cqr.2012.6267110
- 20. Tominaga, K., Honda, S., Ohsawa, T., Shigeno, H., Okada, K. and Matsushita, Y. (2001) Friend Park-Expression of the Wind and the Scent on Virtual Space. The 7th International Conference on Virtual Systems and Multimedia (VSMM), Berkeley, 25-27 October 2001, 507-515.https://doi.org/10.1109/VSMM.2001.969706
- 21. Moserand, B. and Stevens, G. (1992) Homogeneity of Variance in the Two Sample Means Test. The American Statistician, 46, 19-21.