Journal of Water Resource and Protection
Vol.6 No.8(2014), Article
ID:46711,10
pages
DOI:10.4236/jwarp.2014.68070
Assessment of Groundwater Potential and Aquifer Characteristics in the Vicinity of Igun, Eku and Oria in Delta State, Nigeria
Ochuko Anomohanran
Physics Department, Delta State University, Abraka, Nigeria
Email: mrochuko@yahoo.com
Copyright © 2014 by author and Scientific Research Publishing Inc.
This work is licensed under the Creative Commons Attribution International License (CC BY).
http://creativecommons.org/licenses/by/4.0/


Received 16 December 2013; revised 15 February 2014; accepted 10 March 2014
ABSTRACT
This study was carried out to investigate the groundwater potential and aquifer characteristics of locations in Igun, Eku and Oria in Delta State, Nigeria. Nine vertical electrical soundings using the Schlumberger configuration were conducted to assess the geoelectric properties of the subsurface, while down-hole loggings and pumping test were employed to evaluate the aquifer characteristics of the area. The geoelectric data were interpreted by partial curve matching and computer iteration techniques to determine the resistivity, thickness and depth of the subsurface formations. The result revealed the presence of four geoelectric layers comprising of lateritic/loamy topsoil, clay, fine-medium grain sand, and coarse sand. Analysis of the geoelectric interpretation indicates that the third and fourth layers are water bearing horizons. Result further indicates that the fourth layer with a resistivity range of 2212 to 7148 Ωm and depth range of 24.7 to 31.9 m is more prolific than the third layer aquifer. The result of hydrogeological investigation showed that the electrical conductivity of the groundwater aquifer in Igun, Eku and Oria are 0.028, 0.032 and 0.024 mS/m respectively, while their corresponding total dissolved solid are 91.08, 95.92 and 79.53 mg/m3. The result also showed that the transmissivity of the groundwater in Igun, Eku and Oria are 0.0728, 0.0873 and 0.0679 m2/min respectively while their corresponding storativity were obtained as 3.21 × 10⁻⁴, 4.71 × 10⁻⁴, and 2.87 × 10⁻⁴. These results obtained from the three locations have shown that the groundwater aquifer is reliable in terms of quality and yield as they conform to international standards.
Keywords:Transmissivity, Electrical Conductivity, Groundwater, Aquifer, Vertical Electrical Sounding, Storativity

1. Introduction
In view of the ever increasing demand for groundwater, greater emphasis is now being placed on a planned and optimal utilization of this resource. The exploration of this very important substance requires the application of many geophysical and hydrogeological techniques which includes electrical resistivity, seismic, magnetic, electromagnetic, ground probing radar, pumping test and down-hole logging [1] .
The electrical resistivity method applies different techniques in its investigation and the instrument used depends on the nature of the technique employed in the investigation [2] . The electrical resistivity method can be used to determine the resistivity distribution of the subsurface. The vertical electrical sounding technique happens to be one of the simplest methods applied in the present day assessment of groundwater occurrence [3] . This is because it is very useful in providing detailed information of the thickness and resistivity of the different conducting layers of the subsurface [4] . In other words, the vertical electrical sounding is used to delineate the subsurface formation strata based on difference in resistivity between the aquifer thickness and other parameters. In homogeneous layers, the depth of current penetration increases with increasing separation of current electrodes [5] . In view of this, the vertical electrical sounding is usually carried out in order to study the horizontal and near horizontal interfaces. In effect, this helps to determine the horizontal zones of porous strata.
In exploring for groundwater, very many researchers have employed the resistivity sounding technique. Adeoti et al. [5] used this technique to delineate the subsurface layers in Mowe, Ogun State of Nigeria and also obtained the groundwater potential. Anomohanran [1] also used this technique to investigate groundwater potential in Ukelegbe Nigeria and successfully recommended sites for locating boreholes in the study area. Utom et al. [6] through the use of the vertical electrical sounding was able to estimate the aquifer transmissivity using Dar Zarrouk parameters. Anudu et al. [7] in their research succeeded in using resistivity sounding to explore for groundwater in the crystalline basement terrain around Onipe and adjoining area of southwestern Nigeria.
The field procedure for the electrical resistivity technique enables the determination of subsurface resistivity by sending an electric current into the ground and measuring the potential field generated by the current [8] . The potential electrodes are inserted in the ground between the outer current electrodes where the potential difference is measured across these two potential electrodes. By measuring the current between the two current electrodes and the associated potential difference between the potential electrodes, the apparent resistivity is computed [9] .
Moving the current electrodes and the potential electrodes with the same distance is referred to as the Wenner array method. In the Schlumberger array method, the potential electrodes are closely spaced while the current electrodes are kept wide apart. The Schlumberger method has a greater depth spread than the Wenner. In the electrical resistivity method, the Wenner configuration distinguishes between resistivities of different geoelectric lateral layers while the Schlumberger configuration is used for depth sounding [10] .
Since groundwater is the most preferred source of water for domestic, agricultural and industrial purposes, it is crucial that we ensure the proper exploration, evaluation, monitoring and management of this essential resource to guarantee its quality and availability. This is the reason why it is important that the aquifer parameters such as transmissivity, electrical conductivity, hydraulic conductivity, storativity and total dissolved solid are determined. In determining the aquifer characteristics, several tests such as down-hole logging and pumping test are conducted [11] . These are aimed at estimating the groundwater quality and the ability of the subsurface formations to store and transmit groundwater. These tests are also necessary to assess the water flow pattern and contaminant transport in the aquifer. They are also important in the successful and reliable modelling of the groundwater results in an investigation [11] [12] .
The electrical resistivity method is employed in this study to determine the groundwater potential in Igun, Eku and Oria. Hydrogeological methods are also conducted to evaluate the aquifer characteristics of the area. It is hoped that this study will assist in the planning, improvement and organization of the groundwater resource of these locations investigated.
2. Materials and Methods
2.1. Area of Study
The study area is located in Ethiope East local government area of Delta State, Nigeria. It is situated between latitude 5.72˚N and 5.80˚N and longitude 5.94˚E and 6.08˚E (Figure 1). It lies in the Niger Delta region where oil
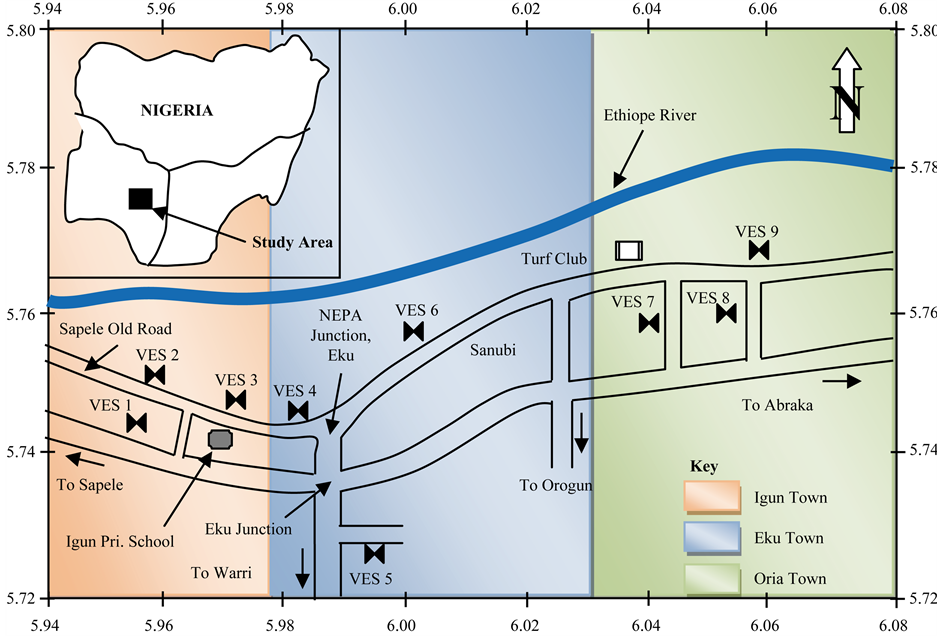
Figure 1. Location map of the study area.
exploration and exploitation is prevalent. The area under study has no established water scheme where the people can obtain potable water.
2.2. Field Technique
Nine vertical electrical soundings were occupied using the Schlumberger electrode configuration. The instrument used for this study is the ABEM SAS 1000 Terrameter with electrode spacing of 150 m. The data obtained from the field survey were first curved matched and later subjected to computer assisted iteration using the Win Resist software. This software simulates the values of the apparent resistivity and that of the current electrode spacing to obtain a one dimensional layered model. Consequently, different parameters were estimated, parts of which are the layer resistivity and the thickness.
In estimating the aquifer characteristics, one well each was drilled in the three different locations to conduct down-hole logging and pumping test. The down-hole logging which comprise spontaneous potential and resistivity loggings were carried out using an SAS 200 logging probe with the SAS 1000 Terrameter as the recording instrument. The probe was lowered into the well at various intervals of length while the record of the spontaneous potential and the resistivity were determined with respect to depth. While the resistivity logging determines the resistivity of the subsurface formation and identifies the nature and quality of the groundwater, the spontaneous potential log measures the chemical differences between the adjacent formations and the fluid in the wells [11] . The pumping test which was used to determine the aquifer transmissivity and storativity was carried out using the Jacob’s straight line method as discussed by Fetter [13] .
3. Results and Discussion
The result of the geoelectric interpretation is presented as shown in Table1 Table 1 shows that the study area is characterised by four layers comprising of lateritic/loamy topsoil, clay, fine-medium grain sand and coarse sand. The result of the geoelectric interpretation for Igun shows that the third and fourth layers possess potential for

Table 1 . Result of geoelectric interpretation.
groundwater occurrence. These aquifer layers are confined by an aquitard which is 3.1 to 5.3 m thick. The aquifer of interest with respect to yield and quality is the fourth layer with resistivity range of 2627.5 to 3558.9 Wm and depth range of 26.0 to 31.6 m.
The interpretation of results from Eku shows that the second layer contains clay with thickness range of 4.8 to 5.5 m. This aquitard confine the third layer which is identified as aquiferous and compose of fine sand. The fourth layer has a resistivity range of 2212.1 to 4260.0 Wm and depth range of between 24.7 and 27.8 m. This layer is an aquifer layer suitable for taping groundwater for the people. The analysis of results from Oria shows that the aquifer lies in the third and fourth layers. The second layer aquitard is underlain by third layer aquifer made up of fine sand. This is followed by a more porous fourth layer aquifer whose resistivity range between 1712.0 and 2998.8 Wm and the depth range between 30.6 and 31.9 m.
Analysis of the geoelectric interpretation shows the third and fourth layers as water bearing in all the VES points. The fourth layer aquifer is inferred from the results to be more prolific than the third layer aquifer. The resistivity of the fourth layer ranges between 2212 and 4260 Wm while the depth to the aquifer layer is between 24.7 and 31.9 m. The result of the geoelectric interpretation also shows that the thickness of the aquitard ranged between 3.1 and 6.3 m. This is sufficiently thick to keep the groundwater safe from contamination [14] .
The iso-resistivity map of the aquifer is presented as shown in Figure 2. Figure 2 shows that the resistivity of the groundwater in Oria is higher than those of Eku and Igun. The resistivity range for Igun is also higher than that of Eku. This is an indication that the groundwater quality at Oria is relatively higher than that of Igun which is also relatively higher than that of Eku. Figure 2 will help in identifying the resistivity of the aquifer and assist in site location for drilling boreholes.
The iso-depth map of the fourth layer aquifer is presented as shown in Figure 3. Figure 3 shows that the aquifer table in Oria which range between 30.6 and 31.7 is higher than the water table in the other two locations. This is not unconnected with the elevation of Oria which is 27 m when compared to that of Eku which is 18 m and Igun which is 15 m above sea level. As one moves towards Eku, the depth becomes relatively equal for both Eku and Igun. This is an indication that the underground formations of both sites are very similar, as can be seen from the geoelectric results. Figure 3 will therefore help drillers ascertain the depth to the top of the aquifer from any point in the area.
The lithologic logs of the drilled wells at the three locations are presented as shown in Figure 4. Figure 4 shows that the subsurface formation is composed of four layers which are made up of topsoil, clay, fine-medium grain sand and coarse sand. This information correlates well with the geoelectric results as presented in Table1
The results of the electrical resistivity and the spontaneous potential logs are presented as shown in Figure 5 and Figure 6 respectively. The resistivity logs shown in Figure 5 reveal that the quality of the groundwater increases downward, which is an indication that the deeper one drills, the higher the quality of water to be sourced. Analysis of Figure 6 shows a steady decrease in the values of the spontaneous potential, but become relatively
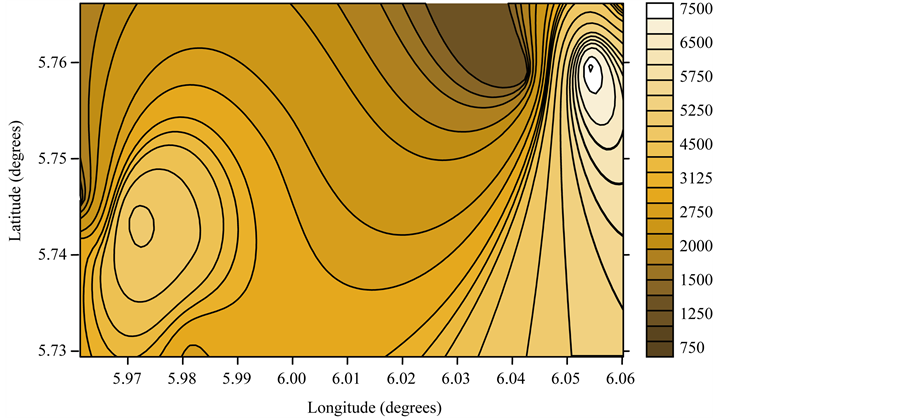
Figure 2. Iso-resistivity map of the aquifer layer.
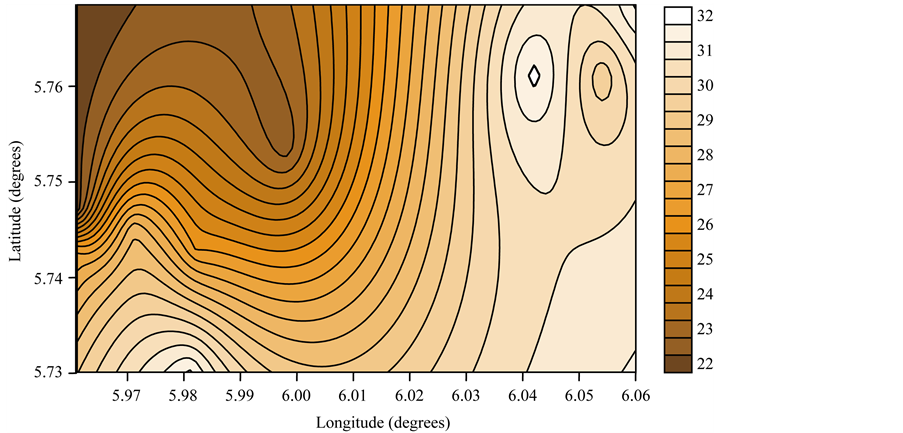
Figure 3. Iso-depth map of the aquifer layer.
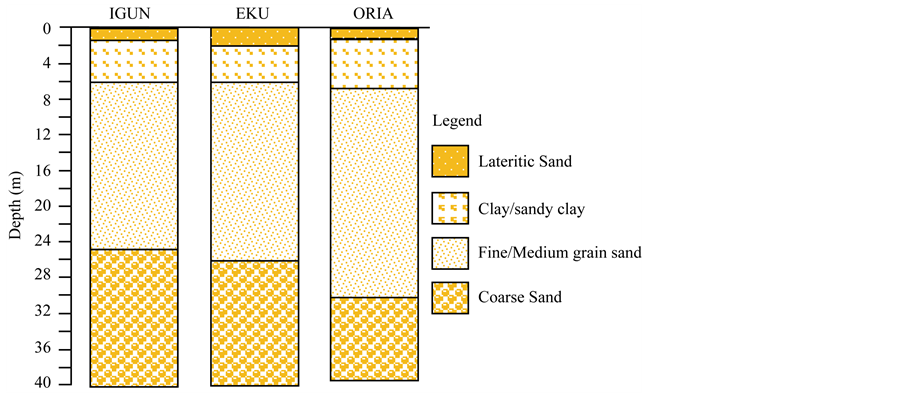
Figure 4. Lithologic section of the study area.
constant after 30 m. This is an indication that the quality of the groundwater is more stable and reliable after a depth of 30 m. This is why drilling should not be encouraged for depth less than 30 m. The results of the well logging as shown in Figure 5 and Figure 6 were used to compute the electrical conductivity (EC) and the total dissolved solid (TDS) of the aquifer and the results presented in Table2 Analysis of the result in Table 2 shows that the average electrical conductivity of the groundwater in Igun, Eku and Oria are 0.028, 0.032 and 0.024 mS/m respectively, while their corresponding total dissolved solid are 91.08, 95.92 and 79.53 mg/m3. These values are less than the World Health Organisation permissible limit for drinking water. This is the reason while the groundwater in these locations can be said to be of good quality [15] .
The result of the pumping test was analysed and the drawdown plotted against time of pumping on a semilogarithmic graph sheet as shown in Figures 7-9. The Jacob’s straight line method was applied in computing the transmissivity and storativity of the aquifer. This was carried out by substituting the value of the drawdown per log circle of time ,
,  and
and  into Equations (1) and (2) [13] .
 (1)
(1)
Table 2. Record of down-hole logging.
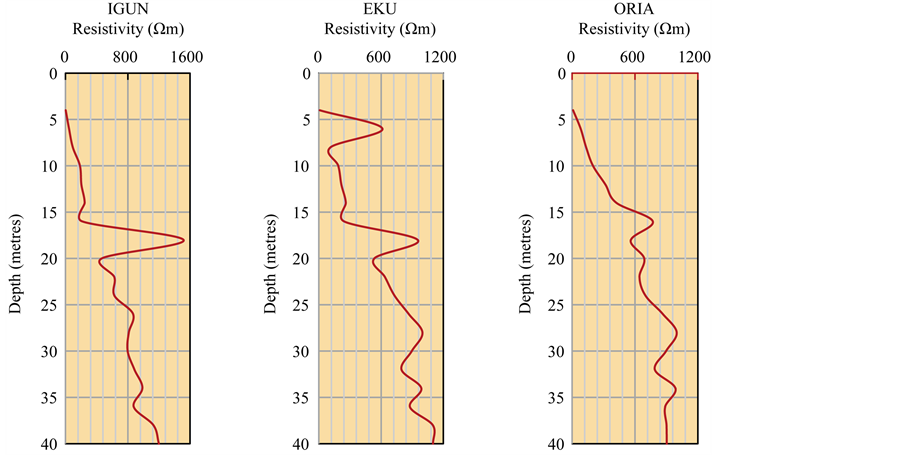
Figure 5. Logs of electrical resistivity.
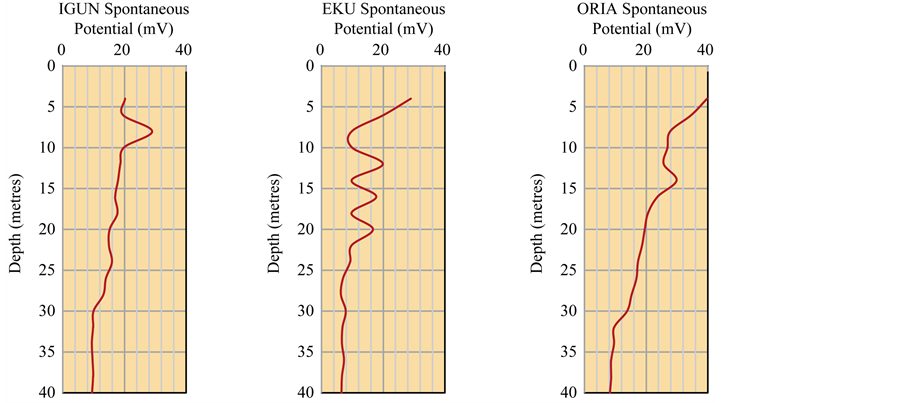
Figure 6. Logs of spontaneous potential.
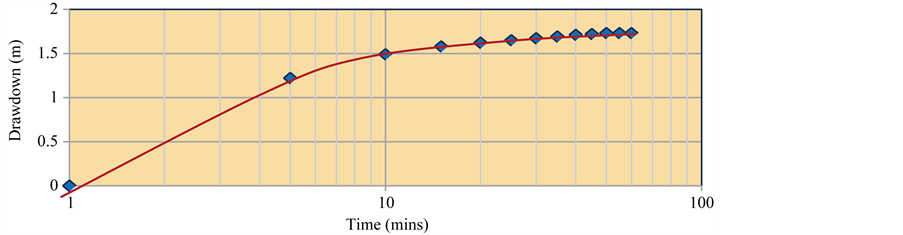
Figure 7. Plot of drawdown versus time of pumping for borehole in Igun.
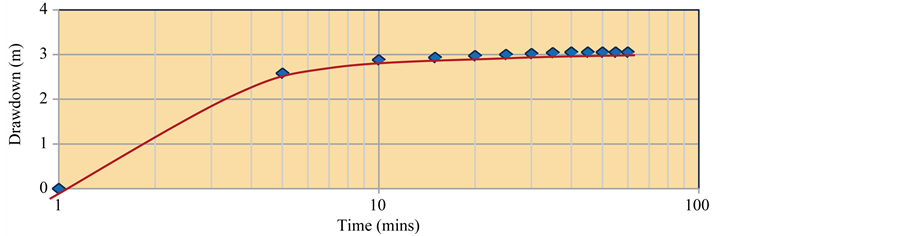
Figure 8. Plot of drawdown versus time of pumping for borehole in Eku.
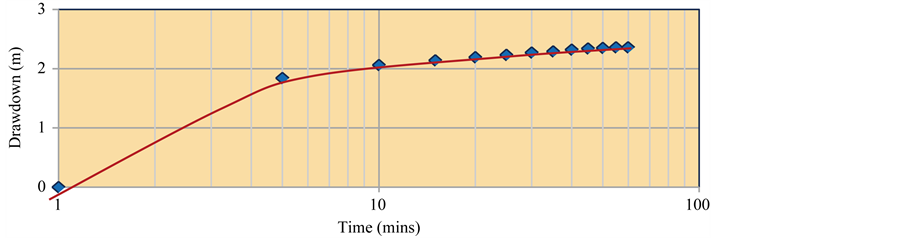
Figure 9. Plot of drawdown versus time of pumping for borehole in Oria.
Table 3. Hydrogeological results of well parameters.
 (2)
(2)
where T is transmissivity, S is storativity,  is the drawdown per log cycle of time, Q is the constant pumping rate,
  is the time since pumping began, and
  is the intercept of the straight line drawn through the field data. The result of computation shows that the transmissivity of the aquifer in Igun, Eku and Oria are 0.0728, 0.0873 and 0.0679 m2/min respectively while the corresponding storativity was obtained as 3.21 × 10⁻⁴, 4.71 × 10⁻⁴, and 2.87 × 10⁻⁴. The results for all the hydrogeological parameters investigated are presented in Table3 These hydrogeological values obtained from the three locations have also revealed that the groundwater is dependable in terms of quality and yield as they are within the international standard for drinking water [15] [16] .
4. Conclusion
This study, which is aimed at investigating the groundwater potential and aquifer characteristics of Igun, Eku and Oria has been carried out using geoelectrical and hydrogeological methods. This study has revealed that groundwater potential exists in the fourth layer of the subsurface. The aquitard was found to be thick enough to protect the aquifer from contamination. The aquifer depth in the area was obtained to range between 24.7 and 31.7 m while the resistivity of the aquifer was obtained to be between 2212 and 4260 Wm. The results of the hydrogeological parameters investigated also show that the groundwater is of good quality while the yield is adequate to provide the needed quantity desired by the people of the area.
References
- Anomohanran, O. (2013) Geophysical Investigation of Groundwater Potential in Ukelegbe, Nigeria. Journal of Applied Sciences, 13, 119-125. http://dx.doi.org/10.3923/jas.2013.119.125
- Anomohanran, O. (2013) Investigating the Geoelectric Response of Water Saturated and Hydrocarbon Impacted Sand in the Vicinity of Petroleum Pipeline. International Journal of Applied Science and Technology, 3, 14-21.
- Okiongbo, K.S., Akofure, E. and Odubo, E. (2011) Determination of Aquifer Protective Capacity and Corrosivity of Near Surface Materials in Yenagoa City, Nigeria. Research Journal of Applied Sciences, Engineering and Technology, 3, 785-791.
- Egbai, J.C. (2011) Vertical Electric Sounding for the Determination of Aquifer Transmissivity. Australian Journal of Basic and Applied Sciences, 5, 1209-1214.
- Adeoti, L., Alile, O.M., Uchegbulam, O. and Adegbola, R.B. (2012) Geoelectrical Investigation of the Groundwater Potential in Mowe, Ogun State, Nigeria. British Journal of Applied Science and Technology, 2, 58-71.
- Utom, A.U., Odoh, B.I. and Okoro A.U. (2012) Estimation of Aquifer Transmissivity Using Dar Zarrouk Parameters Derived from Surface Resistivity Measurements: A Case History from Parts of Enugu Town (Nigeria). Journal of Water Resource and Protection, 4, 993-1000. http://dx.doi.org/10.4236/jwarp.2012.412115
- Anudu, G.K., Onuba, L.N. and Ufondu, L.S. (2011) Geoelectric Sounding for Groundwater Exploration in the Crystalline Basement Terrain around Onipe and Adjoining Areas, Southwestern Nigeria. Journal of Applied Technology in Environmental Sanitation, 1, 343-354.
- Anomohanran, O. (2011) Determination of Groundwater Potential in Asaba Nigeria Using Surface Geoelectric Sounding. International Journal of the Physical Sciences, 6, 7651-7656.
- Gabr, A., Murad, A., Baker, H., Bloushi, K., Arman, H. and Mahmoud, S. (2012) The Use of Seismic Refraction and Electrical Techniques to Investigate Groundwater Aquifer, Wadi Al-Ain, United Arab Emirates (UAE). Conference Proceedings of the Water Resources and Wetlands, 14-16 September 2012.
- Nejad, H.T. (2009) Geoelectric Investigation of the Aquifer Characteristics and Groundwater Potential in Behbahan Azad University Farm, Khuzestan Province, Iran. Journal of Applied Sciences, 9, 3691-3698. http://dx.doi.org/10.3923/jas.2009.3691.3698
- Anomohanran, O. (2013) Evaluation of Aquifer Characteristics in Echi, Delta State, Nigeria Using Well Logging and Pumping Test Method. American Journal of Applied Science, 10, 1263-1269.
- Straface, S., Fallico, C., Troisi, S., Rizzo, E. and Revil, A. (2007) An Inverse Proceedure to Estimate Transmissivity from Heads and SP Signal. Ground Water, 45, 420-428. http://dx.doi.org/10.1111/j.1745-6584.2007.00310.x
- Fetter, C.W. (2007) Applied Hydrogeology. 2nd Edition, CBS Publishers and Distribution, New Delhi, 592.
- Okiongbo, K.S. and Akpofure, E. (2012) Determination of Aquifer Properties and Groundwater Vulnerability Mapping Using Geoelectric Method in Yenagoa City and Its Environs in Bayesa State, South South Nigeria. Journal of Water Resource and Protection, 4, 354-362. http://dx.doi.org/10.4236/jwarp.2012.46040
- EPA (2012) Drinking Water Standards and Health Advisories. United State Environmental Protection Agency, EPA 822-S-12-001.
- Majumdar, R.K. and Das, D. (2011) Hydrological Characterization and Estimation of Aquifer Properties from Electrical Sounding Data in Sagar Island Region, South 24 Parganas, West Bengal, India. Asian Journal of Earth Sciences, 4, 60-74. http://dx.doi.org/10.3923/ajes.2011.60.74