Journal of Water Resource and Protection
Vol.6 No.5(2014), Article ID:45018,18 pages DOI:10.4236/jwarp.2014.65041
Future Prospects for Macro Rainwater Harvesting (RWH) Technique in North East Iraq
Nadhir Al-Ansari1*, Mawada Abdellatif2, Saleh Zakaria1,3, Yaseen T. Mustafa4, Sven Knutsson1
1Lulea University, Lulea, Sweden
2Liverpool JM University, Liverpool, UK
3Department of Dams & Water Resources Eng., University of Mosul, Mosul, Iraq
4University of Zakho, Duhok, Iraq
Email: saleh.zakaria@ltu.se, Y.T.Mustafa@uoz-krg.org, Sven.Knutsson@ltu.se, *nadhir.alansari@ltu.se
Copyright © 2014 by authors and Scientific Research Publishing Inc.
This work is licensed under the Creative Commons Attribution International License (CC BY).
http://creativecommons.org/licenses/by/4.0/


Received 18 February 2014; revised 15 March 2014; accepted 12 April 2014
ABSTRACT
Countries in Middle East and North Africa (MENA region) are considered as arid and semi-arid areas that are suffering from water scarcity. They are expected to have more water shortages problem due to climatic change. Iraq is located in the Middle East covering an area of 433,970 square kilometers populated by 31 million inhabitants. One of the solutions suggested to overcome water scarcity is Rainwater Harvesting (RWH). In this study Macro rainwater harvesting technique had been tested for future rainfall data that were predicted by two emission scenarios of climatic change (A2 and B2) for the period 2020-2099 at Sulaimaniyah Governorate north east of Iraq. Future volumes of total runoff that might be harvested for different conditions of maximum, average, and minimum future rainfall seasons under both scenarios (A2 and B2) were calculated. The results indicate that the volumes of average harvested runoff will be reduced when average rainfall seasons are considered due to the effect of climatic change on future rainfall. The reduction reached 53.73% and 43.0% when scenarios A2 and B2 are considered respectively.
Keywords:Rainwater Harvesting, Sulaimaniyah, Iraq

1. Introduction
Water resources are very scarce in the Middle East and North Africa (MENA region) [1] -[4] where the annual rainfall does not exceed 166 mm [2] for this reason; it contains hyper-arid, arid and semi-arid zones [5] . Twelve of the countries in the MENA region have less than 500 m3 of renewable water resources per capita available [6] -[8] . Fresh potable water is essential for life, socioeconomic development, and political stability in the region [9] . It was reported that one cubic meter of water can provide drinking water for 1 person for 1 year or the same quantity can produce only 1 kg of food grain when used for irrigation in a dry climate [10] . The need for a rationalized holistic management of this most vital natural resource is paramount in order to attain a sustainable society [9] . Agriculture accounts for about 66% of demand, [11] and therefore the water shortage problem cannot be objectively analyzed nor adequately addressed without a thorough consideration of agriculture in the region [12] . For example, it was stated that an approximate 10% transfer of water away from agriculture would produce a 40 % increase in domestic water supply for Jordan. Postel [13] argues that water could be saved by importing the food/grain rather than diverting precious water to agriculture. However, many Middle Eastern countries have unrealistic aspirations of food self-sufficiency and it would require a most fundamental change in national outlook [14] . The extent of the problem is so severe that “the future challenges in meeting the growing demands for water are beyond the capabilities of individual countries” [12] . Mitigating supply shortfalls could be achieved by re-allocation of current agricultural supplies [3] . Several researchers had concluded that arid and semi-arid regions, like the MENA region, are highly vulnerable to climate change, e.g. [15] . It is expected that the region will suffer from higher temperatures and intense heat waves affecting inhabitants and crop yields, and will also affect marine ecosystems and fisheries. Accordingly, less but more intense rainfall, coupled with higher temperatures, will likely cause more droughts and greater flooding, sea level rise, more intense cyclones and new areas exposed to dengue, malaria, and other vector and waterborne diseases. Future rainfall forecast indicates that it will be decreasing with time in Iraq and Jordan as an example [9] [16] -[18] . The drought will affect the agricultural life and water supply [19] . This is due to the fact that most of the agricultural areas of the MENA region are rain-fed [20] and decrease groundwater recharge which is already depleting [21] .
IPCC [22] in Special Report on Emissions Scenarios (SRES) gave details about climate models including the most important future scenarios of greenhouse emissions and aerosols as input to make a suite of projected future climate changes that illustrates the possibilities that could lie ahead. These scenarios involving different narrative storylines had been described as: A1, A2, B1 and B2. The A1 contain three groups A1FI, A1T, and A1B. These scenarios consider several criteria and factors, such as the technological emphasis of fossil intensive, non-fossil energy sources and a balance across all sources respectively. A2 and B2 are some example about the storyline and scenario family that describes in [22] . For A2 storyline and scenario family, a very heterogeneous world was considered. In this, the underlying theme was self-reliance and preservation of local identities, fertility patterns across regions converge very considered to be slowly, which results in continuously increasing global population and economic development was also considered regionally oriented where per capita economic growth and technological change was more fragmented and slower than it is in other storylines. While for B2 storyline and scenario family, a world in which the emphasis was on local solutions to economic, social, and environmental sustainability was considered. It is a world with continuously increasing global population at a rate lower than A2; intermediate levels of economic development are less rapid and more diverse technological change than in the B1 and A1 storylines, while the scenario is also oriented toward environmental protection and social equity, it focuses on local and regional levels.
Iraq is one of the countries in the MENA region. It covers an area of 433,970 square kilometers populated by 31 million inhabitants. Recently, it is suffering from water shortage problems [23] [24] . Rainwater harvesting (RWH) was suggested as one of the solutions for the water shortage problems in Iraq [25] -[27] . Due to climate change, the precipitation patterns will be modified leading to extreme events which will affect the availability of water resources particularly in tropical and Mediterranean areas [28] [29] and this will significantly affect sectors like agriculture, industry and urban development [30] .
Many researchers studied climate impacts explained that understanding the potential effects of climate change is fundamental for informing both adaptation strategies and actions to avoid risky levels of climate change. Recently, there is a great attention given by the international community about the variability and trends of precipitation and their effects on the environment during the last century [31] [32] .
A number of researchers studied the trends and variability of precipitation such as [16] -[18] [33] -[40] . These studies had two goals, the first was to analyze the trends of long term time series of precipitation and the second was to analyze precipitation projections for the future climate.
Philandras et al. [41] analyzed (long term) trends and variability of annual precipitation and annual rain days over part of Mediterranean region; the regional simulation model (RACMO2.1/KNMI) was used with emission scenario A1B. The results showed that statistically significant negative trends of the annual precipitation totals exist in the majority of Mediterranean regions during the period 1901-2009. For the annual number of rain days, a clear reduction of 20%, statistically significant, founds in meteorological stations of east Mediterranean, while the trends were insignificant for west and central Mediterranean. The precipitation is very likely to be reduced almost 20% in the period 2071-2100 compared to 1961-1990, under SRES A1B.
Eugene [42] stated that “Climate data of the last century are not the only source for the best information available for future planning in the field of agriculture, water resources, ecosystems and human health. For climate science the observations are the main foundation, therefore models must now be used to synthesize observations and project future climate scenarios for decision-making on long term issues”.
Al-Ansari et al. [39] [40] studied long term effect of climate change on rainfall in northwest and north-eastern Iraq respectively. The last study was at Sulaimaniyah Governorate, Kurdistan region of Iraq, the results indicated that the average annual rainfall showed a significant downward trend for both A2 and B2 scenarios for the period 1961-2099. Average monthly rainfall simulated by HadCM3 GCM for A2 and B2 scenarios of greenhouse emission for the three future periods compared with the baseline period showed some reduction in the monthly rainfall for the 2020s, 2050s and 2080s; however, 2080s experience largest drop especially during April and July months of A2 (51% and 77%) and during May and July of B2 (49% and 79%). Generally the projected rainfall in future varies significantly/slightly amongst the three future periods and the emission scenario considered as A2 experience more reduction relative to that predicted by scenario B2.
For the rain-fed areas at Iraq, rainfall is not sufficient to support economic crop yield during rainy seasons without irrigation. The average annual rainfall in Iraq is ranging from 154 to 216 mm/year [43] [44] . Practically, the technique of macro rainwater harvesting (RWH) might be one of the good solutions for the water shortage problem in Iraq. RWH technique is defined as “the collection of runoff for its productive use” [45] . Boers and Ben-Asher [46] gave a more specific definition of RWH with specific details, where they defined RWH as “a method for inducing, collecting, storing, and conserving local surface runoff for agriculture in arid and semi-arid regions”. They explained that the RWH includes several processes dealing with collecting rainwater then to direct it to the target storage location (a surface reservoir or a soil profile). Furthermore, they specified the aim of this process for agriculture purposes. The annual rainfall (100 - 700) mm of low cost water harvesting might give an important new water source [47] . The main objective of RWH is to increase the availability of water but not its amount. The factors such as amount of rainfall and its distribution, land topography, soil type and soil depth, and local socio-economic may represent the main factors that affect water harvesting [47] [48] . The productivity of the rainwater can be significantly improved by applying a specific technique such as Macro RWH, based on availability of a surface reservoir. By this technique, the excess rainwater (runoff) is stored in small reservoirs of small dams with different sizes to be supplied later when required [25] -[27] [49] . RWH systems had proven to be an effective technique in different regions to achieve new water source that can be used for several purposes [47] . The present work is to test the future validity of Macro rainwater harvesting (RWH) technique at Sulaimaniyah Governorate using daily rainfall data that generated for the period (2020-2099) by Al-Ansari et al. [40] . The data were based on global climatic projections and their scenarios, using the HadCM3 Global Climate Model (GCM), Scenarios A2 and B2.
2. Methodology
Watershed modelling system (WMS) was used to estimate the harvested runoff at the selected five basins at Sulaimaniyah Governorate based on Digital Elevation Model (DEM) of the study area. The runoff volumes were estimated based on soil conservation service curve number (SCS-CN) method. Therefore curve numbers (CN) values were estimated for each basin and modified for dry and wet conditions based on the information obtained from land use map, soil type and the selected basins. Then curve numbers (CN) values were modified for slope.
For the Soil Conservation Service, 1972 (SCS-CN) method, the tabulated curve number is equal to CNII, for normal (average) conditions, and modified for dry and wet conditions, as explained by Chow et al. [50] through the following equations:
 (1)
(1)
 (2)
(2)
In which:
CNI = Curve number for dry condition CNIII = Curve number for wet condition.
Williams [51] developed an equation to adjust the curve number to a different slope [52] [53] :
 (3)
(3)
where:
[CNII]SLP = the curve number for average condition adjusted for the slope.
SLP = the average fraction slope of the basin.
The details of the procedure and the calibration of the model are well described by [25]-[27] [54].
3. Study Area
Five basins were previously investigated [54] for Macro RWH at Sulaimaniyah Governorate (Figure 1) for recorded rainfall data for the period 2002-2012. Table 1 shows the properties of the selected basins. For the current work, the same locations were used with future rainfall in order to study future macro RWH technique and to make suitable comparison between historical and future runoff events. The details of study area can be summarized as follows: Sulaimaniyah Governorate is located north east of Iraq (35˚33'40'' N and 45˚26'14'' E) (Figure 1). The study area consists of five separated basins with total area of 176.79 km2, located about 7 km North West of Sulaimaniyah city. According to Buringh [55] , the soil of the study area is of three main types (37, 38, and 39) as shown in Figure 2. Simak [56] indicated that the last two soil types can be identified as C, and D of the Hydrologic Soil Group according to the United States Department of Agriculture Natural Resources Conservation Service (Conservation Engineering Division 1986).
Buringh [55] classified the soil type 37 as great Soil group of Chestnut soils and the soil type is silty clay, having a dark brown color, friable surface soil, usually with 1% - 4% of organic matter and less than 9% lime.
The geographic location of Sulaimaniyah Governorate imposed a dry and warm summer for the period June to August, with temperature of 31.5˚C as average temperatures. The city is usually windy during winter. This season extends from December till February. The temperature during winter is about 7.6˚C. The average relative humidity for summer and winter are 25.5% and 65.6% respectively, while the evaporation reached 329.5 mm during summer and 53 mm during winter. Average wind speed during winter is about 1.2 m/sec and increases a little bit more during summer where it reaches 1.8 m/sec. Sunshine duration reaches 5.1 and 10.6 hr. during winter and summer respectively.
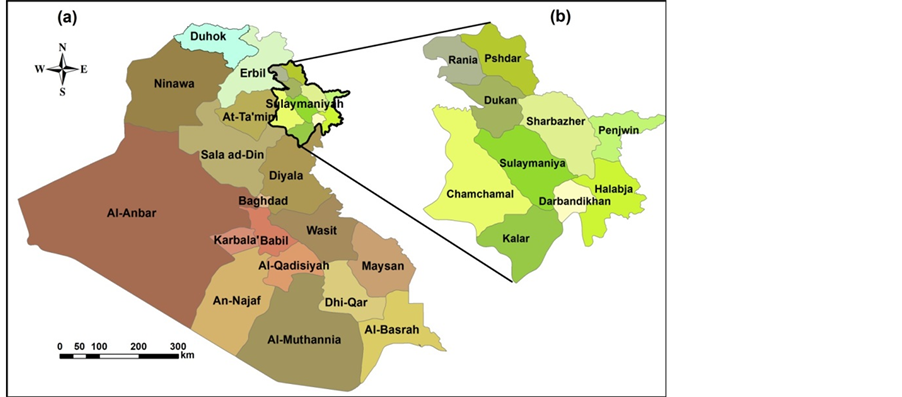
Figure 1. Map of Iraq and the ten districts of Sulaimaniyah Governorate, source: [54] .

Figure 2. Soil map of Sulaimaniyah Governorate with boundaries of study area, source: [54] .

Table 1. Properties of the selected basins at Sulaimaniyah Governorate, source: [54] .
The rainfall season may starts in October at Sulaimaniyah with light rainfall storms and it intensifies during November and continues till May. Rainfall records for the period 2002-2012, showed that, the driest season was recorded in 2008-2009 of 328 mm and the maximum rainfall depth was in 2003-2004 of 848 mm. The season 2010-2011 represent the average rainy season (548.8 mm) for the period 2002-2012.
The Land use/land cover (LULC) map of Sulaimaniyah Governorate (Figure 3) was derived from satellite imagery. The weighted average CN values for five selected basins were estimated depending on area of specific land use land cover as a percent of total basin area and calibrated based on antecedent moisture conditions (AMC) for dry, normal (average), and wet conditions depending on the total antecedent rainfall depth of five days as formulated by SCS-CN method. Then CN values were adjusted for slope using Williams’ formula [51] for each basin (Table 2).
4. Rainfall Data and Estimation Runoff
The rainfall data that were used in this work had been derived by Al-Ansari et al. [40] . They used HadCM3 Global Climate Model (GCM) with grid resolution of 2.50 × 3.750 in order to provide future climate scenarios for the periods 2020-2099. Both A2 and B2 emission scenarios were employed. Daily rainfall data for projections are related to emission uncertainty. In this work, future rainfall based on A2 and B2 scenarios were used in order to investigate macro RWH technique and then to estimate future expected harvested runoff for individual daily future rainstorms. The estimation runoff was based on Soil Conservation Service-curve number (SCS-CN) method using Watershed Modelling System (WMS) with Data Elevation Model (DEM) of Sulaimaniyah Governorate. Future rainfall of scenarios A2 and B2 are graphically presented in Figure 4. The future season of maximum, minimum and average annual rainfall for both scenarios A2 and B2 were identified (Table 3) and

Figure 3. Land use/land cover map of Sulaimaniyah Governorate (on left), with enlarge view of study area, source: [54] .
Table 2. Curve number (CN) values before and after adjustment for slope, source: [54] .
then each daily rainstorm of theses seasons that might produce runoff were identified with the hydraulic conditions of the catchment area (Tables 4-9).
5. Results and Discussion
IPCC [22] Indicated that “Four qualitative storylines yield four sets of scenarios called families including A1 (A1FI, A1B, and A1T), A2, B1, and B2. Altogether 40 SRES scenarios had been developed by six modelling teams. All are equally valid with no assigned probabilities of occurrence”. The impact of climatic change is associated with large uncertainties. Predicted rainfall data can give some idea about future prospects of the status of rainfall. This can help in estimating hydraulic events such as runoff [23] . Predicted rainfall under both scenarios A2 and B2 [40] , showed linear trend indicating that there is a significant decrease in total seasonal rainfall depth
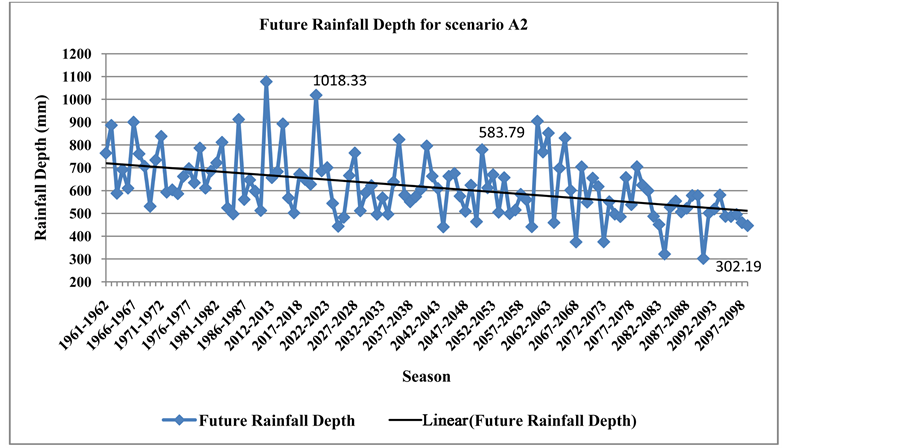

Figure 4. Average annual rainfall for A2 scenario (upper) and B2 scenario (lower), source: [40] .
Table 3. Selected seasons of future average annual rainfall depth for scenarios A2 and B2 for the period 2019-2099 [40] .
Table 4. Maximum rain season 2020-2021 for scenario A2 [40] .
Table 5. Average rain season 2057-2058 for scenario A2 [40] .
Table 6. Minimum rain season 2090-2091 for scenario A2 [40] .
Table 7. Maximum rain season2046-2047 for scenario B2 [40] .
Table 8. Average rain season 2027-2028 for scenario B2 [40] .
Table 9. Min. rain season 2081-2082 for scenario B2 [40] .
with time (Figure 4). Using rainfall data for both scenarios the maximum, minimum and average rainfall seasons were identified (Table 3). Analyzing the identified data, day by day, helps to pinpoint the individual rainstorms that may produce runoff (Tables 4 to 9). The individual rain storm depth and span time between rain storms play important role to produce the hydraulic condition (dry, normal, and wet) of the catchment area. However, each of the above selected seasons contains some rain storms (but not all) that can produce runoff. For example, under scenario A2, the maximum rainfall season (2020-2021) includes 24 individual rainstorms that may produce runoff, their depths ranged between 12.7 to 38 mm. Moreover, the associated hydraulic conditions depending on antecedent moisture conditions (AMC) were 3, 10 and 11events under dry, normal and wet conditions respectively. Identifying the AMC was based on the total antecedent rainfall depth for 5 consecutive days, which were identified in the daily rainfall data for scenarios A2 and B2 for the study area according to the documentation by SCS-CN method and that had explained by [50] . Accordingly, the identified rainstorms for each selected season for both scenarios might give runoff results as shown in Figure 5 and Figure 6 respectively. Moreover, the total future harvested runoff for scenarios A2 and B2 for the selected maximum, average, and minimum seasons are represented in Figure 7.

Figure 5. Future harvested runoff with scenario A2 for the selected season.
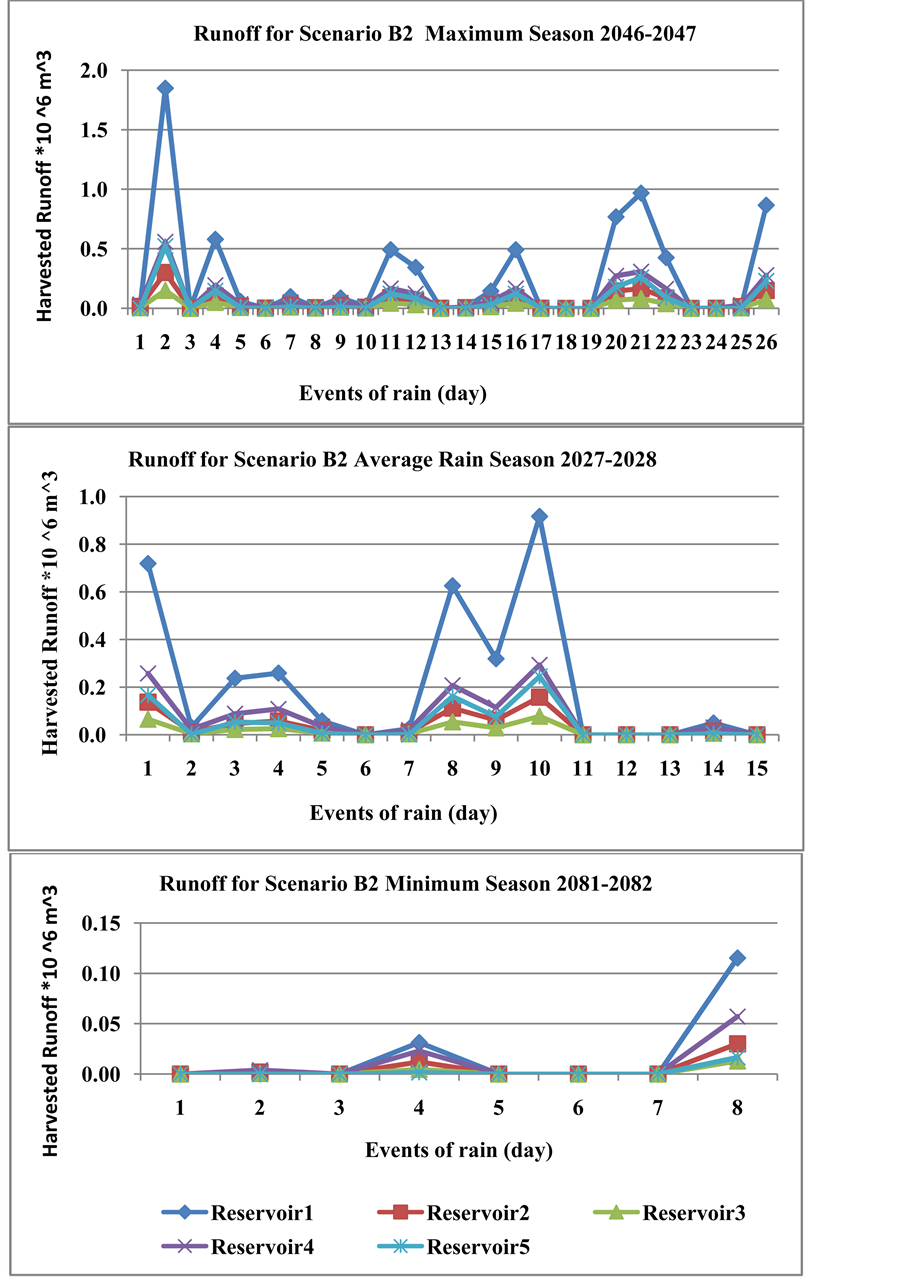
Figure 6. Future harvested runoff with scenario B2 for the selected season.
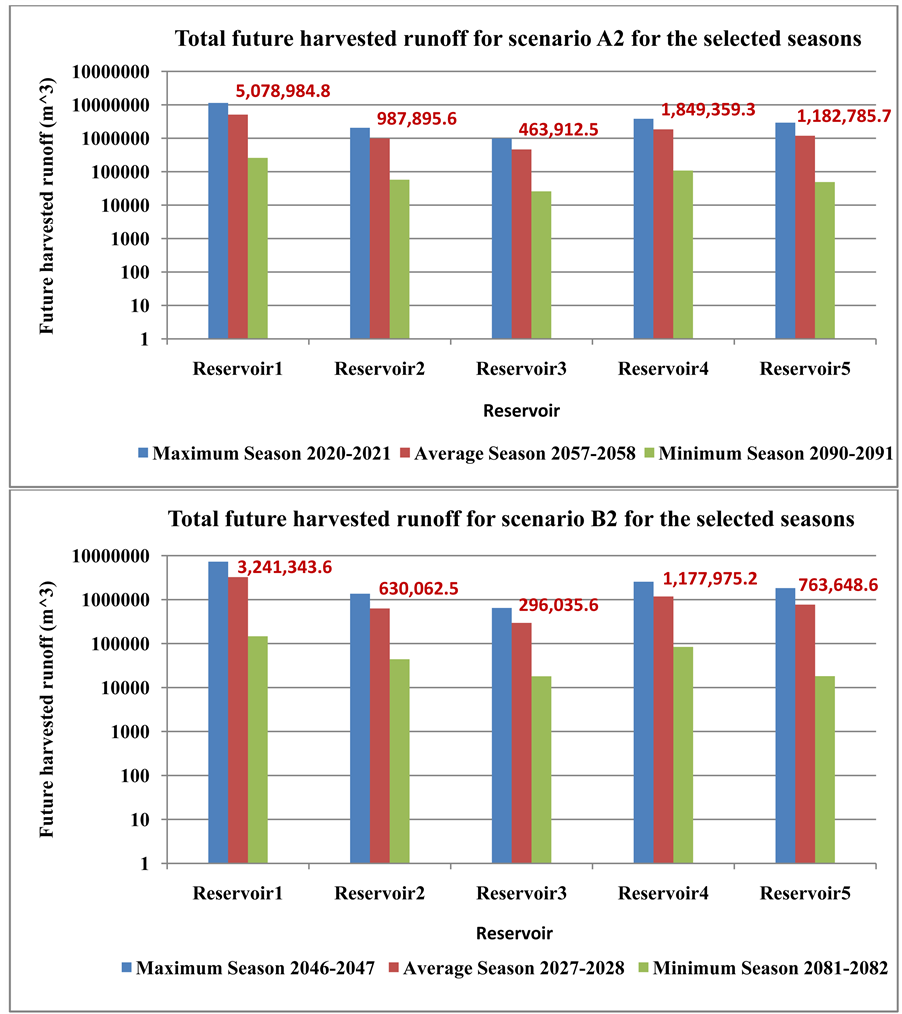
Figure 7. Total future harvested runoff with scenario A2 and B2 for the selected seasons.
The comparison between scenarios A2 and B2 show that:
For maximum rainfall seasons (Table 4 and Table 7), the total numbers of rainstorms that can produce runoff were very close when comparing both scenarios (24 and 26 rainstorms might occur in 2020-2021 according to scenarios A2 and 2046-2047 for B2 respectively). These rainstorms occur with various hydraulic conditions of the catchment area (dry, normal, and wet). Thus, 3 rainstorms, with depths ranging between 14.2 - 17.8 mm, might occur with dry hydraulic conditions under scenarios A2. They didn’t produce any runoff, which reflect the important role of low value of the curve number (CN) under dry conditions that reduces the rainstorm ability to produce runoff. While for scenario B2, 8 rainstorms were recognized. Their depths were ranging between 13.6 to 37.2 mm, occurred under dry hydraulic conditions. Some of these rainstorms of high depth of rainfall (more than 35 mm) had produced runoff while the others did not. All the remaining rainstorms with normal and wet conditions, for both scenario A2 and B2 produced runoff.
The maximum rainstorm depth was 38.6 mm for the wet condition of scenario A2, which produced runoff of 3.24 million cubic meters. The water was distributed in reservoirs 1 to 5 as follows: 1.77, 0.29, 0.14, 0.54, and 0.50 million cubic meters respectively. For scenario B2 however, the maximum rainstorm depth was 39.7 mm for the wet condition which produced runoff of 3.38 million cubic meters that was distributed in reservoirs 1 to 5 as follows: 1.85, 0.3, 0.15, 0.56, and 0.52 million cubic meters respectively. These results reflect the effective role of CN value with wet conditions to produce a good quantity of harvested runoff.
Furthermore, the total runoff that might be harvested for the whole maximum season (2020-2021 under scenario A2) in all basins reached up to 21.19 million cubic meters (Figure 7) which was distributed in reservoirs 1 to 5 as follows 11.41, 2.05, 0.99, 3.82, and 2.92 million cubic meters respectively. For scenario B2, the water harvested during the maximum season (2046-2047) reached up to 13.62 million cubic meters (Figure 7) which was distributed in reservoirs 1 to 5 as follows: 7.26, 1.36, 0.64, 2.54 and 1.82 million cubic meters respectively. The results showed that the water harvested using scenario A2 was more than that of scenario B2 for the season with maximum rainfall expected.
The differences in the volume of harvested water between the two scenarios are due to the differences in rainstorms. The total numbers of rainstorms with wet conditions under scenario A2 was 11 which are more than what occurred under scenario B2 which was 8. It should be noted that, the remaining rainstorms of the season with normal and dry conditions didn’t satisfy equilibrium case. Indeed the numbers of rainstorms with wet conditions are not important as much as the total rainfall depths. The summation of these 11 rainstorms depth (under scenario A2) is 280.3 mm and the summation of these 8 rainstorms depth (under scenario B2) is 186.2 mm (Table 4 and Table 7).
The comparison for the average rainfall seasons of rainfall under scenarios A2 and B2 (Table 5 and Table 8), showed that there were 12 and 15 events represent total numbers of rainstorms that might produce runoff with different hydraulic conditions that may occur during 2057-2058 and 2027-2028 under scenario A2 and B2 respectively. For these seasons, all the rainstorms with dry conditions didn’t produced runoff under both scenarios A2 and B2 due to low rainfall depths in addition the effect of dry CN.
The total runoff that might be harvested from all the basins for the average seasons under scenario A2 reached up to 4.96 million cubic meters (Figure 7) which was distributed in reservoir 1 to 5 as follows 2.63, 0.52, 0.24, 0.97, and 0.61 million cubic meters respectively. For the average season under scenario B2 the harvested water volume reached up to 6.11 million cubic meters (Figure 7) which was distributed in reservoir 1 to 5 as follows 3.24, 0.63, 0.30, 1.18, and 0.76 million cubic meters respectively.
For average rainfall scenarios, the scenario A2 produced harvested runoff less than scenario B2. This was due to the fact that, scenario A2 had 2 events with wet condition of 45.9 mm as a total rainfall depth and 4 events with normal condition with total rainfall depth of 97.8 mm. This is less relative to scenario B2 that had 4 events with wet condition of total rainfall depth of 81.5 mm and 6 events with normal condition of total rainfall depth of 137.1 mm.
The comparison for the minimum rainfall seasons under scenarios A2 and B2 (Table 6 and Table 9), showed that there were 5 and 8 rainstorms that may produce runoff with just dry and normal hydraulic conditions that may occur during 2090-2091 and 2081-2082 under scenario A2 and B2 respectively.
Due to limited number of rainstorms in these seasons, wet condition didn’t achieved.
For the minimum seasons of rainfall under scenarios A2 just one event of 27.0 mm of rainfall depth with normal condition produced runoff. While under scenarios B2 there were 3 events of 52.6 mm of total rainfall depth with normal condition produced runoff. When all basins are considered, the total runoff that might be harvested for the minimum rainfall season under scenario A2 reached up to 0.5 million cubic meters (Figure 7) which distributed in reservoir 1 to 5 as follows 0.26, 0.06, 0.03, 0.11, and 0.05 million cubic meters respectively. For scenario B2 however, the volume of harvested water reached up to 0.31 million cubic meters (Figure 7) which was distributed in reservoir 1 to 5 as follows 0.15, 0.04, 0.02, 0.08, and 0.02 million cubic meters respectively.
For minimum rainfall seasons, the water that might be harvested using scenario A2 was more than that of scenario B2. It should be noted that under both scenarios (A2 and B2) just one event with normal condition produced runoff due to combined effect of low rainfall depth and low dry CN values. The rainstorm depth under scenario A2 was 27.0 mm which is greater than that of scenario B2 (22.0 mm).
Macro RWH technique in the same study area was applied using recorded rainfall data for the period 2002-2012 [54] . In that work, season 2010-2011 represented the average rainy season of 548.8 mm (Figure 8).

Figure 8. Total average harvested runoff for the period 2002-2012 source: [54] .
The comparison of average runoff for the two periods (future and historical) can be achieved considering no change in curve number values and time period. Future forecasted rainfall extends on a period of 79 years (seasons 2020-2099). The results indicated those seasons 2057-2058 of A2 and 2027-2028 of B2 scenarios are very close to the average of the whole record as shown in Figure 7 (brown colour). Season 2010-2011; represent the average rainfall for the period 2002-2012 (11 years) as shown in Figure 8.
Although there is big difference between the years number of future and historical periods, but this kind of comparison may highlight the idea about the future of the study area and the validity of macro RWH technique with risk of uncertainty.
However, the results showed that the volume of total average harvested runoff for historical period was 10.72 million cubic meters, distributed on the reservoirs 1 to 5 as follows: 5730509.9, 1071155.6, 510044.7, 2002434.4, and 141184.3 cubic meters.
The comparison of average runoff for the two periods (future and historical) showed that the quantity of runoff for future period of both scenarios A2 and B2 reached up 4.96 or 6.11 million cubic meters respectively. This is less than that of the historical period that reached up 10.72 million cubic meters. This is due to the decrease of total average future rainfall, which is in agreement with the scenarios of climatic change. However, the percentage of average decrease in average total harvested runoff between historical and future period of scenario A2 is 53.73% and for scenario B2 is 43.0%, which is an important indicator about what might happen in hydraulic future events taking in to consideration the impact of climatic change which is associated with large uncertainties.
6. Conclusions
Regardless of the causes of climate change, the climate change might cause direct consequences affecting all life components including water scarcity.
Forecasted rainfall data can help to estimate hydraulic events such as runoff, then water harvesting techniques that can be used in future planning for agricultural activities in arid and semi-arid regions.
In this study RWH technique had been tested for future rainfall that was predicted by two emission scenarios of climatic change (A2 and B2). The results showed that: For maximum rainfall conditions, scenario A2 produced harvested runoff more than scenario B2 where the total runoff that might be harvested for the maximum seasons (2020-2021 under scenario A2) and (2046-2047 under scenario B2) reached 21.19 and 13.62 million cubic meters respectively.
For average rainfall conditions, scenario A2 produced harvested runoff less than scenario B2. The total runoff that for the average seasons 2057-2058 under scenario A2 and 2027-2028 under B2 reached 4.96 and 6.11 million cubic meters respectively.
During minimum rainfall conditions, scenario A2 produced harvested runoff more than scenario B2 where the harvested water for scenario A2 (2090-2091) and B2 (2081-2082) were 0.5 and 0.31 million cubic meters respectively.
The comparison of average runoff for the two periods (future and historical) can be estimated considering no change in curve number values and time period.
The results showed that the volume of total average harvested runoff for historical period was 10.72 million cubic meters.
The percentage of average decrease in average total harvested runoff between historical and future period of scenario A2 was 53.73% and B2 was 43.0%, which is an important indicator about what may happen in hydraulic future events taking into consideration the impact of climatic change which is associated with large uncertainties.
Acknowledgements
The authors would like to thank Mrs Semia Ben Ali Saadaoui of the UNESCO-Iraq for her encouragement and support. Deep thanks go to the Ministry of Higher Education and Scientific Research, Baghdad, Iraq; Mosul university, Mosul, Iraq for their support. Thanks for Sulaimaniyah University, Iraq for providing some related data.
The research presented has been financially supported by Luleå University of Technology, Sweden and by “Swedish Hydropower Centre—SVC” established by the Swedish Energy Agency, Elforsk and Svenska Kraftnät together with Luleå University of Technology, The Royal Institute of Technology, Chalmers University of Technology and Uppsala University. Their support is highly appreciated.
References
- Al-Ansari, N.A. (2013) Management of Water Resources in Iraq: Perspectives and Prognoses. Engineering, 5, 667-684. http://dx.doi.org/10.4236/eng.2013.58080
- Al-Ansari, N.A. (1998) Water Resources in the Arab Countries: Problems and Possible Solutions. UNESCO International Conference on World Water Resources at the Beginning of the 21st Century 3-6 June, Paris.
- Rogers, P. and Lydon, P. (1995) Water in the Arab World, Harvard University Press, Massachusetts.
- Biswas, A.K. (1994) International Waters of the Middle East—From Euphrates, Tigris to Nile. Oxford University Press, Bombay.
- World Resources Institute (WRI) (2002) Drylands, People, and Ecosystem Goods and 8Services: A Web-Based Geo-Spatial Analysis. http://www.wri.org
- Cherfane, C.C. and Kim, S.E. (2012) Arab Region and Western Asia, UNESCWA, in Managing Water under Uncertainty and Risk, UN World Water Development Report 4, Chapter 33.
- Barr, J., Grego, S., Hassan, E., Niasse, M., Rast, W. and Talafré, J. (2012) Regional Challenges, Global Impacts, in Managing Water under Uncertainty and Risk, UN World Water Development Report 4, Chapter 7.
- Bao, C. and Fang, C. (2007) Water Resources Constraint Force on Urbanization in Water Deficient Regions: A Case Study of the Hexi Corridor, Arid Area of NW China. Ecological Economics, 62, 508-517. http://dx.doi.org/10.1016/j.ecolecon.2006.07.013
- Al-Ansari, N.A., Alibrahiem, N., Alsaman, M. and Knutsson, S. (2014) Water Demand Management in Jordan. Engineering, 6, 19-26. http://dx.doi.org/10.4236/eng.2014.61004
- Perry, C.J. and Bucknall, J. (2009) Water Resource Assessment in the Arab World: New Analytical Tools for New Challenges. In: Jagannathan, N.J., Mohamed, A.S. and Kremer, A., Eds., Water in the Arab World: Management Perspectives and Innovations, World Bank, Middle East and North Africa Region, Washington.
- Hiniker, M. (1999) Sustainable Solutions to Water Conflicts in the Jordan Valley. Green Cross International, Geneva.
- Sadik, A.K. and Barghouti, S. (1995) The Water Problems of the Arab World: Management of Scarce Water Resources. In: Rogers, P. and Lydon, P., Eds., Water in the Arab World, Harvard University Press., Massachusetts, 4-37.
- Postel, S. (1992) Last Oasis—Facing Water Scarcity. Worldwatch Institute WW Norton & Co, New York.
- Charrier, B. and Curtin, F. (2000) A Vital Paradigm Shift to Maintain Habitability in the Middle East: The Integrated Management of International Watercourses. In: Water for Peace in the Middle East and Southern Africa, Green Cross International, Geneva, 11-17.
- Intergovernmental Panel on Climate Change (IPCC) (2007) Climate Change Impacts, Adaptation and Vulnerability. Cambridge University Press, Geneva.
- Al-Ansari, N.A. and Baban, S. (2005) Rainfall Trends in the Badia Region of Jordan. Surveying and Land Information Science, 65, 233-243.
- Al-Ansari, N.A., Salameh, E. and Al-Omari, I. (1999) Analysis of Rainfall in the Badia Region, Jordan. Al-Bayt University Research Paper No. 1, 66 p.
- Al-Ansari, N.A., Al-Shamali, B. and Shatnawi, A. (2006) Statistical Analysis at Three Major Meteorological Stations in Jordan. Al Manara Journal for Scientific Studies and Research, 12, 93-120.
- Medany, M. (2008) Impact of Climate Change on Arab Countries. Chapter 9. http://www.afedonline.org/afedreport/english/book9.pdf
- Oweis, T. and Hachum, A. (2004) Water Harvesting and Supplemental Irrigation for Improved Water Productivity of Dry Farming Systems in West Asia and North Africa, “New directions for a Diverse Planet”. Proceedings of the 4th International Crop Science Congress, 26 September-1 October 2004, Brisbane. http://www.cropscience.org.au.
- Voss, K.A., Famiglietti, J.S., Lo, M.H., Linage, C., Rodell, M. and Swenson, S. (2013) Groundwater Depletion in the Middle East from GRACE with Implications for Transboundary Water Management in the Tigris-Euphrates-Western Iran Region. Water Resources Research, 49, 904-914. http://dx.doi.org/10.1002/wrcr.20078
- IPCC (The Intergovernmental Panel on Climate Change) (2000) Summary for Policymakers, Emissions Scenarios, Special Report of IPCC Working Group III. IPCC, 4-5.
- Zakaria, S., Al-Ansari, N.A. and Knutsson, S. (2014) Future Prospects for Macro Rainwater Harvesting (RWH) Technique in Northwest Iraq. Journal of Earth Sciences and Geotechnical Engineering, 4, 1-16.
- Al-Ansari, N.A. and Knutsson, S. (2011) Toward Prudent Management of Water Resources in Iraq. Journal of Advanced Science and Engineering Research, 1, 53-67.
- Al-Ansari, N.A., Ezz-Aldeen, M., Knutsson, S. and Zakaria, S. (2013) Water Harvesting and Reservoir Optimization in Selected Areas of South Sinjar Mountain, Iraq. ASCE Journal of Hydrologic Engineering, 18, 1607-1616. http://dx.doi.org/10.1061/(ASCE)HE.1943-5584.0000712
- Zakaria, S., Al-Ansari, N.A., Knutsson, S. and Ezz-Aldeen, M. (2012) Rainwater Harvesting and Supplemental Irrigation at Northern Sinjar Mountain, Iraq. Journal of Purity, Utility Reaction and Environment, 1, 121-141.
- Zakaria, S., Al-Ansari, N.A., Knutsson, S. and Ezz-Aldeen, M. (2012) Rainwater Harvesting at Eastern Sinjar Mountain, Iraq. Journal of Geoscience Research, 3, 100-108.
- Milly, P.C.D., Dunne, K.A and Vecchia, A.V. (2005) Global Patterns of Trends in Streamflow and Water Availability in a Changing Climate. Nature, 438, 347-350.
- Giorgi, F. (2006) Climate Change Hotspots. Geophysical Research Letters, 33, L08707.
- Hailemariam, K. (1999) Impact of Climate Change on the Water Resources of Awash River Basin, Ethiopia, Climate Research. International and Ultidisciplinary Journal, 12, 91-96.
- Folland, C.K. and Karl, T.R. (2001) Observed Climate Variability and Change. In: Houghton, J.T., Ding, Y., Griggs, D.J., Noguer, M., Van der Linden, P.J., Dai, X., Maskell, K. and Johnson, C.A., Eds., Climate Change 2001: The Scientific Basis, Contribution of Working Group 1 to the 3rd IPCC Scientific Assessment, Cambridge University Press, Cambridge and New York, 99-181.
- Zhang, X., Hogg, W. and Mekis, E. (2001) Spatial and Temporal Characteristics of Heavy Precipitation Events in Canada. Journal of Climate, 14, 1923-1936. http://dx.doi.org/10.1038/nature04312
- Mantis, H.T., Repapis, C.C., Philandras, C.M., Paliatsos, A.G. and Amanatidis, G.T. (1994) The Spatial and Temporal Structure of the Precipitation Climate the Eastern Mediterranean, Background for a Study of Climate Change, EUR 17458. In: Ghazi, A., Mathy, P. and Zerefos, C., Eds., Eastern Europe and Global Change, Greece, 125-131.
- Metaxas, D.A., Philandras, C.M., Nastos, P.T. and Repapis, C.C. (1999) Variability of Precipitation Pattern in Greece during the Year. Fresenius Environmental Bulletin, 8, 1-6.
- Paliatsos, A.G., Nastos, P.T., Tzavelas, G. and Panagiotakos, D.B. (2005) Characteristics of Precipitation in Urban Athens Area, from 1891 to 2000. Fresenius Environmental Bulletin, 14, 422-428.
- Pnevmatikos, J.D. and Katsoulis, B.D. (2006) The Changing Rainfall Regime in Greece and Its Impact on Climatological Means. Meteorological Applications, 13, 331-345.
- Feidas, H., Noulopoulou, N., Makrogiannis, T. and Bora-Senta, E. (2007) Trend Analysis of Precipitation Time Series in Greece and Their Relationship with Circulation Using Surface and Satellite Data: 1955-2001. Theoretical and Applied Climatology, 87, 155-177. http://dx.doi.org/10.1007/s00704-006-0200-5
- Nastos, P.T. (2008) Spatial and Temporal Variation of Rain Intensity in Greece. Proceedings of 8th International Hydrogeological Congress, Athens, 651-660.
- Al-Ansari, N.A., Abdellatif, M., Ali, S. and Knutsson, S. (2014) Long Term Effect of Climate Change on Rainfall in Northwest Iraq. Central European Journal of Engineering.
- Al-Ansari, N.A., Abdellatif, M., Ezeelden, M., Ali, S. and Knutsson, S. (2014) Climate Change and Future Long Term Trends of Rainfall at North-Eastern Part of Iraq. Journal of Civil Engineering and Architecture.
- Philandras, C.M., Nastos, P.T., Kapsomenakis, J.K., Douvis, C., Tselioudis, G. and Zerefos, C.S. (2011) Long Term Precipitation Trends and Variability within the Mediterranean Region. Natural Hazards and Earth System Science, 11, 3235-3250. http://dx.doi.org/10.5194/nhess-11-3235-2011
- Takle Eugene, S. (2011) Assessment of Potential Impacts of Climate Changes on Iowa Using Current Trends and Future Projections. Climate Science Program, Iowa State University, Ames. http://climate.engineering.iastate.edu/document/climate_changes_for_iowa_12.pdf
- Al-Ansari, N.A., Assaid H.I. and Salim, V.N. (1981) Water Resources in Iraq. Journal of the Geological Society, 15, 35-42.
- FAO (2008) Water Profile of Iraq.
- Siegert, K. (1994) Introduction to Water Harvesting: Some Basic Principles for Planning, Design and Monitoring. Water Harvesting for Improved Agricultural Production. In: Proceedings of the FAO Expert Consultation, Cairo, Rome.
- Boers, T.M. and Ben-Asher, J. (1982) A Review of Rainwater Harvesting. Agriculture Water Management, 5, 145-158. http://dx.doi.org/10.1016/0378-3774(82)90003-8
- Prinz, D. (1996) Water Harvesting: Past and Future. In: Pereira, L.S., Ed., Sustainability of Irrigated Agriculture. Proceedings of the NATO Advanced Research Workshop, Vimeiro, 21-26.03.1994,, 135-144.
- Critchley, W. and Siegert, C. (1991) Water Harvesting Manual. FAO Paper AGL/MISC/17/91, FAO, Rome.
- Zakaria, S., Al-Ansari, N.A. and Knutsson, S. (2013) Rainwater Harvesting Using Recorded and Hypothetical Rainfall Data Scenarios. Journal of Earth Sciences and Geotechnical Engineering, 3, 21-42.
- Chow, V., Maidment, D. and Mays, L. (1988) Applied Hydrology. McGraw Hill, New York, 147-151.
- Williams, J.R. (1995) The EPIC Model. In: Singh, V.P., Ed., Computer Models of Watershed Hydrology, Chapter 25, Water Resources Publications, Highlands Ranch.
- Neitsch, S.L., Arnold, J.G., Kiniry, J.R. and Williams, J.R. (2005) Soil and Water Assessments Tool Theoretical Documentation. 102. http://swat.tamu.edu/media /1292/swat2005theory.pdf
- ASCE/EWRI Curve Number Hydrology Task Committee (2009) Curve Number Hydrology: State of the Practice. In: Hawkins, R.H., Ward, T.J., Donald, E.W. and VanMullem, J.A., Eds., American Society of Civil Engineers, Reston, 116.
- Zakaria, S., Yaseen, T., Mustafa, D.A., Mohammed, S., Ali, S., Al-Ansari, N.A. and Knutsson, S. (2013) Estimation of Annual Harvested Runoff at Sulaimaniyah Governorate, Kurdistan Region of Iraq. Journal of Natural Science, 5, 1272-1283. http://dx.doi.org/10.4236/ns.2013.512155
- Buringh, P. (1960) Soils and Soil Conditions of Iraq. Ministry of Agriculture, Agricultural Research and Projects, Baghdad.
- Šimák, P. (2009) Hydrological Study of the Ashibaram Dam. Ph.D. Dissertation, Royal Institute of Technology (KTH), Stockholm.
NOTES

*Corresponding author.