Journal of Water Resource and Protection
Vol.6 No.4(2014), Article ID:43934,9 pages DOI:10.4236/jwarp.2014.64025
Numerical Groundwater Flow Modeling of the Coastal Plain Sand Aquifer, Akwa Ibom State, SE Nigeria
Aniekan Edet1,2*, Ramadan Abdelaziz2, Broder Merkel2, Chiedu Okereke1, Therese Nganje1
1Department of Geology, University of Calabar, Calabar, Nigeria
2Departement for Geology, TU Bergakademie Freiberg, Freiberg, Germany
Email: *aniekanedet@yahoo.com, aniekanedet25@gmail.com
Copyright © 2014 by authors and Scientific Research Publishing Inc.
This work is licensed under the Creative Commons Attribution International License (CC BY).
http://creativecommons.org/licenses/by/4.0/


Received 1 December 2013; revised 3 January 2014; accepted 2 February 2014
ABSTRACT
Akwa Ibom State is located in the Niger delta region of Nigeria. The coastal plain sand aquifer, which underlies the area, is the major source of potable water for domestic, agricultural, and industrial use. The increase in demand for water has led to an increased exploitation of the aquifer in the last few years. Hence it is essential to quantify the amount of exploitable water in the aquifer. To achieve this goal, a regional numerical groundwater flow model using MODFLOW was calibrated under steady-state conditions to determine the aquifer’s hydraulic conductivity (K) and the recharge characteristics of the area. The hydraulic conductivity and recharge values from the pilot points calibration ranged from 1 to 75 m/d and 5.89 × 10⁻⁶ m3/d to1.23 × 10−4 m3/d. The calculations of the model showed that the average recharge rate amounts 0.40l/s/km2 or 12.60 mm/year. The estimated recharge suggests a high groundwater potential for the area. This is the first time that such a study has been carried out in the area, and it will serve as an important basis for future groundwater management and simulation of transient groundwater flow modeling in Akwa Ibom State.
Keywords:Akwa Ibom; Coastal Aquifer; Modeling; MODFLOW

1. Introduction
Akwa Ibom State was founded 26 years ago. According to the census figures, the population was 2,409,613 inhabitants in 1991, while in 2006, 3,902,051 people lived in the area. This growing population alongside expansion of urban, agricultural and industrial activities has led to an increase in the demand for water in the area. The demand is partly achieved by the indiscriminate sinking of boreholes by individuals, communities, private organizations, government at local, state and federal levels and donor agencies including UNICEF, EU, ADB, the World Bank, etc. All these activities result in an increase in groundwater abstraction from the main hydrogeological unit, the Coastal Plain Sand aquifer.
What worsens the situation is the lack of a law enabling the control of the abstraction of groundwater in the area. Hence, there is a need for an effective management document to be in place for conserving and controlling the use of the available groundwater resource. This study therefore is the first attempt to numerically model groundwater flow under steady-state conditions in Akwa Ibom State. The main objective is to develop a regionalscale steady-state groundwater flow model for the area. Minor objectives include the determination of hydraulic conductivity and recharge characteristics using available hydrogeological information and applying inverse modeling technique based on the pilot point and zonation techniques.
2. Study Area
2.1. Geographic Setting
Akwa Ibom State shown in Figure 1 [1] , is the one of the coastal states in the Niger delta region of Nigeria covering an area of about 7081 km2, extending between latitudes 4321 - 5331 north and longitudes 7251 - 8251 east. It is about 150 km long and its width varies between 60 km in the north and 100 km in the south with an average elevation of about 60 masl. The area is bounded on the south by the Atlantic Ocean, on the southwest by Imo River and southeast by Cross River. On the northwest, north and north east the area is bounded by Cretaceous to Tertiary sediments. Precipitation is high in the south (>3000 mm/a) and decreases northwards (<2000 mm/a) with an average of 2500 mm/a [2] . Air temperature (26˚C - 28˚C) is uniform throughout the year [2] [3] . During dry season, the water level in rivers and streams decreases suggesting that part of the river is recharging the aquifer besides precipitation. Pan evaporation rates vary between 4.6 and 5.0 mm/d [2] . The Akwa Ibom area lies within the region of Nigeria, which is characterized by equatorial climate and tropical rainforest [4] .
2.2. Geologic Setting
The geology of the Akwa Ibom area has been extensively studied by [5] -[9] . As presented in these publications, the area is underlain by late Cretaceous to Quaternary sediments. The lowermost sediment is lateritic sandstone with minor shale of the Maastrichtian Nsukka Formation. Throughout the Paleocene to Early Eocene, a thick shale intercalated with sandstone and limestone was deposited (Imo Shale Formation), while in the middle of the Eocene semi-consolidated sandstone, siltstone and minor shale were deposited (Bende Ameki Formation). Since the Miocene-Oligocene grit and sand with intercalations of clay and lignite beds were deposited constituting the Ogwashi-Asaba Formation. Overlying this formation is a thick sequence of gravel, sand, silt, and clay constituting the Benin Formation also known as the Coastal Plain Sands and alluvial ridges.
2.3. Hydrogeologic Setting
The area has three hydrostratigraphic units including the Alluvial Deposit, Coastal Plain Sand and Lower Sand Aquifers [10] [11] . The Coastal Plain Sand aquifer is the most extensive and is separated from the Lower Sand aquifer by the Imo Shale aquiclude. The aquifer is composed of sand, gravel, and sandstone with clay intercalations. The thickness of the aquifer varies between 35 m in the north and 200 m in the south. The aquifer is considered to be semi-confined or unconfined, especially in the southern parts of the area. The main groundwater flow direction is from north to south into the Atlantic Ocean. There are also variations in the northeast-southwest and northwest-east directions into the Imo River and the Cross River.
3. Groundwater Flow Model
Based on the knowledge of hydrogeological system, a steady state mathematical model of the coastal plain sand aquifer was developed. The area of study is 7081 km2, therefore the model has a regional character. The hydrogeological conditions were defined from more than 200 boreholes drill log. Borehole data were obtained from [1] .
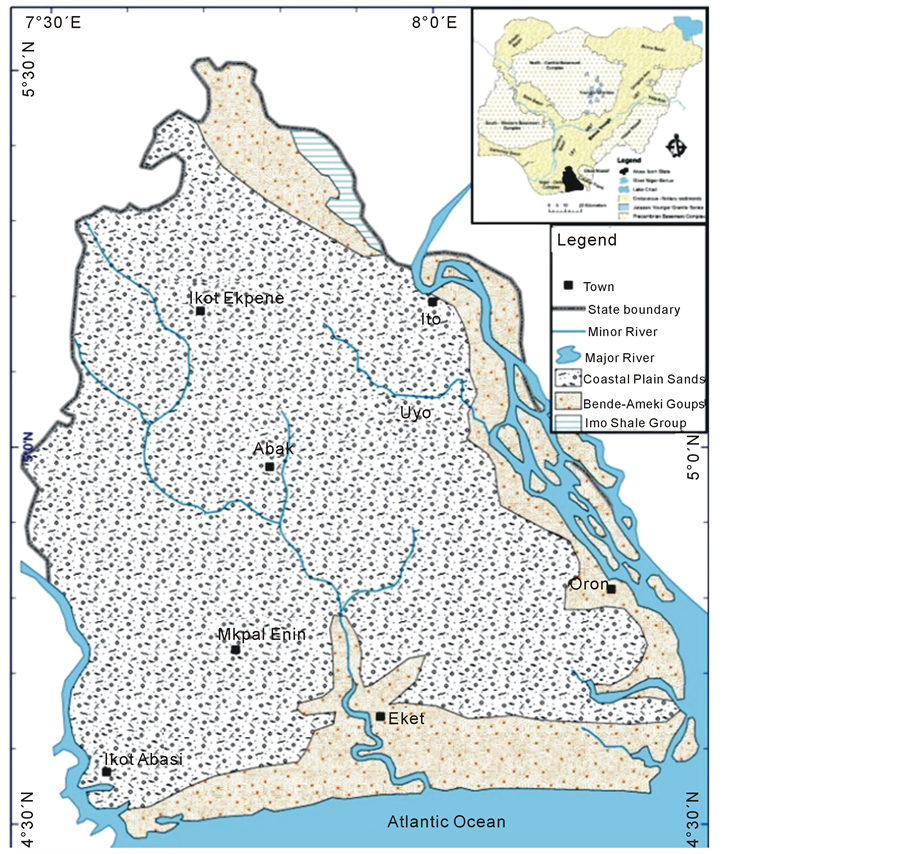
Figure 1. Map of the study area, Akwa Ibom State, Nigeria (Adapted from Emmanuel, 2013).
together with data from limited field visits were used to conceptualize a hydrogeological model for the area. The conceptual model was translated into a numerical model and calibrated under steady-state conditions, using the 1980 data. The study employed the Modular Finite Difference groundwater flow simulation code, MODFLOW developed by [12] and modified by [13] . A preand a post-processor, Groundwater Modeling System (GMS), developed by the Environmental Modeling Research Laboratory of Brigham Young University [14] was used to interface with MODFLOW. The GMS software consists of a core module, the “calculation module” for a number of codes (i.e. MODFLOW, MT3DMS, MODPATH, etc.) and a series of independent subroutines called “modules”, which simulate a specific feature, which characterizes the hydrogeological system. The GMS allows for several alternatives to solve the inverse problem. Here PEST, a model-independent optimizer [15] [16] was used to accomplish the task. PEST has some similarities with existing nonlinear parameter estimation software; it has been designed to allow interfacing with any model without having to make changes to the model [17] . MODFLOW was used for the study because the program is well documented in the public domain code and has been used in almost all terrains of the world and found to produce reliable results [18] -[20] .
3.1. Hydrogeological Conceptual Model
A hydrogeological conceptual model is developed by taking into account all available geological and hydrogeological data, including aquifer parameters and groundwater level observations [19] . The development of the conceptual model includes two main objectives (i) process identification and model structure identification. These processes represent the best description of the hydrogeological system of the area under consideration based on available data and hydrogeological understanding of the area [21] .
The study area has been characterized to achieve the most representative conceptual model. Lithology was grouped into three main units, namely, sand, gravelly sand, and clay. Based on the characterization, it is concluded that the sand/gravelly sand and the clay layers are hydraulically connected. The three layers were then merged to constitute a single equivalent layer with an equivalent hydraulic conductivity and a thickness equal to the sum of their thicknesses. This approach of an equivalent single monolayer model is, however, consistent with hydraulic head measurements which did not show any significant difference for the different layers. This is necessary as a multilayer model will be difficult and unrealistic due to limited data to calibrate such a model.
Survey of groundwater levels overtime demonstrate that they vary slightly. Hence groundwater levels measured in 1980 by [2] , which to date are most reliable are assumed to represent steady-state conditions. Groundwater levels range from 3.20 to 63.48masl in the modeled area. Groundwater flow in the aquifer is governed by the conditions at the boundary of the regional system [18] . The boundary conditions for the area are approximated as constant head with the Atlantic Ocean in the south. The southwest and southeast along Imo River and Cross River were considered as river boundaries, while the northwest, north and northeast were taken as no-flow boundaries as presented in Figure 2.
The rate of recharge varies within the modeled area. Six recharge zones have been demarcated based on the amount of rainfall, topography, vegetation, aquifer cover and land-use pattern. Importantly, high recharge is expected in the southern part with high precipitation (>3000 mm/a), gentle topography and sandy aquifer cover. Recharge decreases northwards with reduced precipitation (<2000 mm/a), moderate to high topography and clayey aquifer cover. The mean stream flow of the rivers for the modeled area varies between 8.32 m3/s for the upstream of Kwa Iboe River and 2533 m3/s for downstream of Cross River.
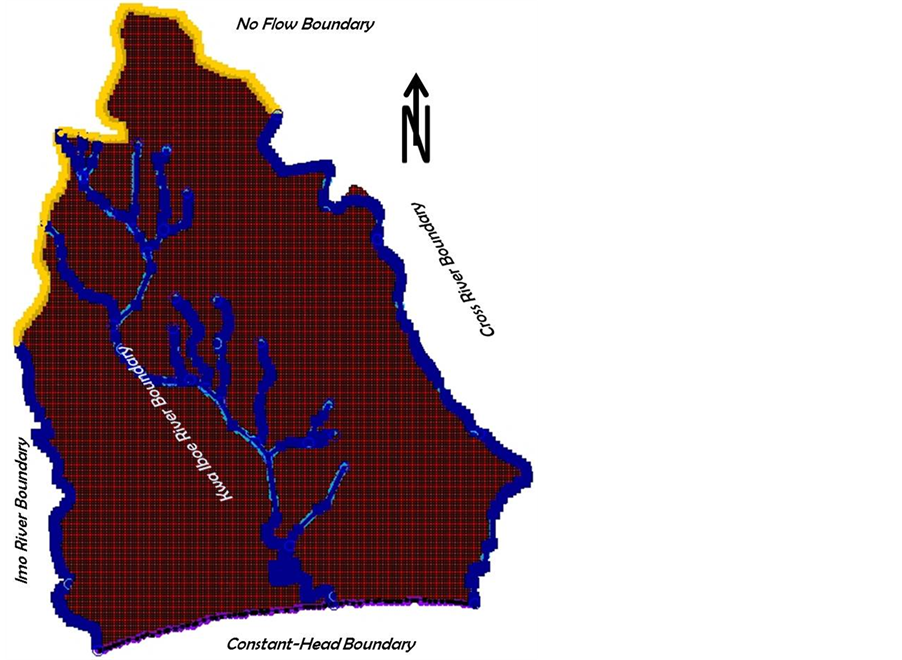
Figure 2. Grid for the groundwater flow model and boundary conditions.
3.2. Numerical Modeling
A mathematical model is the assembly of numerical data sets that reflect the conceptual model, and the computer-coded package of equations that enable calculation of changes in water level or pressures in the various geological strata to be calculated. As mentioned earlier, MODFLOW a public domain groundwater flow modeling software package was used to evaluate the Coastal Plain Sand aquifer of Akwa Ibom area. MODFLOW was applied to construct an equivalent single-layer two-dimensional mathematical model of the aquifer under study using all the available hydrogeological, hydrological, pumping and climate data developed from the extensive investigation by [2] and limited own fieldwork.
The origin of the model is 326000.00 m in x-direction and 489000.00 m in y-direction (UTM WGS 1984, zone 32N). The aquifer system was divided into 207 columns and 252 rows; the total number of grid cells was 52164 of which 27,877 were active, while 24,287 were inactive. Grid spacing in the active zone in both x and y directions was 500 m resulting in a modeled area of 6840 km2.
Due to the availability of historical and reliable data on hydraulic head at a number of wells in 1980, it was chosen as the calibration year. The water level for the modeled area ranged between 3.2 m in the south and 63.48 m in the north with respect to mean sea level. The model input parameters include transmissivity (T), hydraulic conductivity (K), storage coefficient (S), recharge (R), well discharge (Q), river influence and boundary conditions. Based on the data obtained from [2], K varied from 1.37 to 75 m/d with a mean value of 14.5 m/d. However, an initial value of 10 m/d was assigned to the hydraulic conductivity at a set of chosen pilot points. The ranges and mean values of T and S are 35 - 120 m2/d (average 76.2 m2/d) and 0.001 - 0.12 m2/d (average, 0.036 m2/d). In the Akwa Ibom area, more than 3000 wells and boreholes are tapping the aquifer. The available records of groundwater extraction for domestic and commercial water supply were used to estimate the annual discharge. The well discharge ranged between 523.7 and 4828 m3/d (mean 2765.6 m3/d).
Rivers and streams contribute water to the aquifer system and vice versa depending on the hydraulic gradient between the two systems. In order to address the aquifer-river interactions, the conductance of the river bed was estimated to be 0.01 m/d with a thickness of 0.1 m. The river bed elevation and mean depth of water at each cell were obtained from [2] and topographical map of the area. The river stage varied between 3.3 m at downstream of Kwa Iboe River and 89.6 m at upstream of Cross River.
3.3. Steady-State Model Calibration
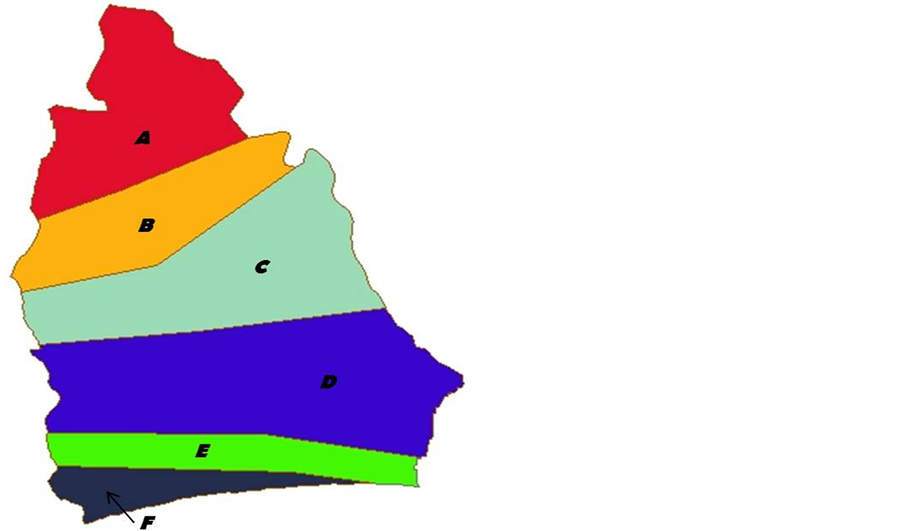
The model was calibrated by varying the aquifer’s hydraulic conductivity (K) and aquifer’s recharge (R). Following the work of [17] , K and R were initially assumed to be unknown. These parameters vary spatially; K was assumed to vary randomly, hence Pilot Point method [16] was used for parameterization. In case of recharge, zonation was adopted as parameterization technique to convert its spatial variability to zones of uniform values estimated in the calibration process (Figure 3(a)). By that six recharge areas were determined as shown in Figure 3(a): 1) lower southern recharge area, F; 2) middle southern recharge area, E; 3) upper southern recharge area, D; 4) lower northern recharge area, C; 5) middle northern recharge area, B; and 6) upper northern recharge area, A. Figure 3(b) shows the pilot points demonstrating hydraulic conductivity with initial values of 10 m/d.
Values of hydraulic conductivity at these points were calculated during the calibration process of the model. The method of pilot points requires a defined interpolation method to estimate spatial distribution of the calibration parameters using the values at the designated pilot points. The inverse distance technique was adopted for interpolating between pilot points.
The calibrated water level for 1980 is shown as Figure 4. The modeled heads satisfactorily fit in with the observed data. The standard error (SE) of the calculated head is 1.11 m, which is satisfactory [19] . The SE is based on the formula, SE = [∑(ch-oh)2/N]1/2, where, ch is the calculated head, ob the observed head and N the number of observation points. The goodness of fit for the plot of calculated and observed groundwater levels presented as Figure 5 also give an indication of the accuracy of the calibration.
4. Discussion and Conclusion
4.1. Discussion
The recharge values for the different zones that provide the best fit are 1.23 × 10⁻⁴ m3/d for zone A, 5.09 × 10⁻⁶ m3/d for zone B, 4.05 × 10⁻⁴ m3/d for zone C, 5.00 × 10⁻⁴ m3/d for zone D, 2.47 × 10⁻⁵ m3/d for zone E and 4.96 ×
 (a)
(a) 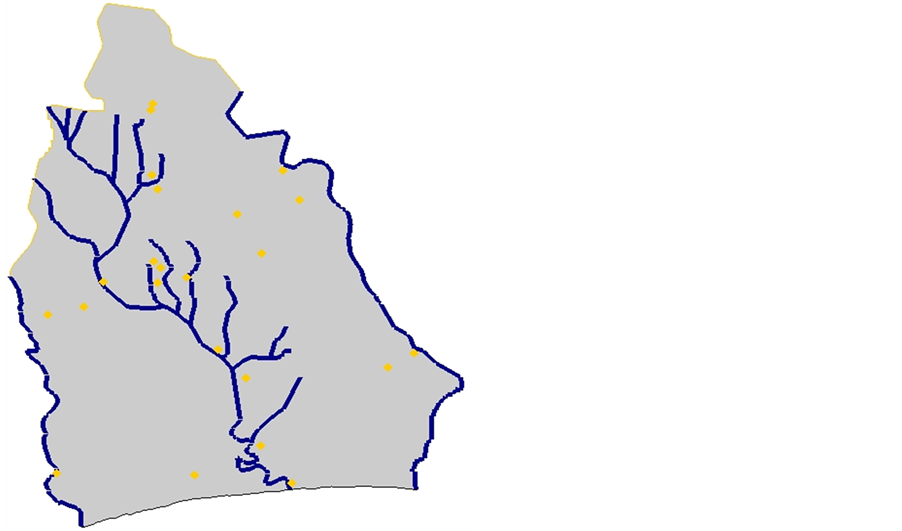 (b)
(b)
Figure 3. Calibrated (a) recharge zones and (b) pilot point for hydraulic conductivity (KH) in the modeled Akwa Ibom area.

Figure 4. Distribution of simulated groundwater heads ofthe Akwa Ibom area green, yellow, and red bars are indications for the difference between calibrated and measured water levels. Most of the color bars have green color, which indicates that these bars lie within the calibration target. Only one bar in red color at Ikot Ekpene lies outside the calibration target of this study. obs pt-observation point.
10−5 m3/d for zone F. The amount of precipitation, topography, type of aquifer cover, vegetation and land use pattern play an important role for the differences in recharge rates as explained earlier. Besides that the geomorphological features also play an important role. For instance, the topography of the area rises from near-sea level in the south to about 150 m in the north of the area [3] . In the flat areas in the south, the floodplains with recent alluvial deposits and beach ridges are filled with water most time of the year compared to the undulating sandy coastal plain in the central parts of Akwa Ibom and sandstone ridges/hills with steep-sided valleys in the north [3] . Such depressions in the south act as recharge points to the groundwater system in the south [22] . The hydraulic conductivity values from the pilot point calibration ranged from 1 to 75 m/d. The variations in calculated hydraulic conductivity values presented in Figure 6 indicate that the highest K values coincide with areas of unconsolidated sands and gravels and high recharge in the modeled area.
The main objective of the study was to assess the groundwater resources in the Coastal Plain Sand aquifer of Akwa Ibom State. For that purpose, groundwater flow balance and its components were calculated for the year 1980. The results are shown inTable 1. As can be seen in Table 1, the average recharge infiltration rate

Figure 5. Relationship between calculated and observed heads (in metres).

Figure 6. Estimated hydraulic conductivity values for the area using pilot point method.

Table 1. Simulated water balance for the modeled area.
amounts 0.40l/s/km2 i.e. 12.60 mm/yr. Thus renewable resources through infiltration recharge amounted to almost 235722.26 m3/d in the whole Akwa Ibom State Coastal Plain Sand aquifer in 1980. The rest of the inflow to the Akwa Ibom aquifer system comes from infiltration from the rivers. The outflow from the aquifer is mainly through natural discharge and well discharge.
4.2. Conclusions
Within the study a groundwater flow model was developed and calibrated for steady-state conditions in the study area for the year 1980.
The mathematical calculations of the model showed that the average recharge infiltration rate amounts 34.46 m3/d/km2. The recharge amounts 235722.26 m3/d.
The estimated recharge suggests high groundwater potential for the area. This is the first time that such a study was carried out in the area, and will serve as an important basis for future groundwater management and simulation of unsteady-state groundwater modeling of Akwa Ibom State.
Acknowledgements
The authors thank the Alexander-von-Humboldt foundation, Bonn (Germany) for providing fellowship to the first author to Germany where part of this work was done at the Department of Hydrogeology, Institute of Geology, TU Bergakademie, Freiberg, Germany. The second author is grateful to Profs T. N. Olsthoorn, Amro Elfeki and Ali Subyani and Drs Mahmoud Bakra and Hany Gomaa for their encouragement. Thanks to the anonymous reviewers for the valuable comments and suggestions.
References
- Emmanuel, C.C. (2013) Monitoring the Quality of Groundwater and Leachate Contamination near Waste Dump in Coastal Plain Sand Aqufer. M.Sc. Thesis, University of Calabar, Calabar.
- Tahal Consultants (1980) Rural Water Supply in Mainland (Cross River State) Master Plan. Unpublished.
- Petters, S.W. (1988) Akwa Ibom State: Soil and Landuse. Unpublished, 23-24.
- Iloeje, N.P. (1991) A New Geography of Nigeria. Longman Ltd., Benin.
- Reyment, R.A. (1965) Aspects of the Geology of Nigeria. University of Ibadan Press, Ibadan.
- Short, K.C. and Stauble, A.J. (1967) Outline of the Geology of Niger Delta. American Association of Petroleum Geologist Bulletin, 51, 661-779.
- Murat, R.C. (1970) Stratigraphy and Paleogeography of Cretaceous and Lower Tertiary in the Southern Nigeria. In: Dessauvagie, T.F.G. and Whiteman, A.J., Eds., African Geology, University of Ibadan Press, Ibadan, 251-266.
- Kogbe, C.A. (1989) Geology of Nigeria. Rock View (Nigeria) Limited, Jos, 325-334.
- Wright, J.B. (1989) Review of the Origin and Evolution of the Benue Trough in Nigeria. In: Kogbe, C.A., Eds., Geology of Nigeria, Rock View (Nigeria) Limited, Jos, 359-376.
- Edet, A.E. (1993) Groundwater Quality Assessment in Parts of Eastern Niger Delta. Environmental Geology, 22, 41- 46. http://dx.doi.org/10.1007/BF00775283
- Esu, E.O., Okereke, C.S. and Edet, A.E. (1999) A Regional Hydrostratigrahic Study of Akwa Ibom State. Global Journal of Pure and Applied Sciences, 5, 89-96.
- McDonald, M.G. and Harbaugh, A.W. (1988) A Modular Three-Dimensional Finite Difference Groundwater Flow Model. US GeolSurv Open File Rep 83-875, chap A1.
- Harbaugh, A.W. (2005) MODFLOW-2005. The US Geological Survey Modular Groundwater Model—The Groundwater Flow Process. US Geological Survey Techniques and Model Methods 6-A16.
- EMRL (2004) Groundwater Modeling System (GMS) version 5.0 Help File, Environmental Modeling Research Laboratory, Brigham Young University, Provo.
- Doherty, J. (1994) PEST-Model-Independent Parameter Estimation. Watermark Computing, Corinda.
- Doherty, J. (2003) Groundwater Model Calibration Using Pilot Points and Regularization. Groundwater, 41, 170-177. http://dx.doi.org/10.1111/j.1745-6584.2003.tb02580.x
- Abdelaziz, R. and Bakr, M.I. (2012) Inverse Modeling of Groundwater Flow of Delta Wadi El-Arish. Journal of Water Resource and Protection, 4, 432-438. http://dx.doi.org/10.4236/jwarp.2012.47050
- Ebraheem, A.W., Riad, S., Wycisk, P. and Sefelnasr, A.M. (2004) A Local Scale Groundwater Flow Model for Groundwater Resources Management in Dakhla Oasis, SW Egypt. Hydrogeology Journal, 12, 714-722. http://dx.doi.org/10.1007/s10040-004-0359-8
- Varni, R.M. and Usunoff, E.J. (1999) Simulation of Regional-Scale Groundwater Flow in the Azul River Basin, Buenos Aires Province, Argentina. Hydrogeology Journal, 7, 180-187. http://dx.doi.org/10.1007/s100400050190
- Yidana, S.M. and Chegbleh, L.P. (2013) The Hydraulic Conductivity Field and Groundwater Flow in the Unconfined Aquifer System of Keta Strip, Ghana. Journal of African Earth Sciences, 86, 45-52. http://dx.doi.org/10.1016/j.jafrearsci.2013.06.009
- Carrera, J., Mousavi, S., Usunoff, E., Sanchez-Vila, X. and Galarza, G. (1993) A Discussion on Validation of Hydrogeological Models. Reliability Engineering & System Safety, 42, 201-216. http://dx.doi.org/10.1016/0951-8320(93)90089-H
NOTES

*Corresponding author.