Journal of Water Resource and Protection
Vol.5 No.12A(2013), Article ID:41599,5 pages DOI:10.4236/jwarp.2013.512A001
Calibration of Hargreaves-Samani Equation for Estimating Reference Evapotranspiration in Sub-Humid Region of Brazil
1Academic Unity of Garanhuns, Federal Rural University of Pernambuco, Garanhuns, Brazil
2Nuclear Energy Department, Federal University of Pernambuco, Recife, Brazil
3Academic Unity of Serra Talhada, Federal Rural University of Pernambuco, Serra Talhada, Brazil
4Land Development Department, Office of Science for Land Development, IRD, Montpellier, France
Email: romualdo@uag.ufrpe.br, acda@ufpe.br, suzanam@ufpe.br, cabol@ufpe.br, eduardosouza@uast.ufrpe.br, claude.hammecker@ird.fr
Copyright © 2013 José Romualdo de Sousa Lima et al. This is an open access article distributed under the Creative Commons Attribution License, which permits unrestricted use, distribution, and reproduction in any medium, provided the original work is properly cited. In accordance of the Creative Commons Attribution License all Copyrights © 2013 are reserved for SCIRP and the owner of the intellectual property José Romualdo de Sousa Lima et al. All Copyright © 2013 are guarded by law and by SCIRP as a guardian.
Received October 24, 2013; revised November 25, 2013; accepted December 14, 2013
Keywords: Reference Evapotranspiration; Penman-Monteith; Hargreaves-Samani; Air Temperature
ABSTRACT
Reference evapotranspiration (ETo) is an important parameter used in numerous applications, such as climatological and hydrological studies, as well as for water resources planning and management. There are several methods to estimate ETo, being that the FAO Penman-Monteith (EToPM) method is considered standard. This method needs many parameters (solar radiation, air temperature, humidity and wind speed), however there are still many uncovered areas, suggesting the need for methods of calculating evapotranspiration based on few meteorological elements, such as air temperature. Therefore, this study aimed to determine the ETo by Hargreaves-Samani method in the experimental watershed of the “Riacho do Papagaio” farm, in county of São João, in north-eastern Brazil, using data of 2011 and 2012. Reference evapotranspiration estimated by non-calibrated Hargreaves-Samani method (EToHS) was overestimated in all months (RMSE = 1.43 mm·d−1), mainly in months of lower evaporative demand (from May to July). Because of these tendencies, this method cannot be used in its original form to estimate ET for this region; therefore, a calibration of radiation adjustment coefficient (kRs) was performed. The calibrated Hargreaves-Samani method (EToHSc) had better performance (RMSE = 0.52 mm·d−1), being suitable for predicting ETo in this region.
1. Introduction
Evapotranspiration is one of the major components in the hydrological cycle, and its reliable estimation is essential to water resources planning and management. Furthermore, it is necessary to quantify ET for work dealing with water resource management or environmental studies. ET quantification frequently must be preceded by the determination of reference evapotranspiration (ETo) [1].
There are several methods to estimate ETo, but their performance in different environments is diverse, since all of them have some empirical background. The FAO Penman-Monteith (EToPM) method has been considered as a universal standard to estimate ETo for more than a decade. This method considers many parameters related to the evapotranspiration process: net radiation, air temperature, vapor pressure deficit and wind speed; and it has presented very good results when compared to data from lysimeters populated with short grass or alfalfa [2].
However, the number of meteorological stations where all of these parameters are observed is limited in many areas of the globe. The number of stations where reliable data for these parameters exist is an even smaller subset. This is especially true in developing countries where reliable collection of wind speed, humidity and radiation is limited [3]. The FAO Penman-Monteith method is also appropriate for the calibration of other ETo estimation equations. The utilization of these calibrated ETo equations is recommended in the absence of data of any of the meteorological parameters necessary for the application of EToPM [4].
Hargreaves and Samani [5] developed an alternative approach to estimate ETo where only mean maximum and mean minimum air temperature and extraterrestrial radiation are required (the Hargreaves-Samani method is referred to hereafter as HS). Because extraterrestrial radiation can be calculated for a certain day and location, only minimum and maximum temperatures are the parameters that require observation [2].
The HS method has been successfully compared with the EToPM using full datasets, or with grass lysimeter data, indicating that the HS method performs well in most climatic regions, with the exception of humid area where it tends to overestimate ETo [6]. The HS method is usually preferred with respective to other more complicated equations since it is reasonably adequate and requires only maximum and minimum air temperatures [7].
Therefore, the objective of this study was to evaluate the performance of the HS method to estimate ETo, in São João, Pernambuco, Brazil.
2. Material and Methods
2.1. Experimental Site, Climate and Soil
The study site was located at the “Riacho do Papagaio” Farm, in the Mundaú representative basin, county of São João, state of Pernambuco (8˚52'30"S, 36˚22'00"W, elevation 705 m) in north-eastern Brazil (Figure 1). The study was conducted throughout the year in 2011 and from February to December in 2012.
According to data from the Water and Climate Agency of Pernambuco [8] the total annual rainfall is 782.0 mm, and the wettest trimester consists of the months of May, June and July. The soil at the experimental site is classified as Neosoil Regolithic [9], which corresponds to Entisol in the American Soil Taxonomy [10].
2.2. Field Measurements
A micro-meteorological tower was established in the centre of the experimental field, and sensors were installed to record measurements of reference evapotranspiration. The dry and wet bulb temperatures were measured using integrated temperature-humidity probes (model HMP45C, Vaisala, Campbell Scientific Inc., Logan, UT, USA). The wind speed (U) was monitored with cup anemometers (model 014 A, Campbell Scientific Inc., Logan, UT, USA). The measurements were collected at 2.0 m above the top of the crop canopy.
Net radiation (Rn) was measured with a net radiometer
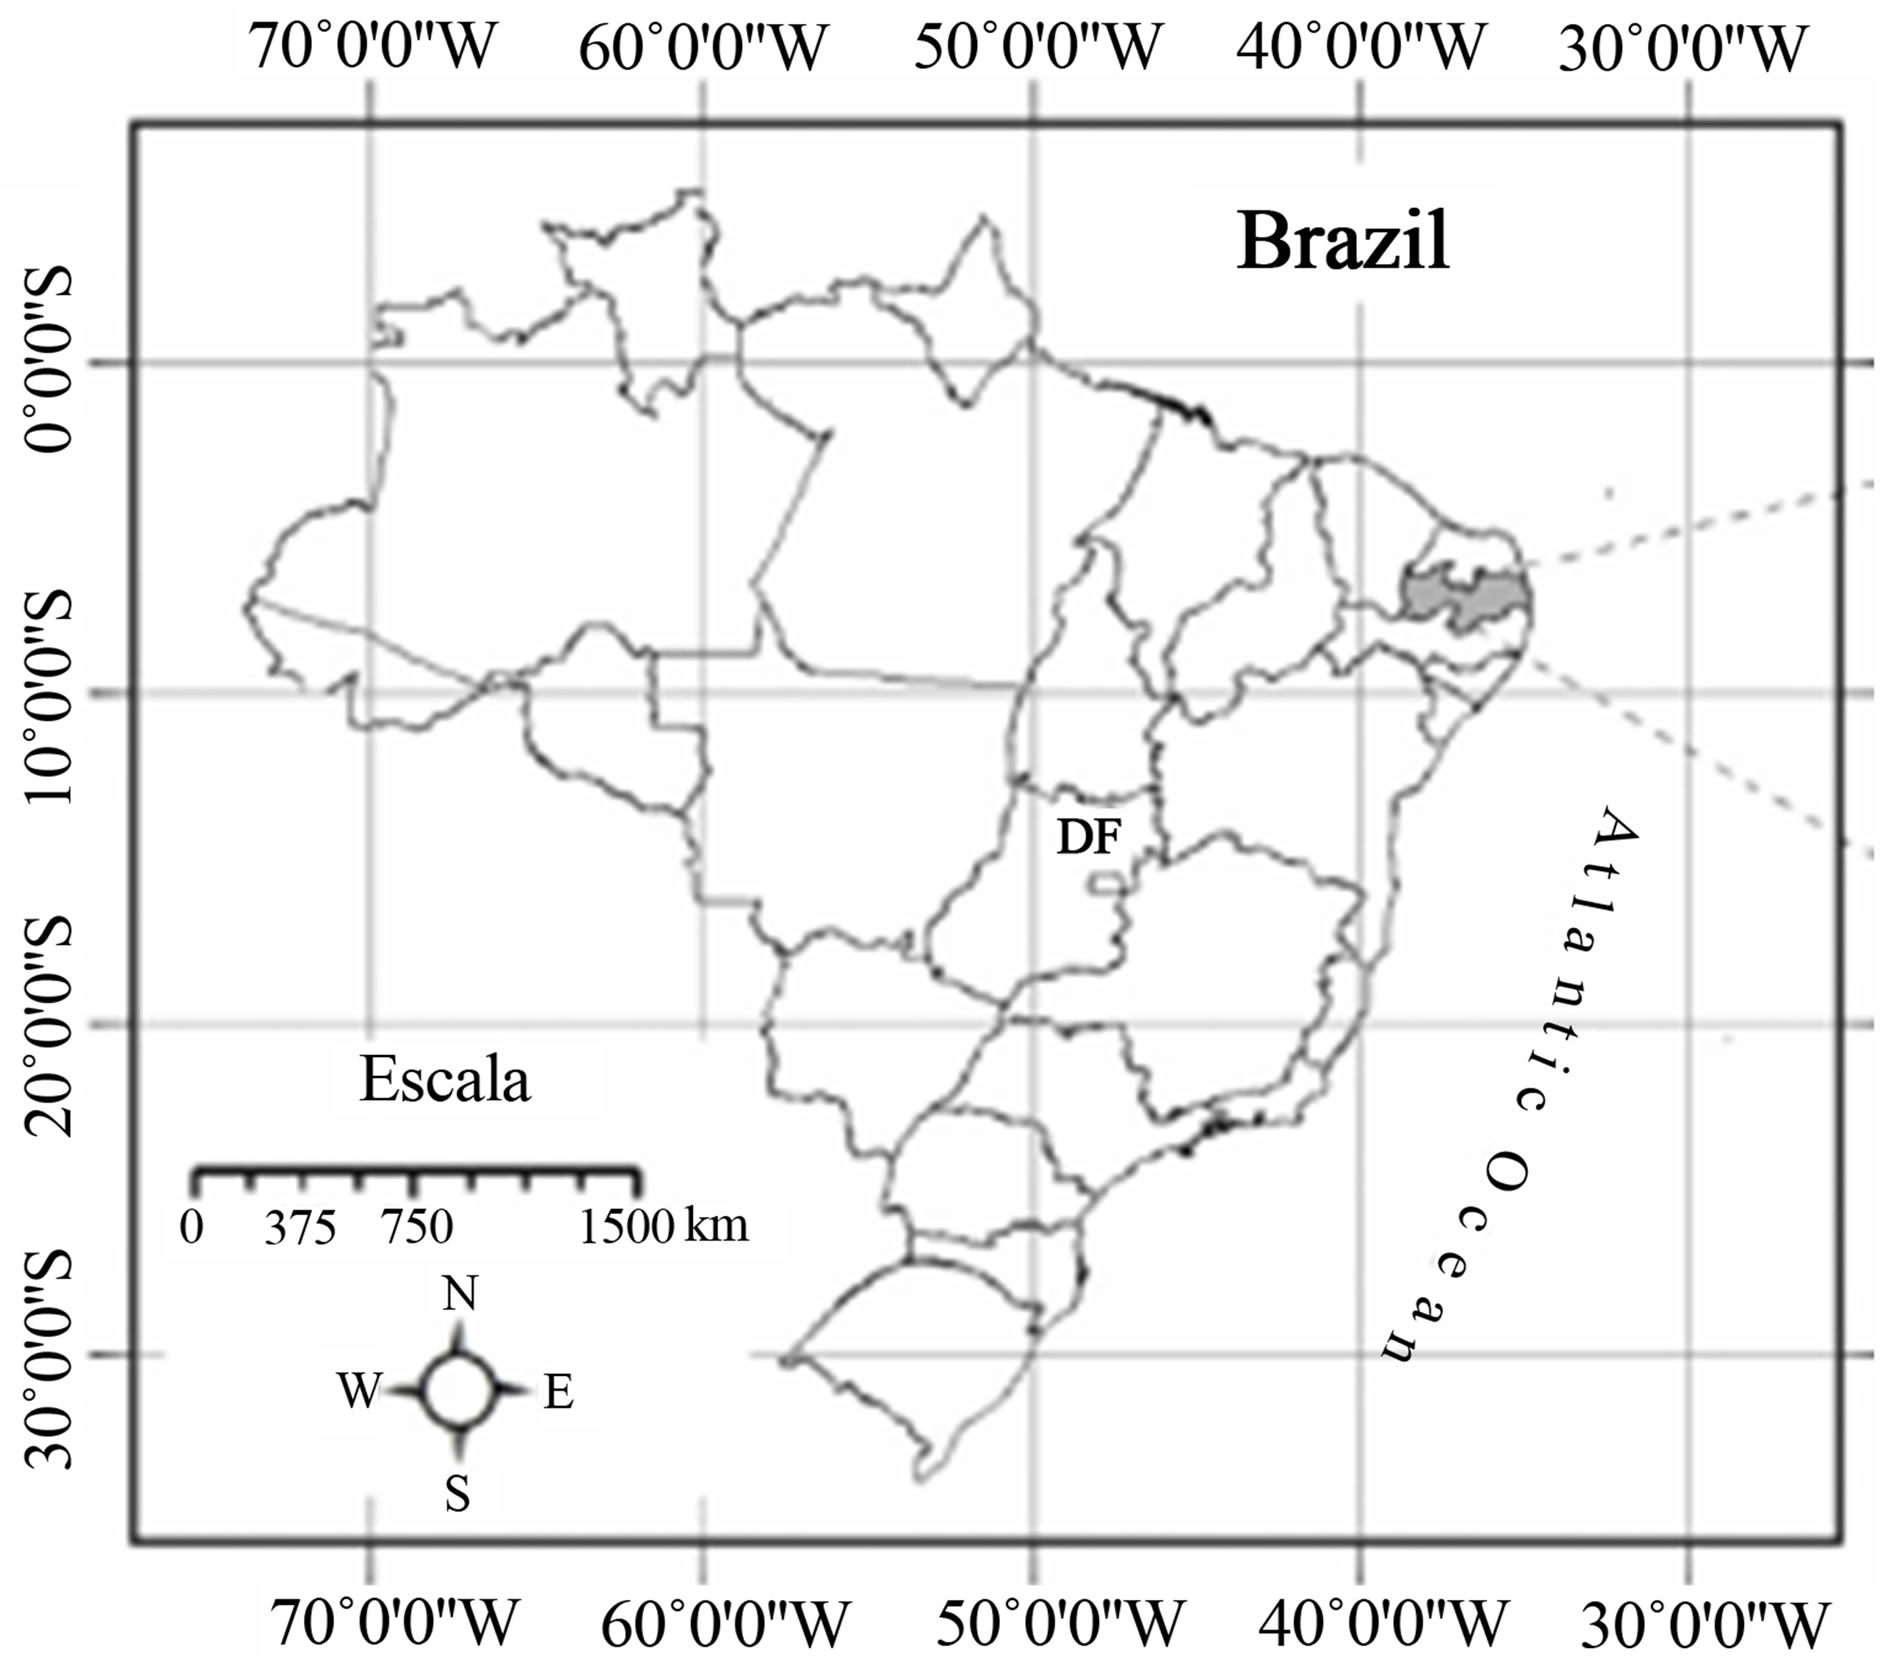
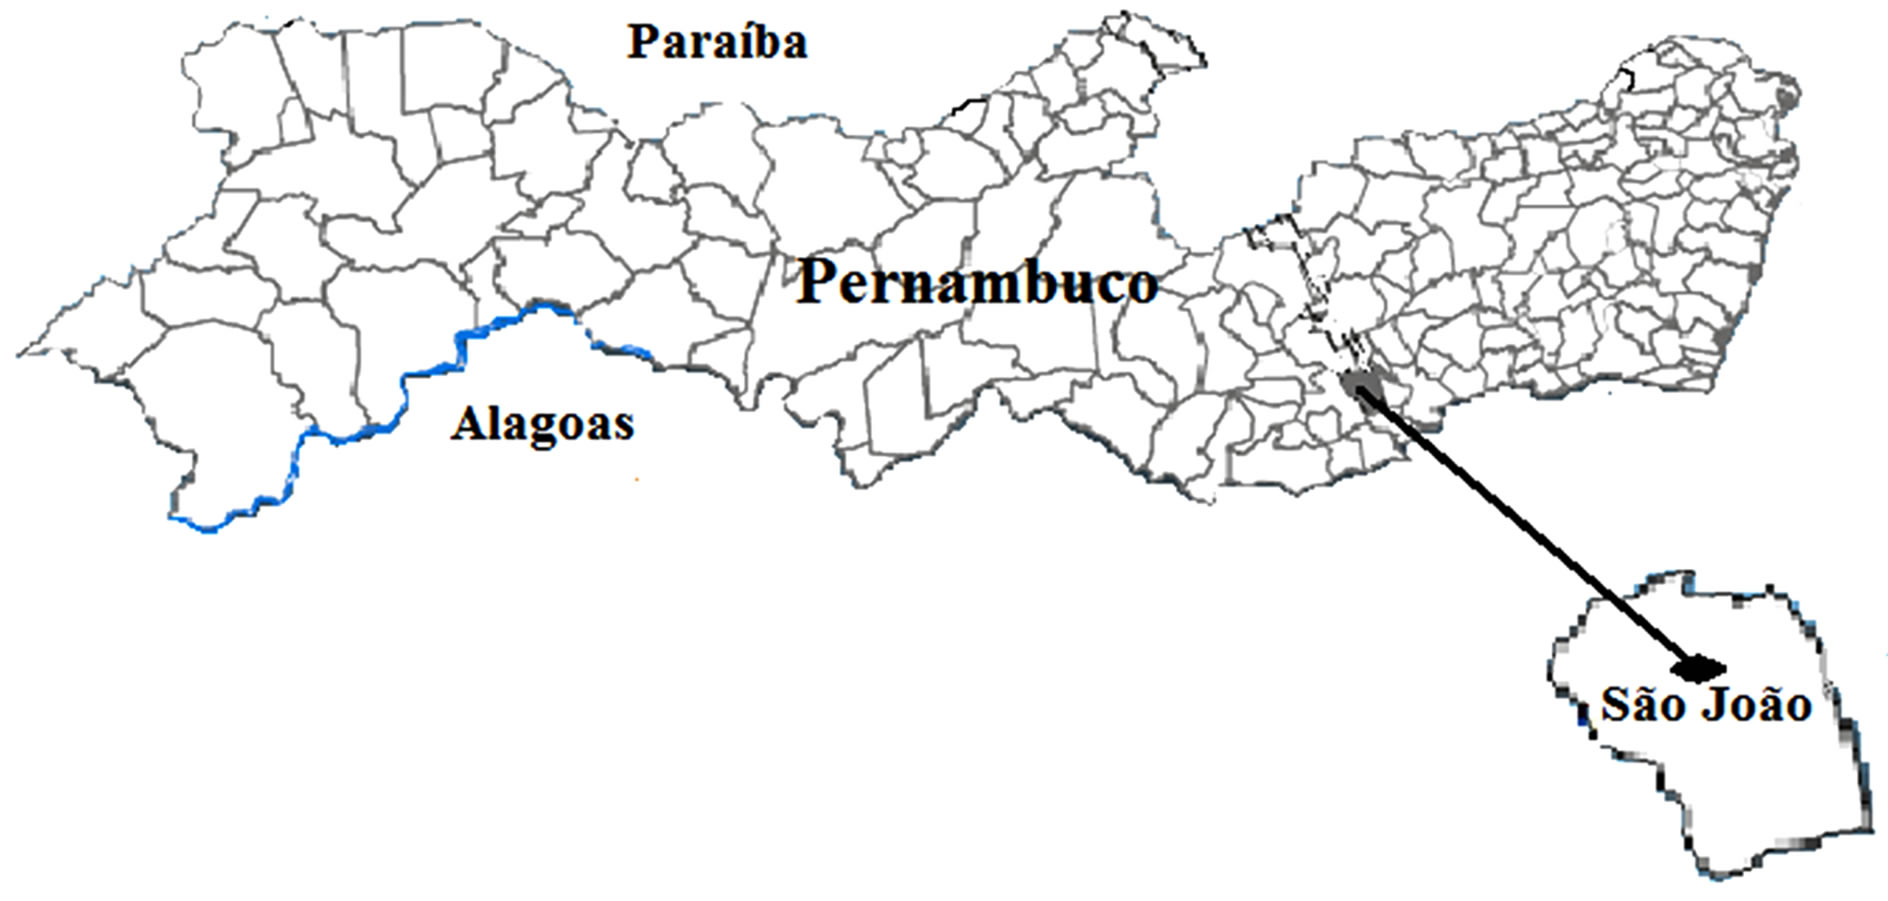
Figure 1. Map of the study site.
(model Q7 net radiometer, REBS, Seattle, WA, USA) installed 2.0 m above the vegetation surface. The solar global radiation (Rs) was measured with a pyranometer (model LI-200X, LI-COR Inc., Lincoln, NE, USA). The soil heat flux (G) was measured using two-soil heat flux plates (model HFT3, REBS, Seattle, WA, USA) inserted at 0.05 m below the soil surface. Two temperature sensors (model 108L, Campbell Scientific Inc., Logan, UT, USA) were also located at 0.02 and 0.08 m below the soil surface to calculate the surface ground heat flux. The measurements from all of the sensors were recorded by a data logger (model CR10X, Campbell Scientific Inc., Logan, UT, USA) every 60 s. The mean/sum data were logged every 1800 s.
2.3. Evapotranspiration Estimation Methods
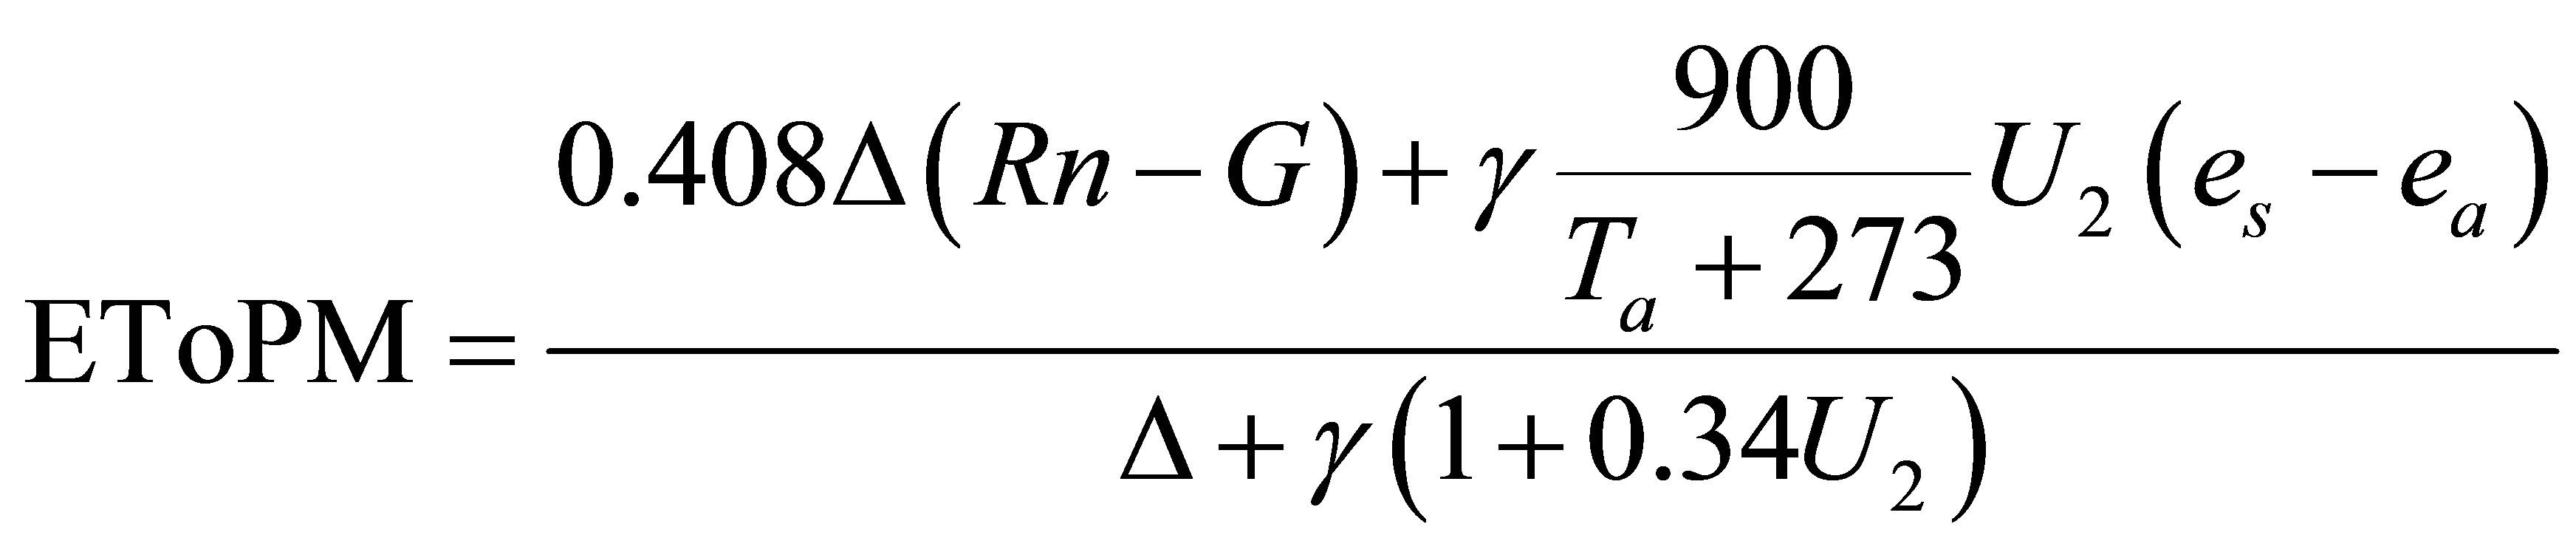
The FAO Penman-Monteith method for calculating ETo can be expressed as [11]:
 (1)
(1)
where EToPM is the reference crop evapotranspiration (mm·d-1), Rn is the net radiation (MJ·m-2·d-1), G is the soil heat flux (MJ·m-2·d-1), is the rate of the change of saturation vapour pressure with temperature (kPa·˚C -1), γ is the psychometric constant (kPa·˚C-1) es is the saturation vapor pressure (kPa), ea is the actual vapor pressure (kPa), Ta is the average daily air temperature (˚C), and U2 is the mean daily wind speed at 2 m (m·s-1). The computation of all data required for calculating ETo were performed following Allen et al. (1998).
The HS method requires only observed Tmin (˚C) and Tmax (˚C) for the estimation of ETo (mm·d−1), which is given as:
 (2)
(2)
where Ra is the extraterrestrial radiation (mm·d-1), 0.0135 is a factor for conversion from American to the International system of units and kRs is the radiation adjustment coefficient. In the common version of HS equation the value kRs = 0.17 is used [12].
2.4. Calibration and Validation of HS Method
To calibrate the HS equation, the slope of the regression between daily EToPM and daily EToHS was forced to pass through the origin. The calibration coefficient was then obtained by calculating the product of the slope of the regression lines and the original coefficient.
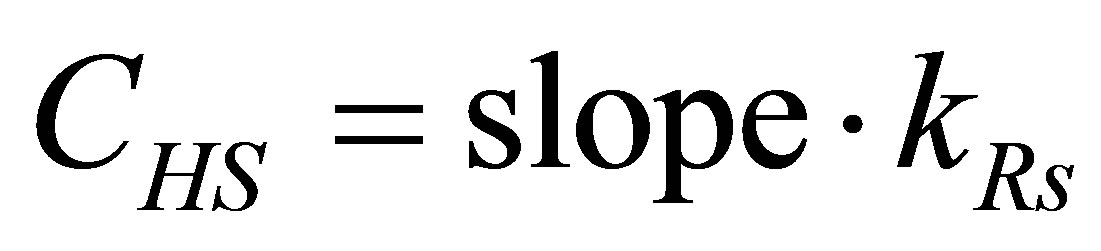 (3)
(3)
where CHS is the new calibration coefficient for the Hargreaves-Samani method (the Hargreaves-Samani method calibrated is referred to hereafter as HSc). The data of 2011 were used for calibration and data of 2012 were used for validation.
2.5. Evaluation Criteria
In this study, the root mean square error (RMSE), correlation coefficient (r) and index of agreement “d” [13] were used for the evaluating HS and HSc methods. The RMSE and index d are defined as:
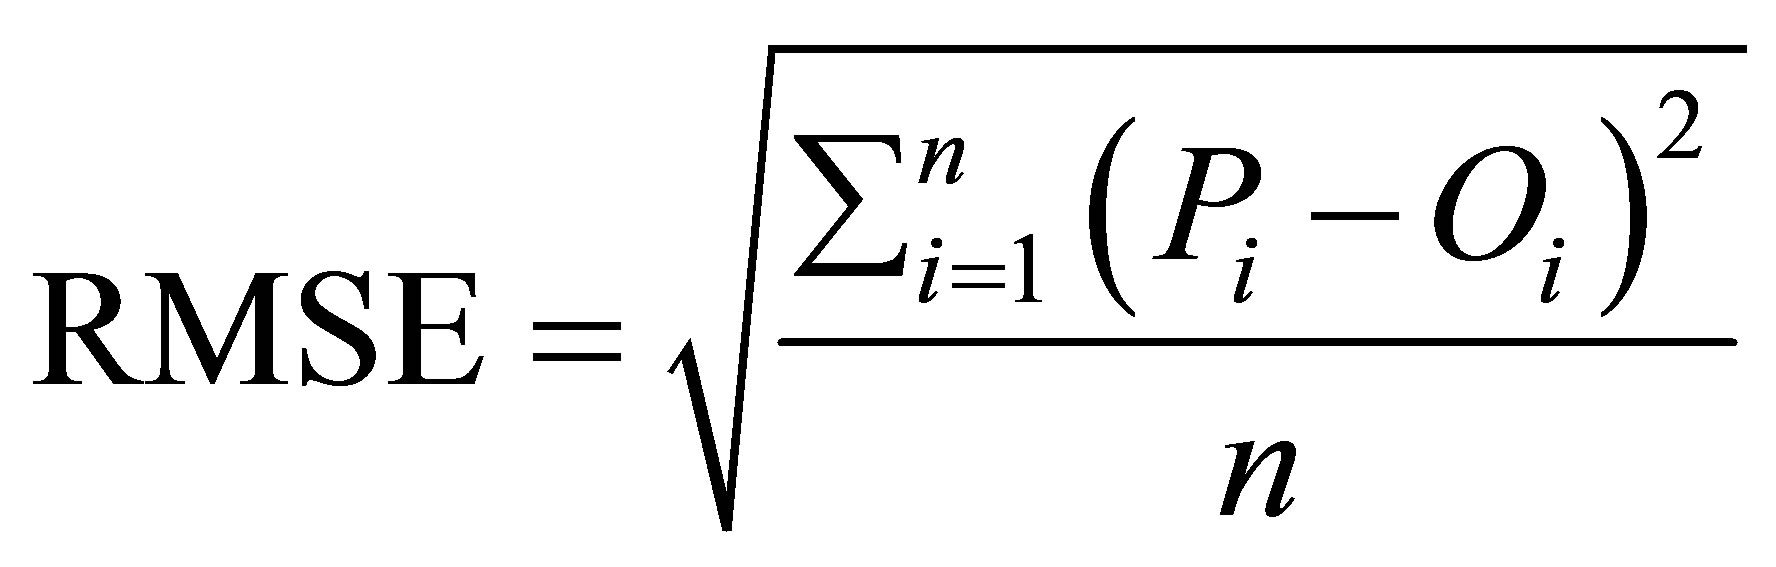 (4)
(4)
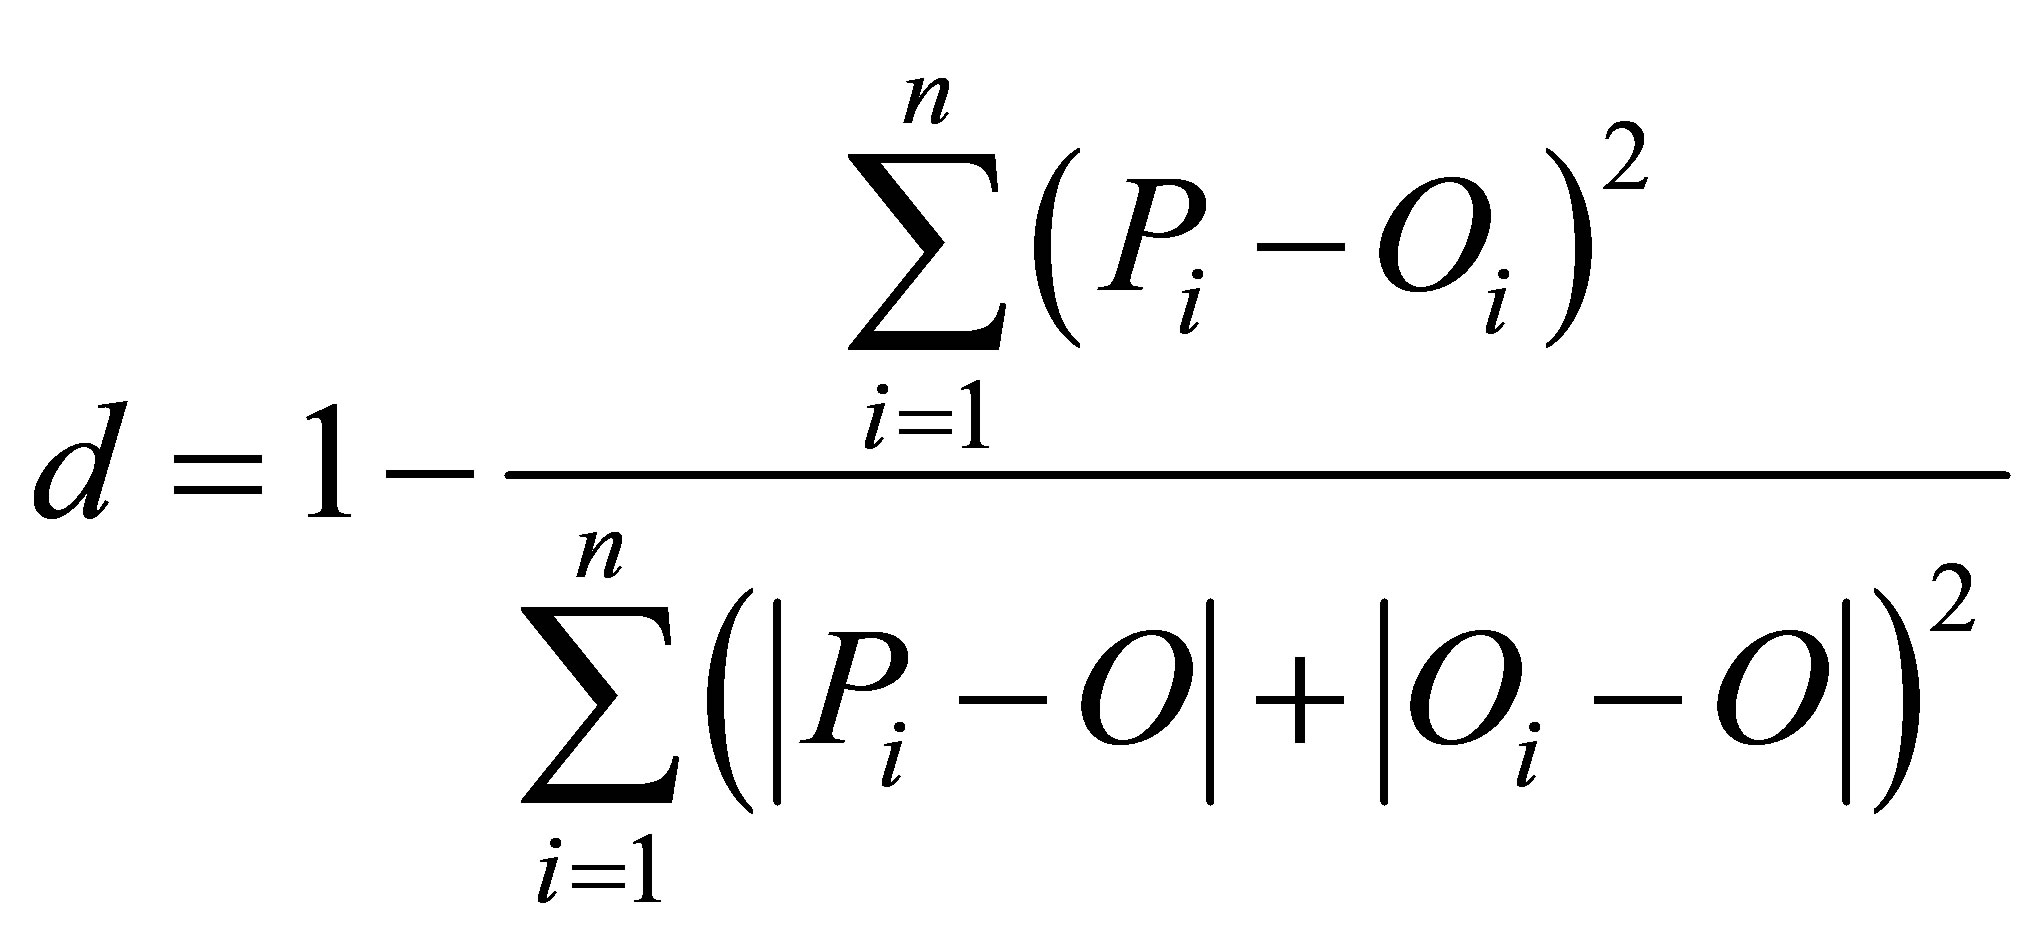 (5)
(5)
where Pi and Oi are the predicted and observed values, respectively; O is the average of Oi, and n is the total number of data.
3. Results and Discussion
Figure 2 shows the comparisons of estimated mean monthly ETo values using EToPM and HS methods in

Figure 2. Comparison of mean monthly EToPM and EToHS and methods in São João, Pernambuco, Brazil, during the year of 2011.
2011. The non-calibrated Hargreaves-Samani method (EToHS) overestimated the ETo in all months, mainly in months of lower evaporative demand. However, this method showed the same tendency in the evolution of monthly ETo values, when compared to EToPM method. The values of EToPM varied from 1.9 to 4.1 mm·d−1, with average of 3.2 mm·d−1, while the values of ETHS varied from 3.3 to 5.4 mm·d−1, and mean ETo was 4.3 mm·d−1.
The relationship between daily values of EToPM and EToHS in 2011 and 2012 (non calibrated) is showed in Figure 3.
The HS method estimates have a close relationship with estimates from the Penman-Monteith method with the coefficients of determination (r2) of 0.78 in 2011 and 0.74 in 2012. However the general tendency of the EToHS is to overestimate ETo, which can be seen by the regression slope and by the regression intercept. These results contradict findings by Moeletsi et al. [14] in different environmental conditions in South Africa which showed an underestimation by the HS method. Allen et al. [11] have indicated that high humidity conditions (as in this study) may result in an overestimation by HS method of ETo.
The statistical analysis (Table 1) shows that estimate of ETo by HS method (non-calibrated) had RMSE higher in 2012 (1.43 mm·d−1) than in 2011 (1.21 mm·d−1). The index d was lower in 2012 (non-calibrated) than in 2011, indicating low agreement of ETo estimated by Hargreaves-Samani method in this year.
Because of these tendencies, this method cannot be used in its original form to estimate ET for this study. However, accordingly Droogers and Allen [3], it is possible that accuracy of this method can be improved by
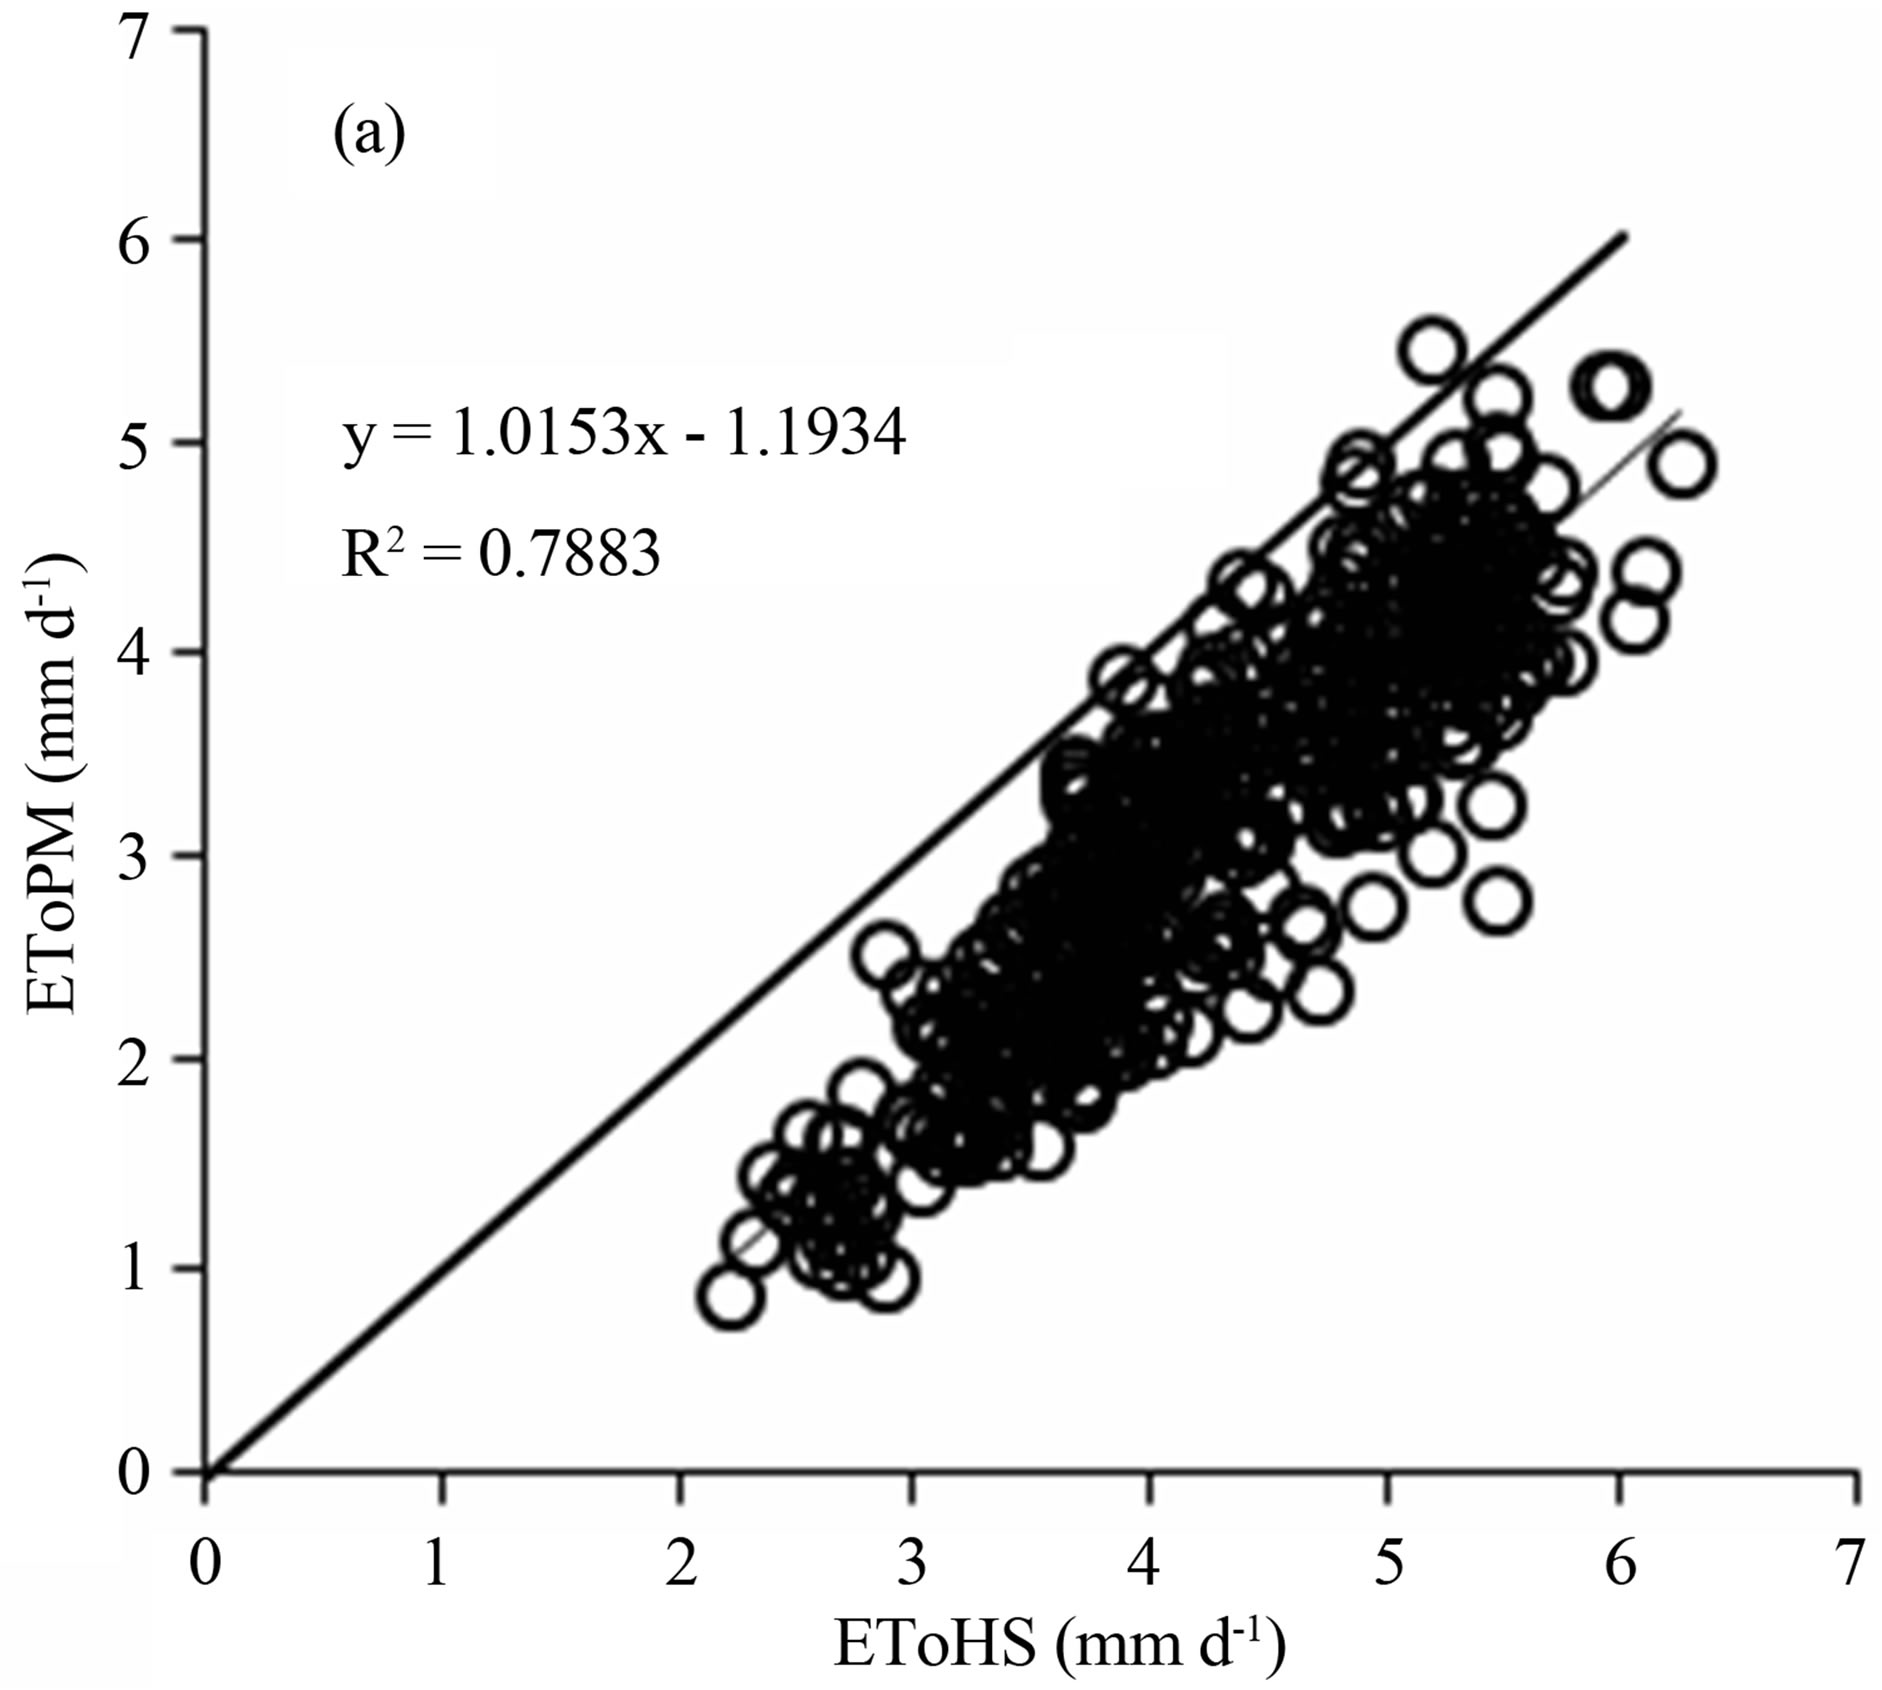
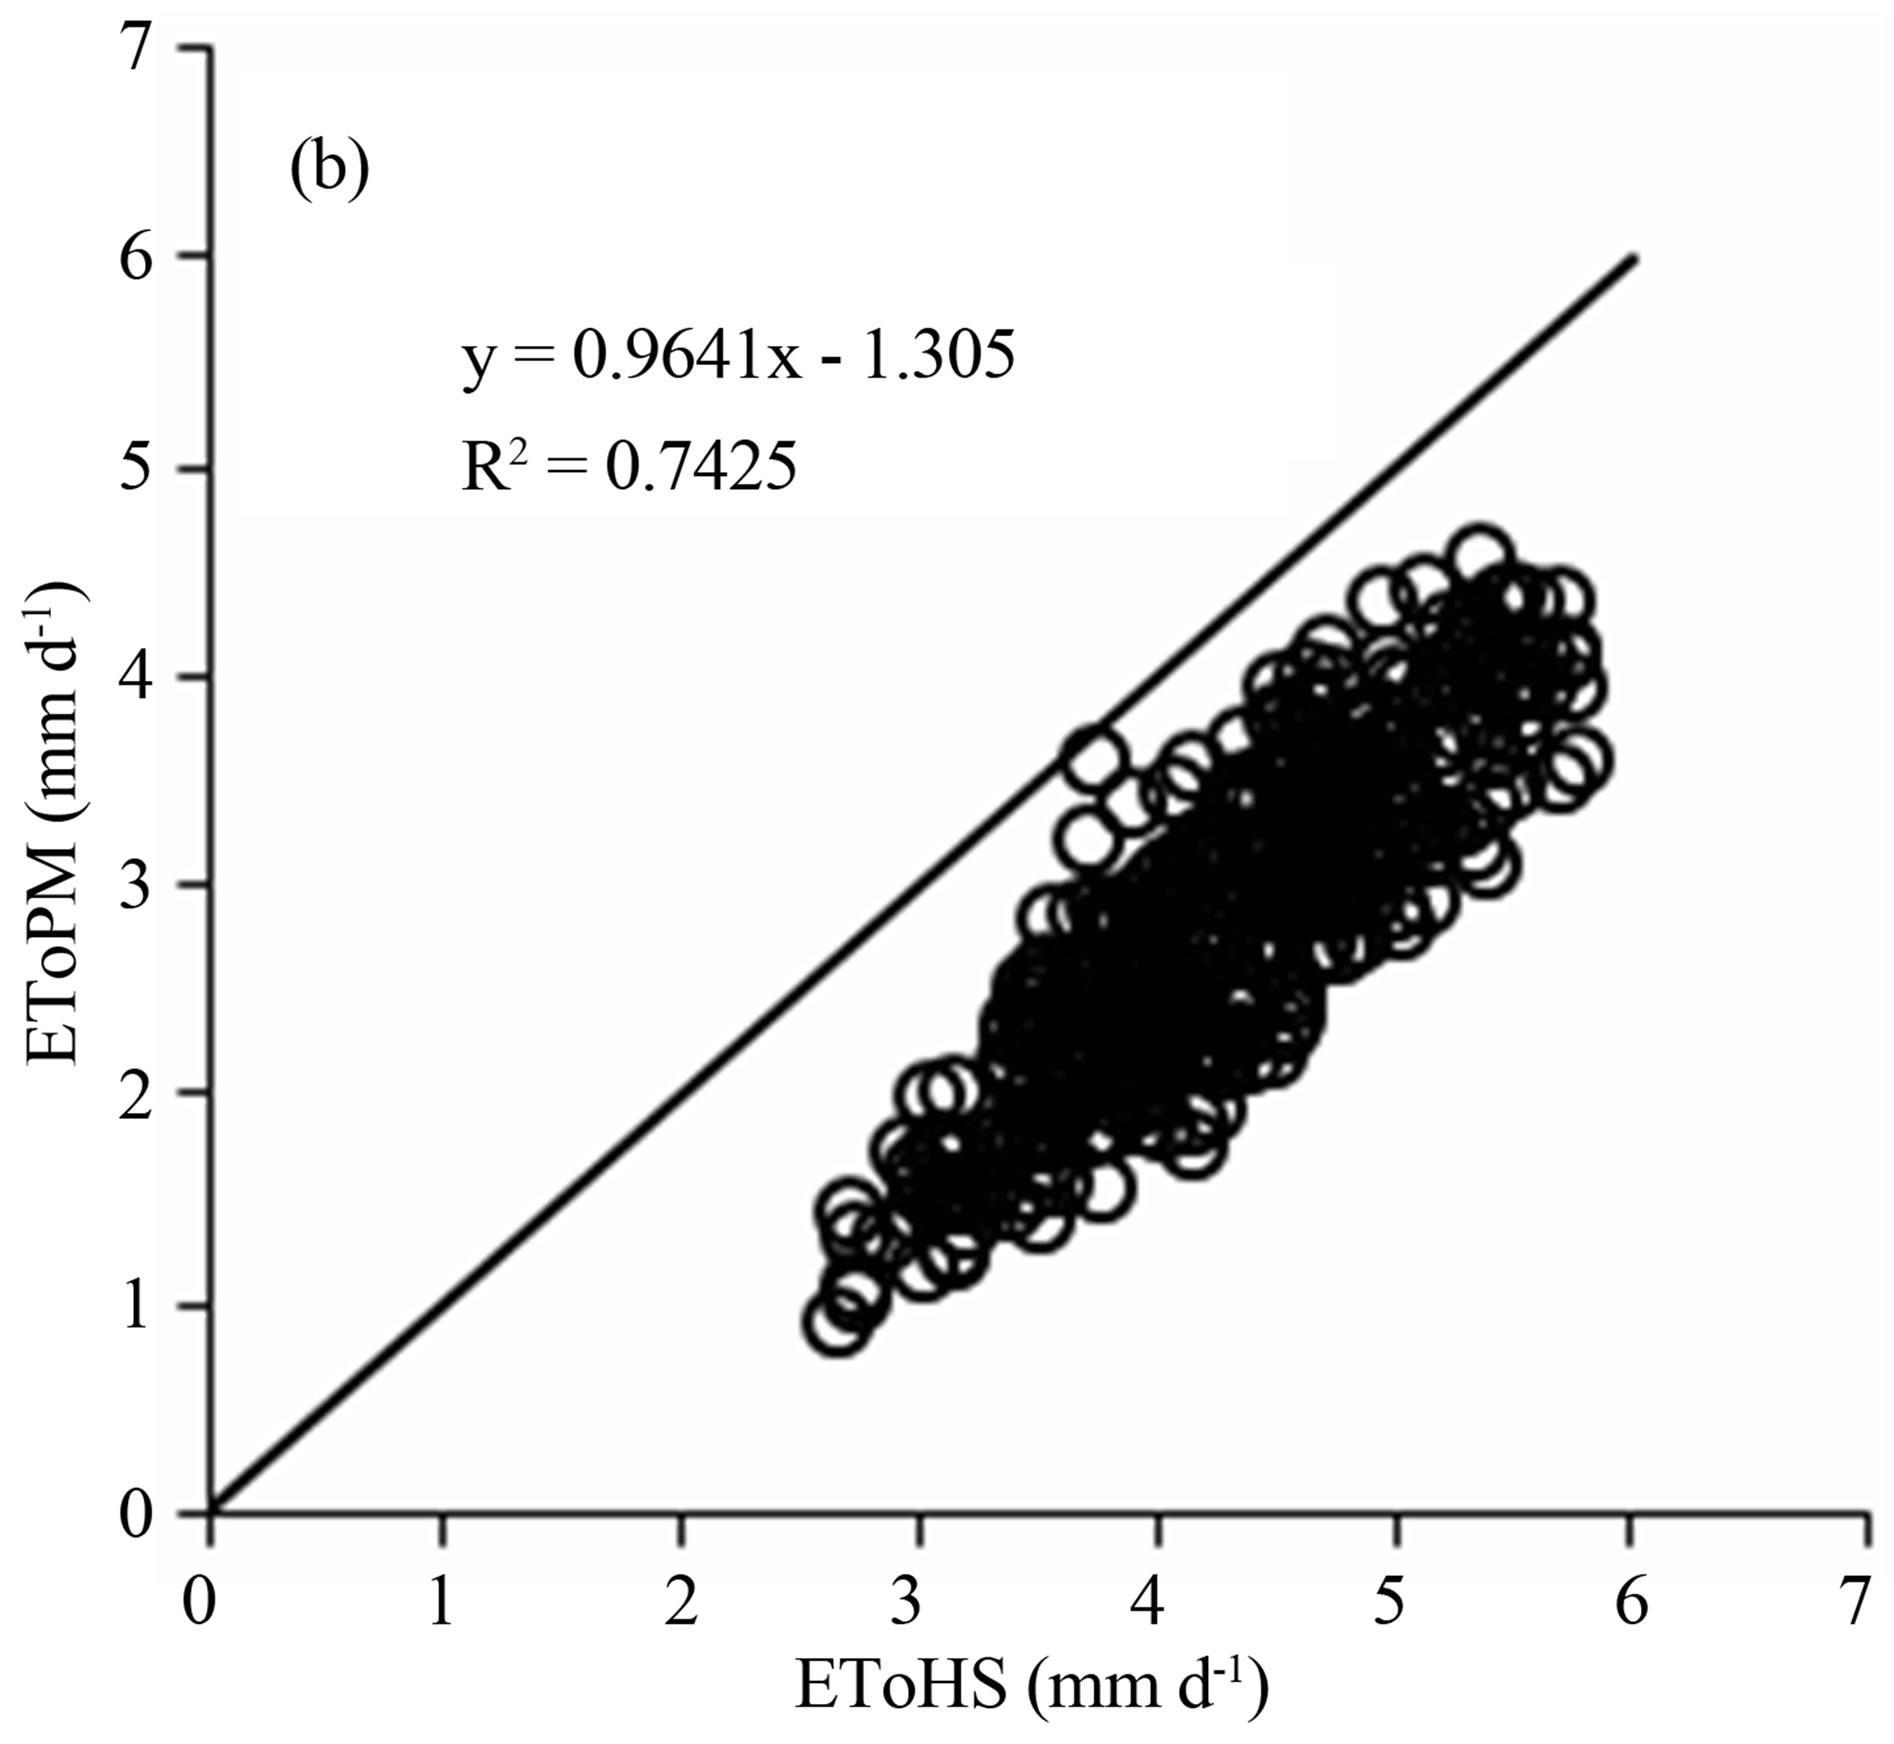
Figure 3. Relationship between daily EToPM and EToHS in São João, Pernambuco, Brazil, during the growing season of 2011 (a) and 2012 (b).
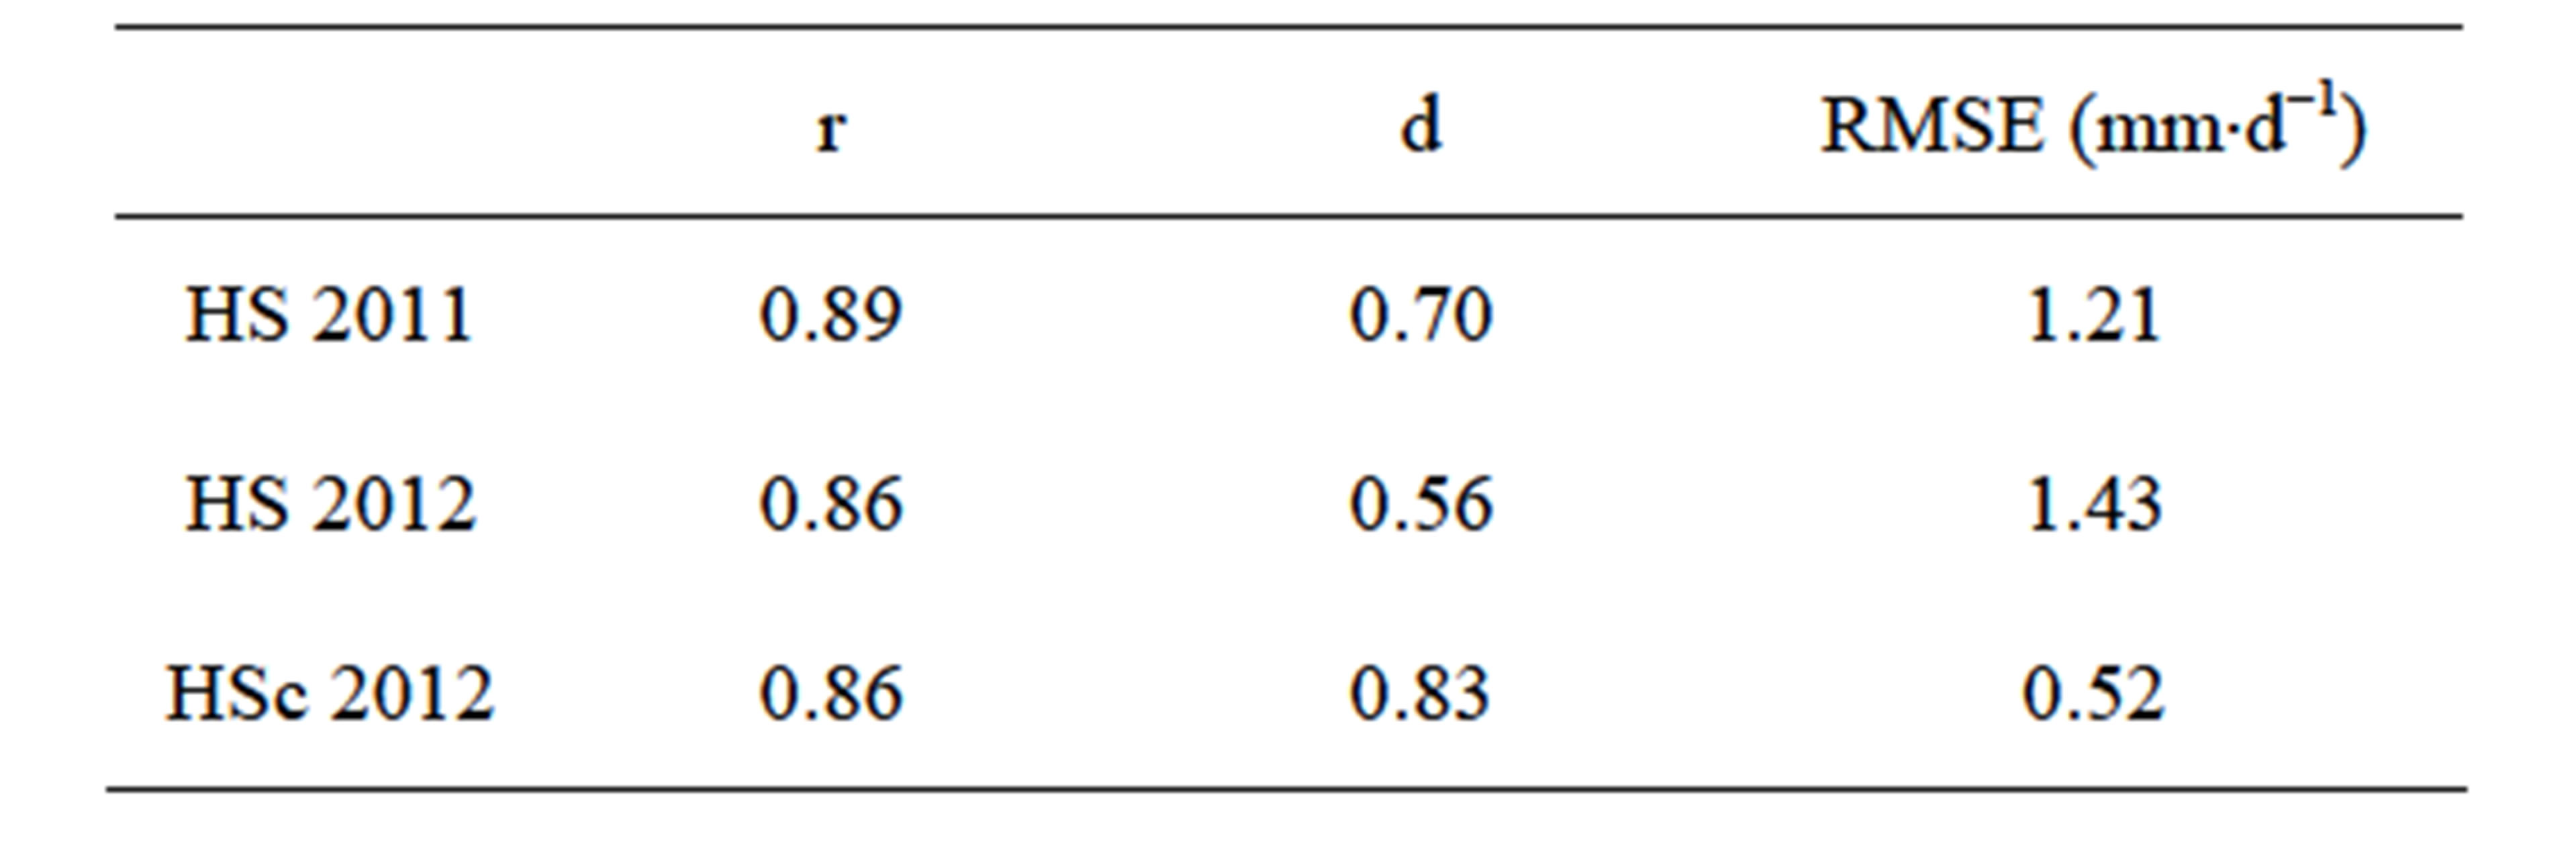
Table 1. Statistical performance of the EToHS and EToHSc versus EToPM for estimating daily ETo during 2011 and 2012 in São João, Brazil.
adjusting the parameters to local conditions. Thus, a calibration of coefficient kRs was performed for every month with data of 2011 (period of calibration), then the data of 2012 were used to validate the method of HS (HSc method). These new calibration coefficient (CHS) and slopes of regression of each month are showed in Table 2.
In the months from May to July (period of lower evaporative demand in this region) the calibrated coefficient ranges from 0.10 to 0.11 and slopes of EToPM to EToHS ranges from 0.60 to 0.65, indicating higher overestimate of ETo by HS method in this period. In other months calibrated coefficient ranged from 0.12 to 0.14 and slopes from 0.73 to 0.80, indicating lower overestimate of ETo.
Overall, the new coefficient was 0.13. These results are different of Moeletsi et al. (2013), that studied the ability of the HS method to estimate ETo in the semi-arid Free State Province of South Africa, and found values of CHS ranged from 0.150 to 0.215.
The relationship between daily values of EToPM and EToHSc in 2012 (calibrated) is showed in Figure 4.
The calibrated Hargreaves and Samani equation (EToHSc) was used to estimate daily ET from February 08 to December 31. The use of the new coefficient (CHS), 0.13 instead 0.17, improved the Hargreaves and Samani estimate at all the months. This is shown by the substantial reduction in RMSE values, from 1.43 to 0.52 mm·d−1, and by substantial increase of index d, from 0.56 to 0.83 (Table 1). Other authors [14,15] also recorded an improvement in the estimation of the Hargreaves and Samani equation after calibration.
The correlation between the two values obtained in Figure 4 shows that the reference ET for this region can
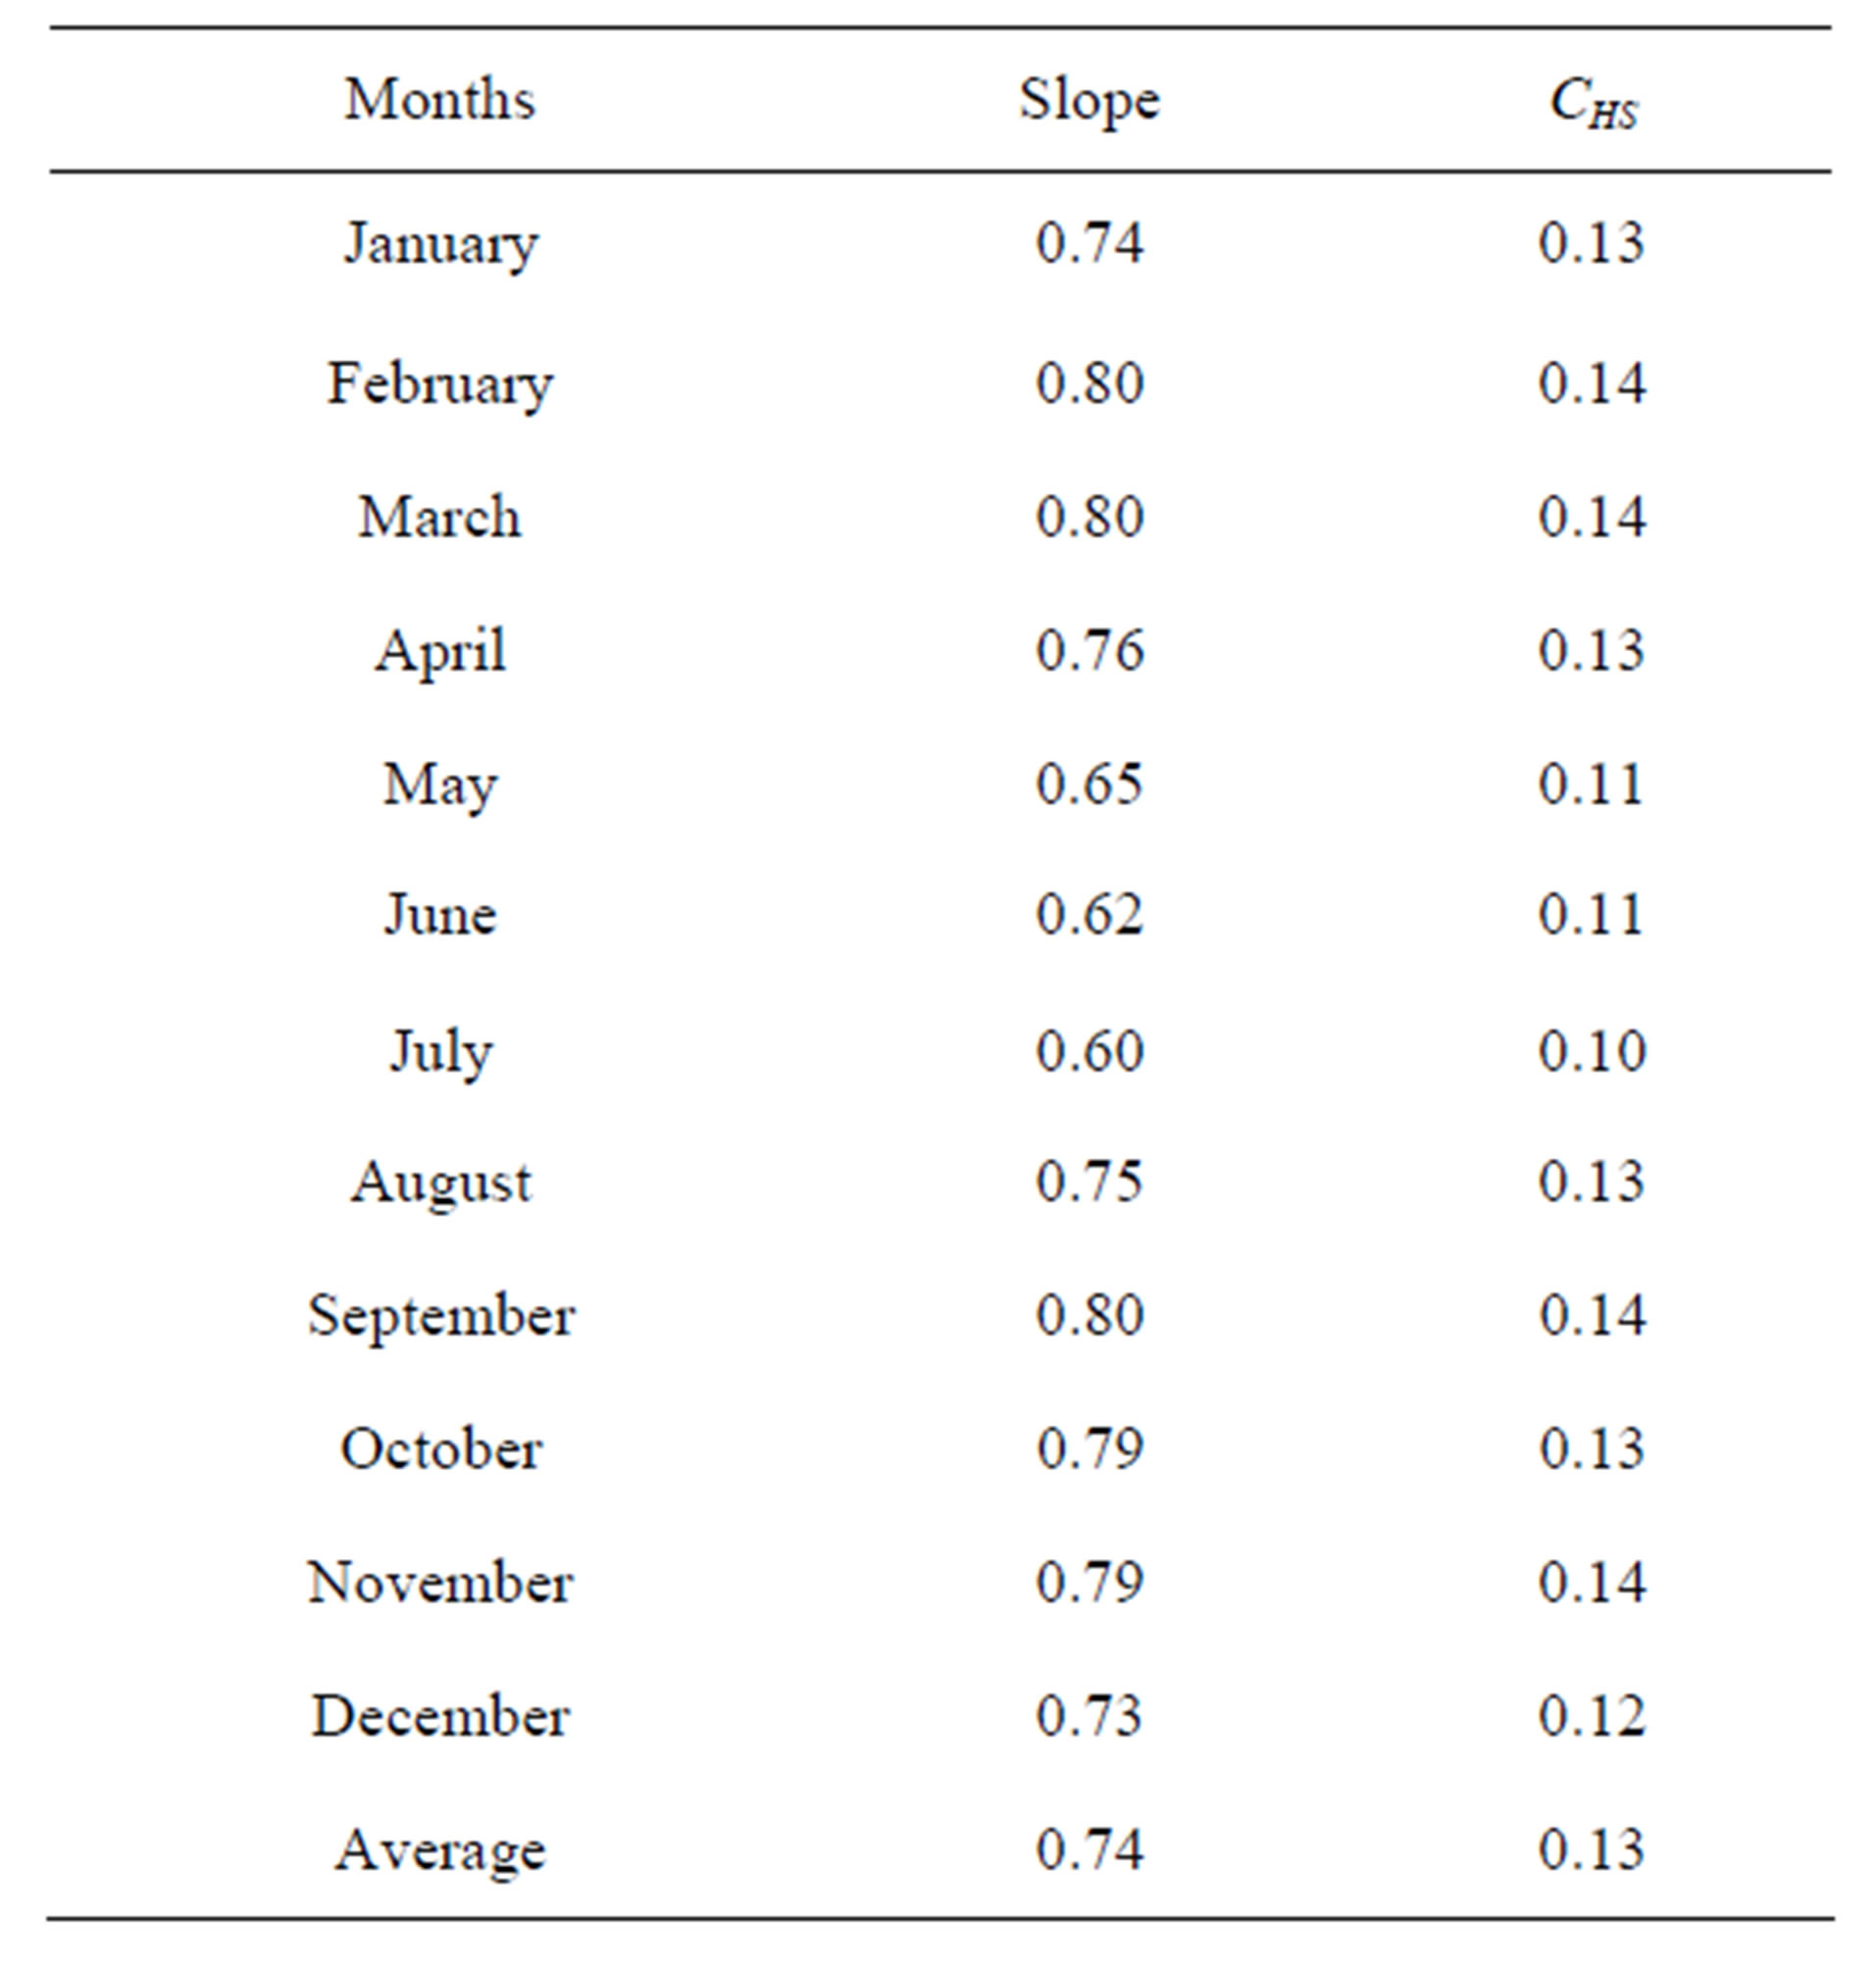
Table 2. The slopes of regression lines between estimated daily EToHS and EToPM and the calibration coefficients of the Hargreaves and Samani equation (CHS) for each month using data from 2011.
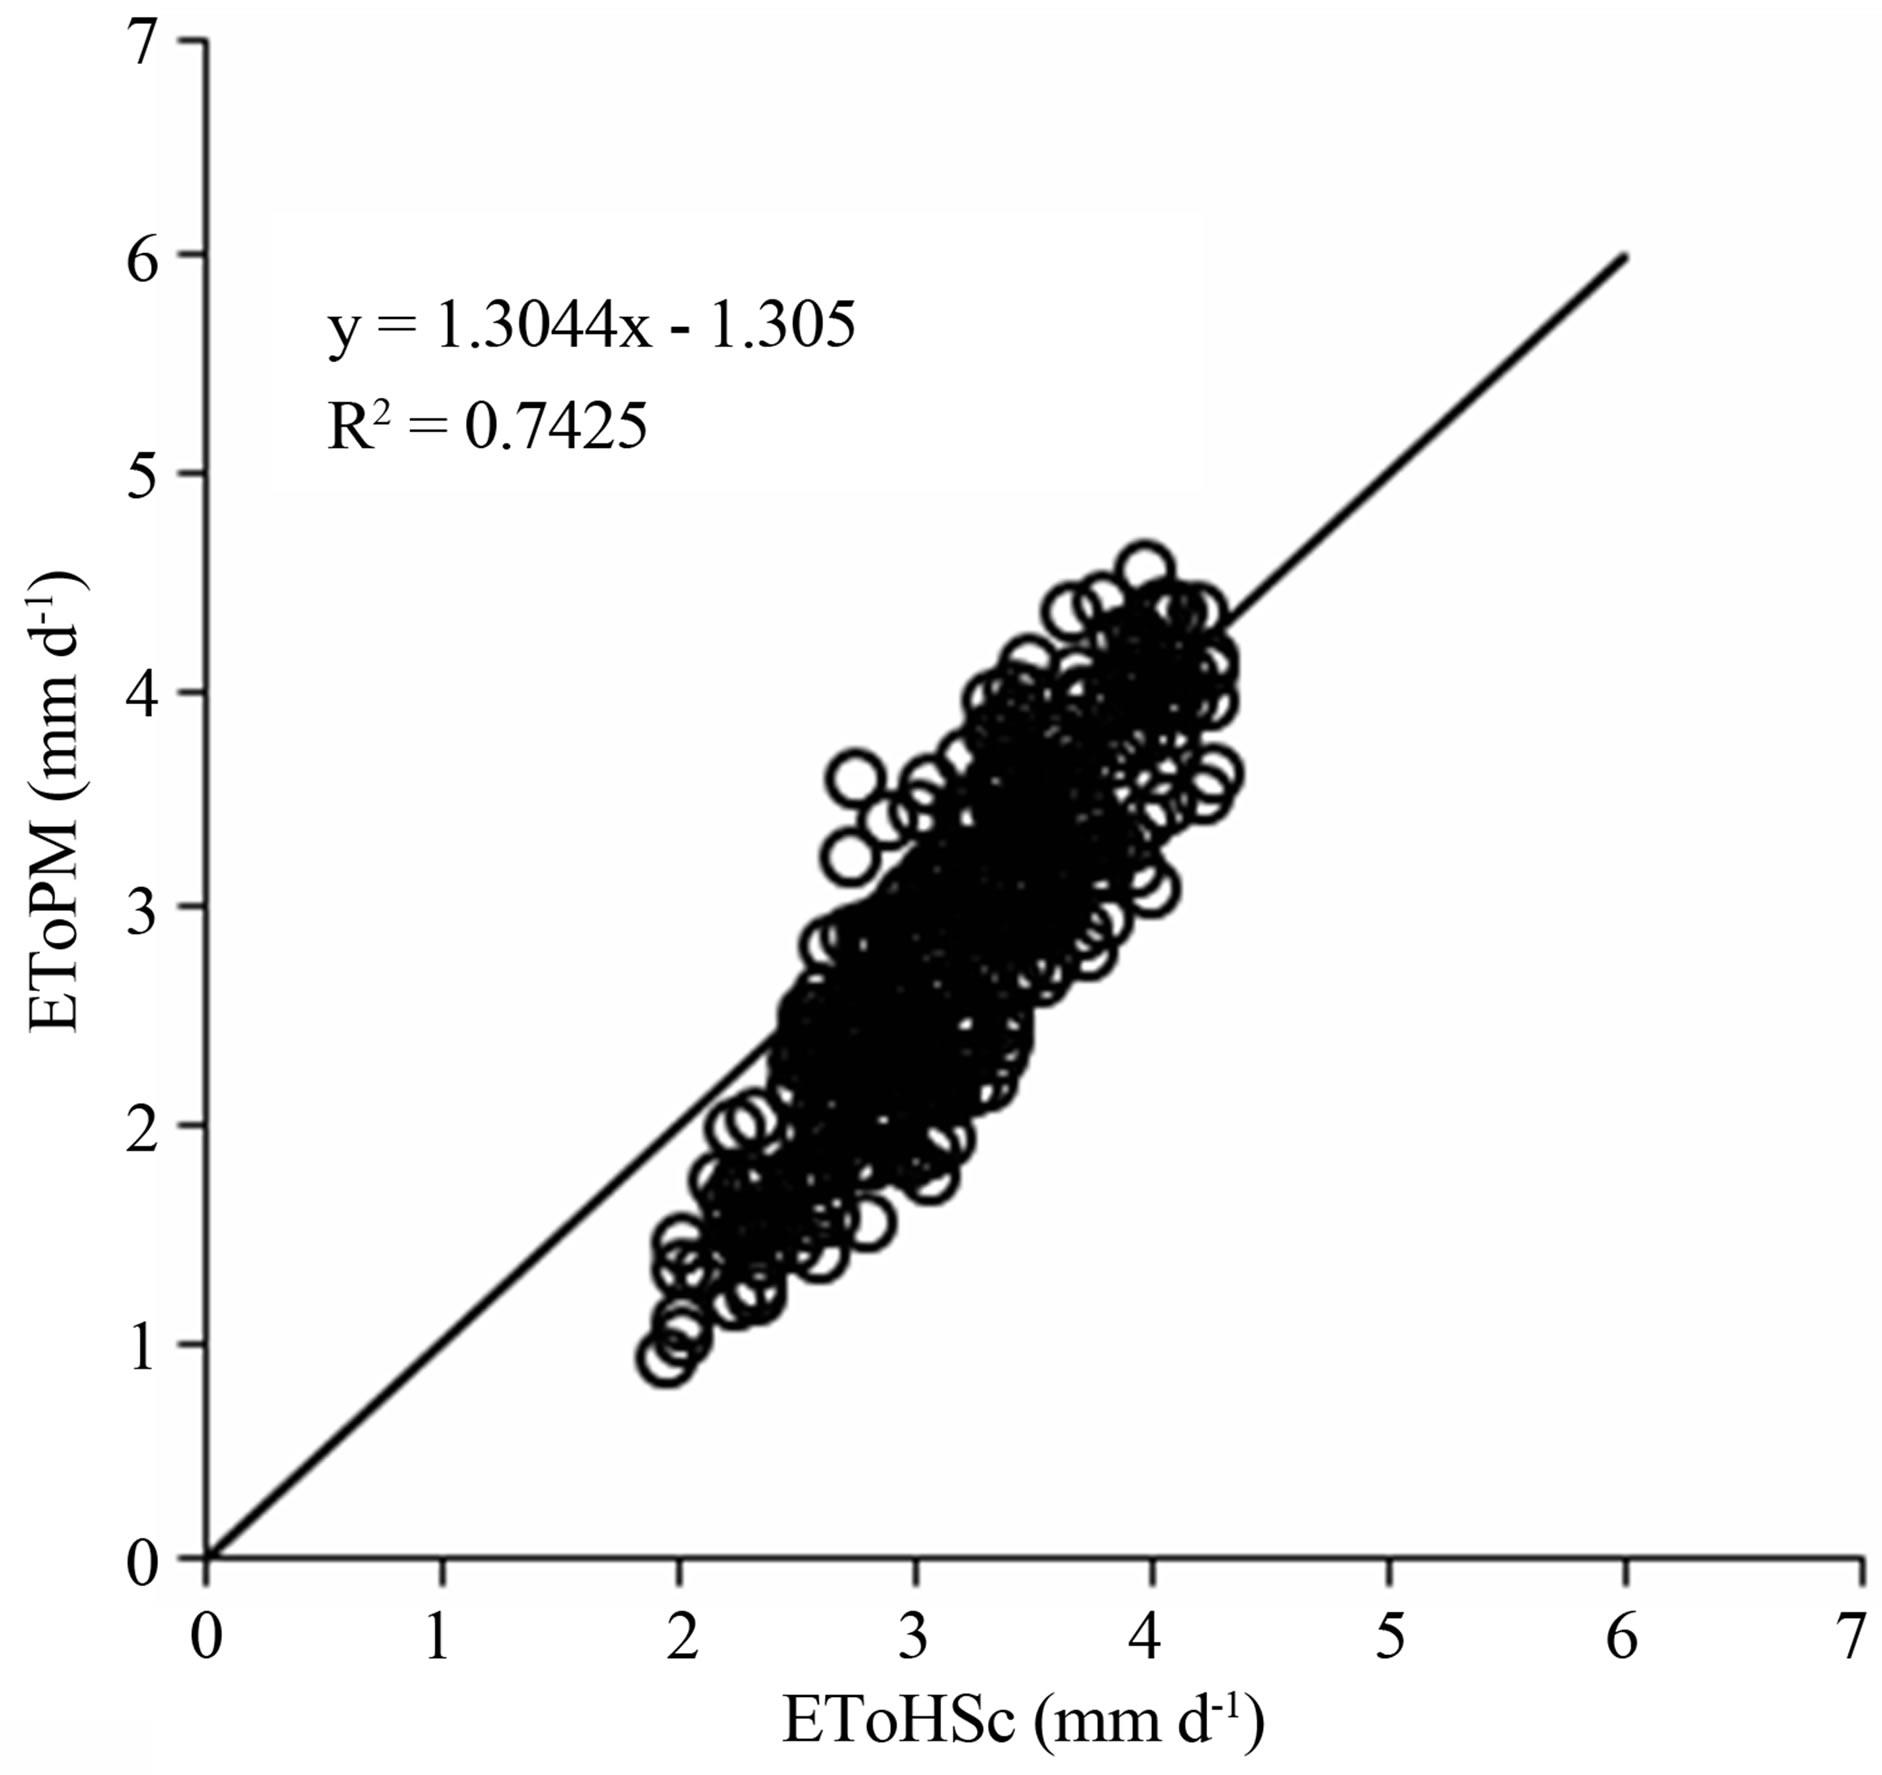
Figure 4. Relationship between daily EToPM and calibrated EToHSc in São João, Pernambuco, Brazil, during the growing season of 2012.
be estimated reliably using the following HargreavesSamani equation:
 (6)
(6)
where EToHSc is ETo calculated from Equation (2), with kRs = 0.13.
We consider the magnitude of the correlation coefficient (r2 = 0.742) and RMSE (0.52 mm×d-1) acceptable for estimating the daily ETo for this region when only air temperature data are available.
4. Conclusion
The Hargreaves-Samani method is suitable for predicting ETo in sub-humid climate of São João, Pernambuco, Brazil when solar radiation, humidity and wind speed data are missing, being that this method has to be calibrated for a better performance.
REFERENCES
- R. Lopez-Urrea, F. Martin de Santa Olalla, C. Fabeiro and A. Moratalla, “Testing Evapotranspiration Equations Using Lysimeter Observations in a Semiarid Climate,” Agricultural Water Management, Vol. 85, No. 1-2, 2006, pp. 15-26. http://dx.doi.org/10.1016/j.agwat.2006.03.014
- P. C. Sentelhas, T. J. Gillespie and E. A. Santos, “Evaluation of FAO Penman-Monteith and Alternative Methods for Estimating Reference Evapotranspiration with Missing Data in Southern Ontario, Canada,” Agricultural Water Management, Vol. 97, No. 5, 2010, pp. 635-644. http://dx.doi.org/10.1016/j.agwat.2009.12.001
- P. Droogers and R. G. Allen, “Estimating Reference Evapotranspiration under Inaccurate Data Conditions,” Irrigation and Drainage Systems, Vol. 16, No. 1, 2002, pp. 33-45. http://dx.doi.org/10.1023/A:1015508322413
- G. Landeras, A. Ortiz-Barredo and J. J. López, “Comparison of Artificial Neural Network Models and Empirical and Semi-Empirical Equations for Daily Reference Evapotranspiration Estimation in the Basque Country (Northern Spain),” Agricultural Water Management, Vol. 95, No. 5, 2008, pp. 553-565. http://dx.doi.org/10.1016/j.agwat.2007.12.011
- G. H. Hargreaves and Z. Samani, “Reference Crop Evapotranspiration from Temperature,” Journal of Applied Engineering in Agriculture, Vol. 1, No. 2, 1985, pp. 96-99. http://dx.doi.org/10.13031/2013.26773
- T. Raziei and L. S. Pereira, “Estimation of ETo with Hargreaves-Samani and FAO-PM Temperature Methods for a Wide Range of Climates in Iran,” Agricultural Water Management, Vol. 121, 2013, pp. 1-18. http://dx.doi.org/10.1016/j.agwat.2012.12.019
- G. H. Hargreaves and R. G. Allen, “History and Evaluation of Hargreaves Evapotranspiration Equation,” Journal of Irrigation and Drainage Engineering, Vol. 129, No. 1, 2003, pp. 53-63. http://dx.doi.org/10.1061/(ASCE)0733-9437(2003)129:1(53)
- APAC, “Water and Climate Agency of Pernambuco,” 2013. http://www.apac.pe.gov.br
- J. C. B. Santos, V. S. Souza Júnior, M. M. Corrêa, M. R. Ribeiro, M. C. Almeida and L. E. P. Borges, “Carachterization of Entisols of Semiarid Region of Pernambuco,” Brazilian Journal of Soil Science, Vol. 36, No. 3, 2012, pp. 683-695.
- Soil Survey Staff, “Keys to Soil Taxonomy,” 8th Edition, United States Department of Agriculture, Natural Resources Conservation Service, Washington DC, 2006.
- R. G. Allen, L. S. Pereira, D. Raes and M. Smith, “Crop Evapotranspiration: Guidelines for Computing Crop Water Requirements,” FAO Irrigation and Drainage Paper 56, Rome, 1998.
- Z. Samani, “Discussion of ‘History and Evaluation of Hargreaves Evapotranspiration Equation’ by George H. Hargreaves and Richard G. Allen,” Journal of Irrigation and Drainage Engineering ASCE, Vol. 130, No. 5, 2004, pp. 447-448. http://dx.doi.org/10.1061/(ASCE)0733-9437(2004)130:5(447.2)
- C. J. Willmott, S. G. Ackleson, J. J. Davis, K. M. Feddema and D. R. Klink. “Statistics for the evaluation and comparison of models,” Journal of Geophysical Research, Vol. 90, No. C5, 1985, pp. 8995-9005. http://dx.doi.org/10.1029/JC090iC05p08995
- M. E. Moeletsi, S. Walker and H. Hamandawana, “Comparison of the Hargreaves and Samani Equation and the Thornthwaite Equation for Estimating Dekadal Evapotranspiration in the Free State Province, South Africa,” Physics and Chemistry of Earth, Vol. 66, 2013, pp. 4-15. http://dx.doi.org/10.1016/j.pce.2013.08.003
- P. Gavilán, I. J. Lorite, S. Tornero and J. Berengena, “Regional Calibration of Hargreaves Equation for Estimating Reference ET in a Semiarid Environment,” Agricultural Water Management, Vol. 81, No. 3, 2006, pp. 257-281. http://dx.doi.org/10.1016/j.agwat.2005.05.001