Journal of Water Resource and Protection
Vol.5 No.8A(2013), Article ID:35666,12 pages DOI:10.4236/jwarp.2013.58A001
Groundwater Origin and Its Hydrogeochemistry through GIS Maps in Linares Region, Mexico
Instituto de Ingeniería Civil (IIC), Facultad de Ingeniería Civil (FIC), Universidad Autónoma de Nuevo León (UANL), Monterrey, México
Email: *rene.alberto.davila@gmail.com
Copyright © 2013 René Alberto Dávila Pórcel, Héctor de León-Gómez. This is an open access article distributed under the Creative Commons Attribution License, which permits unrestricted use, distribution, and reproduction in any medium, provided the original work is properly cited.
Received April 27, 2013; revised June 5, 2013; accepted July 14, 2013
Keywords: Groundwater; hydrogeochemistry; GIS; Mexico
ABSTRACT
The North-East region of Mexican Republic has a semi-arid weather condition; this area covers partially Tamaulipas, Nuevo León and Coahuila states. Pablillo River Basin (PRB) is located close to Nuevo León south border and its catchment area involves Linares City (LC), Hualahuises City (HC) and Cerro-Prieto dam (CP). This reservoir captures drinking water to Monterrey Metropolitan Zone (MMZ) the major urban center on the north-east Mexican region. More than 50% of the potable water for LC comes from groundwater stockpiles. A combination of GIS maps and major ion chemistry analysis has been assessed, to know the origin, geochemical evolution, and hydraulic interconnection of groundwater. During 2008-2009, 46 groundwater samples were taken and analyze around LC and HC. GIS technology was use to analyze the spatial distribution of the constituents of groundwater through thematic maps. The major ion analysis and its results suggest the presences of two aquifers; shallow porous aquifer on the top and fractured aquifer on the bottom. General water mineralization was discovered, including dissolution of halite, dolomites and carbonates through the aquifers. Water quality varies widely through the aquifers, the general pathways goes from southwest to northeast direction. The overexploitation of groundwater increases the water mixing of groundwater between shallow and deeper aquifers. Natural origin of groundwater and groundwater pollution by anthropogenic activities should be considerate in the groundwater quality analysis for drinking water purpose.
1. Introduction
In the northeast of Mexico, surface and ground water resources play an important role for the agricultural and urban development. In the southern portion of Nuevo León State are located LC and HC. Groundwater is the most essential water source used to supply the growing demand for irrigational, domestic and industrial purposes in importance order [1], also an intensive use of irrigation makes groundwater a crucial resource nowadays for human activities [2] and careful management is imperative for ecological and environmental reasons [3]. In relation to the water quality, the chemical composition of groundwater is controlled by various factors that consist of precipitation, geological structure and/or rock mineralogy of aquifers and geological processes inside the aquifer [4]. For these reasons, increase the knowledge of aquifer systems and groundwater quality in arid and semiarid regions could conduct to improve understanding of hydrochemical systems in such areas, leading a sustainable development of water resources and effective management of groundwater resource [2].
In the region of LC and HC the situation of the natural processes that govern the hydrochemical composition of the groundwater is not clearly and the factors that have effect on its quality are undetermined. The aim of this paper is to understand the hydrochemical evolution of groundwater in the aquifers using analysis of the major ions of groundwater and thematic maps developed in a GIS environment. The use of both methodologies of assessment in Latin-American and in development countries is uncommon, although its necessity being an important instrument for the decision makers in public and private sectors [5]. In the present study, a specify investigation was carried out with the objective to discover hydrochemical processes and their relation to groundwater quality and aquifer characteristics in the analysis of the geographic distribution of the water constituents.
2. Study Area
The PRB is inside of Nuevo León State, the northeast portion of the basin is the study area analyze in this paper. This area belongs to the Gulf of Mexico Coastal Plain (GMCP), inside the study area (north-eastern PRB) are sited LC and HC. The main access is the National Highway 85 since MMZ ~130 km into the south direction. Approximately 12 km from LC is positioned the drinking water reservoir CP an important source of potable water for Metropolitan-Zone of Monterrey, the most important city in the northeastern territory of Mexico (population ~3.8 Million inhabitants) [6]. CP water reservoir captures the water of the catchment area of Pablillo River, which crosses LC and Hualahuises River crosses HC which joins to Pablillo River in the income of LC. During the last decade, LC suffers an important urban population growth, as well as the agricultural and industrial development. Groundwater resources in this region supplies more than the 50% of the total water for consumption of LC and HC population more than 63,000 inhabitants [6]. However, all the waste water and industrial effluents goes downstream in direction to the CP, hence, the possible pollution of surface and ground water is high. The aquifers of this area have a shallow water-table around LC and HC, this aspect increase the risk to pollution of groundwater stockpiles. Upstream of LC is located the citrus region and HC which has municipal activities, all these areas could be important sources of pollution and can affect the aquifers, due to the presence of private farms, citric plantations, sewage water, wastewater and a variety of little farms. In the downstream portion between LC and CP dam (northeast direction) is the wastewater treatment plant of Linares, also, continues the citric plantations, farms and small human centers (Rio Verde, La Escondida y Guadalupe). The main aims to this study are: 1) identify key processes that govern the hydrochemical condition of groundwater in the aquifers in the north-east part of Pablillo River Basin 2) discover if there is any presence of pollutants inside the study area.
3. Geology and Hydrogeological Settings
In the middle of two important geologic provinces: the Sierra Madre Oriental (SMO) and the GMCP is located the PRB, the SMO contains the Southwestern portion of the basin and the GMCP includes the northeastern part of the basin. For this paper, the research area is center on the portion enclosed by GMCP highlighted in Figure 1. After field skills like: identification of Geological Formations and structural geology data collection and literature review of previous works, three important formations were studied and are the most recent to oldest: 1) Fluvial Ter-
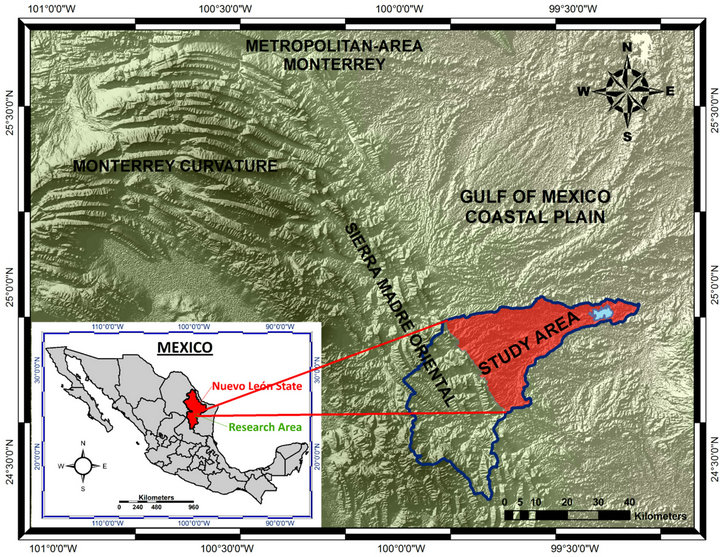
Figure 1. Localization of the study area.
races and Lacustrine Sediments namely Alluvium-Conglomerate Formation (ACF) with a given age period from Tertiary to Quaternary, this formation has a calculate thickness of ~25 m since surface, the origin of its sediments are the mountain canyons of the SMO; 2) Méndez Formation (MF) with a given age period from Campanian to Maastrichtian, this geological formation is the most powerful and prevalent in the area, it has a maximum thickness around 1500 m, consisting in dark gray shale interbedded by olive-green and calcareous shale; finally, the oldest one 3) San Felipe Formation (SFF) with a given age period from Turonian to Conacian, it has a maximum thickness ~150 m, it is formed by heterogeneous sequence of shale, calcareous shale, silicified limestone, marl and sandstone. San Felipe is present in a small area located between the north side of CP and the north border of the catchment area of Pablillo River [7,8]. According by Strahler (1957) PRB is a fourth order catchment classification, [9]. The study area covers an area about 819.28 km2 (North-East portion of PRB in the GMCP) and the total catchment area of PRB is ~1734.55 km2.
Some researchers had been studied the hydrogeology in this region, in general the main flow direction goes from the high hidraulic heads to the low hidraulic head (from SMO to CP), the main hydrostratigraphic units are MF and ACF [8,10-18]. None of the available literature demonstrates the hydrochemical origin of the groundwater or the aquifers interconnectivity of the basin.
Factors like geology, geographical position and water-table measurements of groundwater levels were realized in 23 hand-dug wells and pipe Wells, in two field visits of sampling on April 2008 and March 2009. A shallow unconfined aquifer was identified which has mainly two hydrologically connected layers: on the top a highly permeable and porous aquifer consisting mostly of gravels and various grades of sand, silt and clay, represented by ACF and in the Bottom a fractured and weathered aquifer mainly represented by the presences of MF and in a small area by SSF. Figure 2 shows the spatial distribution of the Geologic Formations presents in the study area.
The shallow porous aquifer has a depth that varies from a few meters to ~25 m and the water-table levels in the alluvium do not significantly change throughout the aquifer, therefore the rainfall season does not affect in great manner. The principal variation of groundwater levels is due to topographic morphology of bedrock and abstractions over the area. As a general situation, the water-table average is ~10 m depth measured from the surface. Just as in other shallow aquifers, groundwater is stored in the fractured and weathered bedrock in the lower aquifer, the upper alluvial sediments permits the aquifer recharge throughout its body [19]. The main direction of groundwater flow is from southwest to northeast; additionally the structural geological data confirms this general pathway. In general, in arid and semi-arid regions, the recharge to shallow alluvial aquifers is a result of infiltration from the surface [17]. Therefore, the principal process of recharge in the study area is the surface recharge along GMCP over the aquifers. The amount of recharge is function of rainfall frequency which is characterized by clear spatial and temporal variations over the year. The shallow water-table and coarse alluvial deposit increases the chances of direct recharge into the alluvial aquifer from surface. A value of 1035 mm is the annual average of rainfall (has been recorded month to month for 25 years) over the study area, from this amount of precipitation a range between 18 and 35% converts to direct recharge, finally, the discharge of the aquifer takes place in CP dam and through pumping in LC, HC and its neighboring areas.
4. Sampling Procedure and Hydrogeochemistry Methodology
The data used in this research comes from 46 samples of 23 groundwater-sampling points of hand-dug wells and
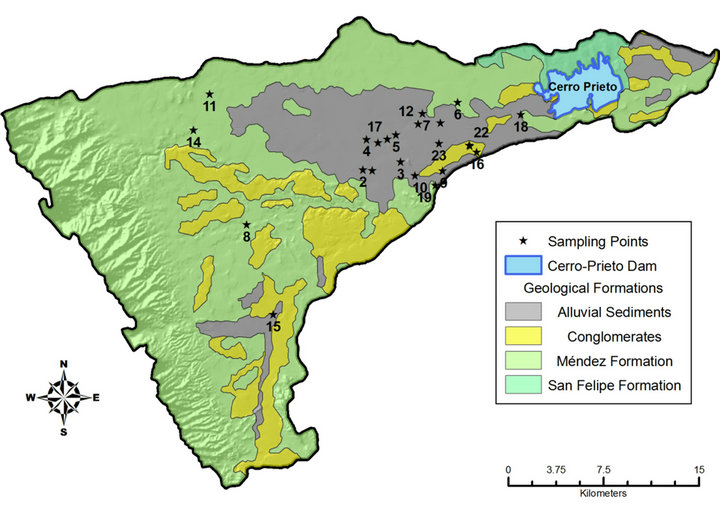
Figure 2. Local geology and sampling points’ location.
pipe wells during April 2008 and March 2009 on two field visits (Figure 2). Multi-parameter measuring equipment “WTW-340” was used to realize in situ measurements of pH, temperature, and electrical conductivity (EC). Glass fiber paper through 0.45 µm was used to filter the water samples. The samples were acidified to pH = 2 with ultrapure nitric acid and they were cold stored in precleaned bottles (1-1 polyethylene) during the transport to the laboratory.
Alkalinity was measured using titration method in the chemical laboratory of Facultad de Ciencias de la Tierra on the same day of sampling. The measurement of cations concentrations was performed using of Dionex ICS-90 IC (Ion Chromatography), this equipment was used to measures: sodium (Na+), potassium (K+), calcium (Ca2+), magnesium (Mg2+). On the other hand, major anions likes: bicarbonate ( ), chloride (Cl−), nitrate (
 ) and sulfate (
 ) were measured using Dionex ICS-120 IC in the Chemistry Laboratory of the Institut für Angewandte Geowissenschaften of the Technische Universität Darmstadt (Germany), all this values constitutes the hydrochemical database to use in the Major Ion Hydrochemistry and GIS-database to generate the thematic maps. Tables 1and 2 shows the results of the laboratory analyses carried out in 2008 and 2009 respectively and Figure 2 shows the geographic location of sampling points in the study area.
The selection of wells was made in attention to: 1) access to the well or hand-dug-well; 2) geographical location; 3) presence of human activity; and 4) current well exploitation. Four points of sampling were select upstream to know the background chemical quality of groundwater before the human impact by agricultural and industrial activities, these points are located closely to the major recharge area over the study area.
A Geographic Information System (GIS) was created on the base of hydrochemical, geological and hydrogeological data. The use of these data is directed to understand the spatial distribution of the water chemistry and its constituents. On the other hand, a statistical analysis was made to understand, the relationship between hydrochemical water quality and aquifer characteristics to know the chemical evolution of groundwater. All the results of this analysis are show on thematic maps, scatter plots and tables.
5. Results and Discussion
The summary statistics for each water quality parameter are show in Table 3. The pH value in groundwater ranges from 6.65 to 7.83 with an average value of 7.11, demonstrating the alkaline nature. The concentration of Na+ ranges from 8.6 to 275.02 mg/l; concentration of K+ ranges from 0.61 to 12.59 mg/l; concentration of Ca2+ ranges between 74.06 and 51.22 mg/l; concentration of
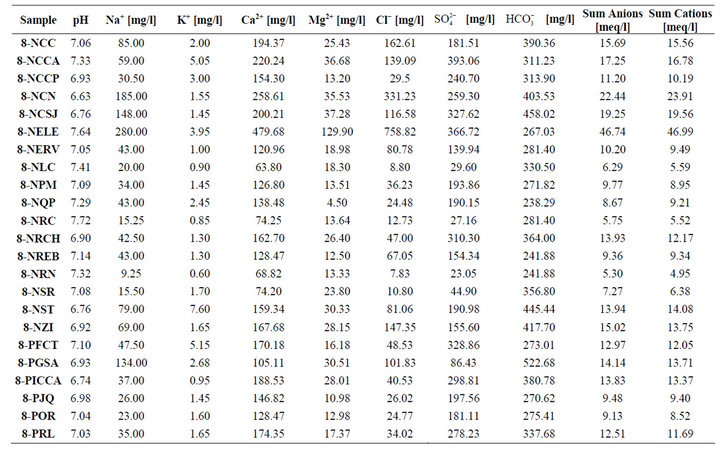
Table 1. Hydrochemical data for groundwater (April 2008).
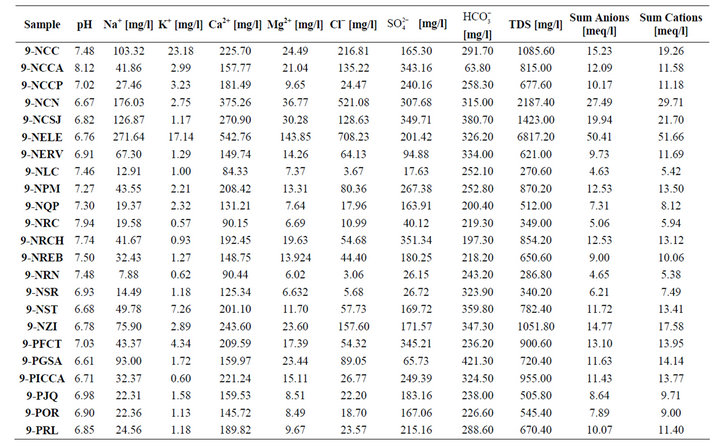
Table 2. Hydrochemical data for groundwater (March 2009).
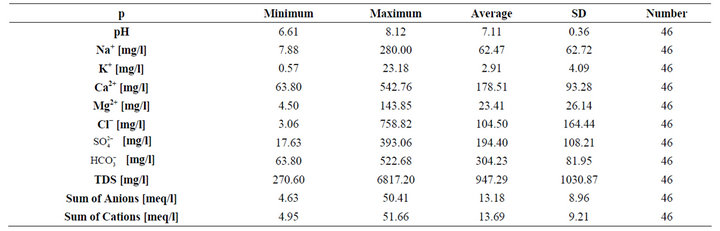
Table 3. Statistical summary of concentrations of chemical constituents.
Mg2+ ranges from 6.07 to 136.87 mg/l with average of 62.47, 2.91, 178.51, 23.41 mg/l respectively. The relative concentrations of cations occurs in the order of Ca2+ > Na+ + K+ > Mg2+. The sum of cations is 13.70 meq/l, otherwise the concentration of anions are: Cl− ranges between 5.44 and 733.52 mg/l,  ranges from 23.61 to 368.11 mg/l and
  ranges from 187.52 to 471.99 mg/l, with averages of 104.50, 194.4 and 304.23 mg/l respectively. The relative concentrations of anions are produced in the following order of HCO2− >
  > Cl−. The sum of anions is 13.18 meq/l this situation represents a cation predominance in the general chemical balance of the groundwater. Finally, the TDS variation goes from 290.40 to 5122.60 mg/l denoting less concentration near to the recharge area (close to SMO in the southwest sector) and higher concentration near to de CP in the northeast portion of the study area after the presence of human activity in the citric regions, industrial activities and cities (LC and HC). This situation explains the hydrochemical mineralization through the pathway of regional groundwater flow. Inverse Distance Weight (IDW) procedure was used to interpolate the chemical database created in GIS environment. A second polynomial order equation allowed obtaining interpolations of major cations and anions, the average values of each constituent were used to create the GIS-database.
Figure 3 represents the spatial variation of the piezometric water-table levels expressed in meter above sea levels, the values showed are the averages between two measure rounds, the maximum value ~450 masl is located in the west side of the study area and the lower value is around 295 masl around CP in the east part.
Figure 4 shows the distribution of Total Dissolved Solids (TDS) the lower values are located close to de SMO where human activity is no present, these values are increased from west to east progressively and the major value is present close LC in the “Ejido La Escondida” reaching more than 6000 mg/l.
Sodium distribution is presented in Figure 5, the higher values are located in the central part and close to LC reaching ~2.75 mg/l and the lower values are placed in downstream direction near to CP water reservoir.
Potassium distribution is presented in Figure 6 where the higher value (~23 mg/l) is located in the central portion of the study area.
In Figure 7 the Calcium distribution is showed, the highest value (~511 mg/l) is near La Escondida (human settlement).
The general increment of Calcium is from west to east direction. Figure 8 represents the spatial distribution of Magnesium, where the major concentration is located in La Escondida area reaching a value of ~143 mg/l.
The spatial distribution of anions like Chloride, Sulphate and Bicarbonate are showed in Figures 9-11 respectively, the highest values of Chloride, Sulphate and bicarbonate ~758, ~349 and ~522 mg/l respectively, as a general situation the values are increasing from west to east direction inside the study area.
The water types are categorized according to their content of major cations and anions by using the Piper diagram showed in the (Figure 12).
A correlation analysis of the major ions vs. TDS showed in Figure 13 where, a) Mg2+, b) Ca2+, c) Cl− and d) Na+ have a coefficient of determination r2 = 0.85, 0.80, 0.77 and 0.68, respectively. A possible reaction is input of Na+ and Cl− by dissolution of halite (NaCl), the possible sources of Ca2+ and Mg2+ could be the dissolution of dolomite, Calcite and Magnesite.
The relationship between Na+ and Cl− plotted in Figure 14(a), shows that the representative water samples of the aquifer are distributed close to the halite dissolution showing a weight ratio around 1, suggesting a similar origin of the water. The ratio Na+/Cl− (Figure 14(b)) is in general less than one expressing a possible recent recharge due to direct infiltration or river interconnection. The ratio of  /Cl− plotted versus Chloride (Figure 14(c)), shows high ratios in the study area that means a high solubility of these ions suggesting a gypsum dissolution [20].
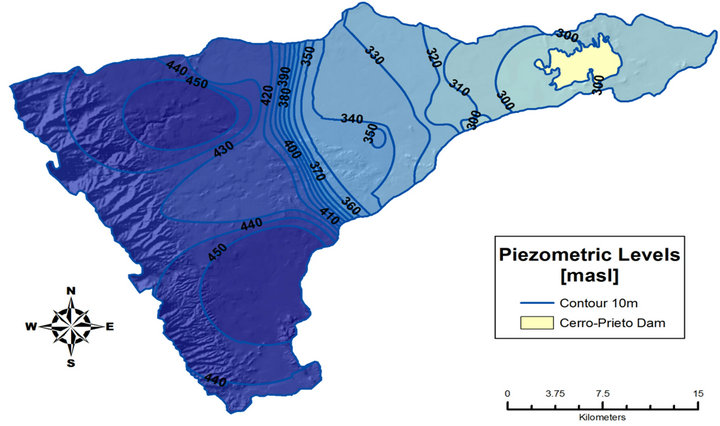
Figure 3. Piezometric maps of the study area.
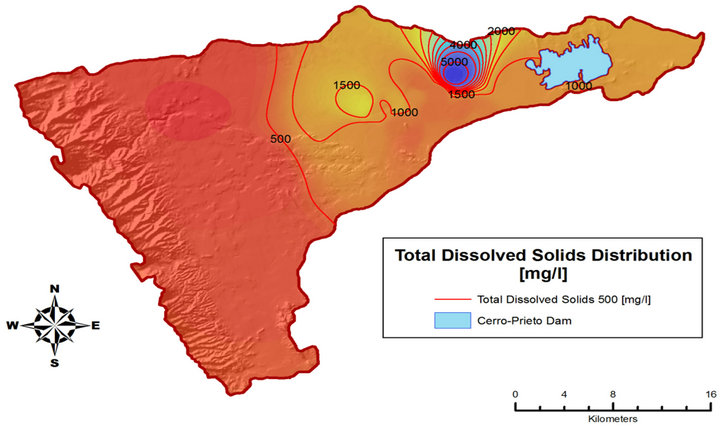
Figure 4. Total dissolved solids maps (TDS).
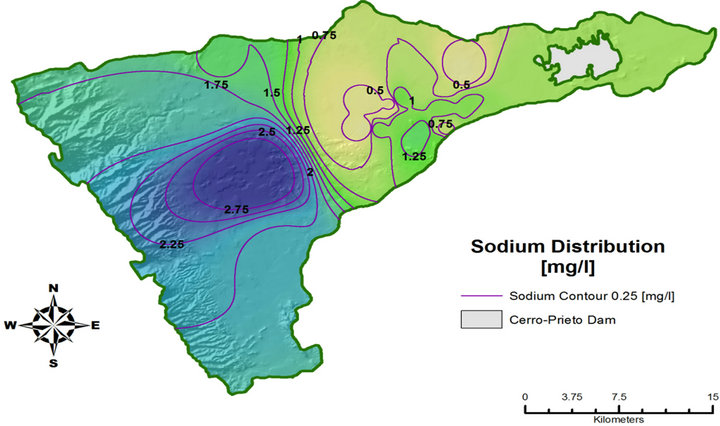
Figure 5. Sodium distribution.

Figure 6. Potassium distribution.
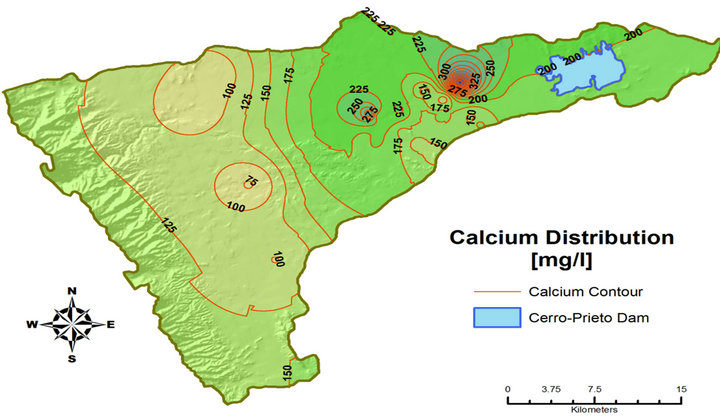
Figure 7. Calcium distribution.
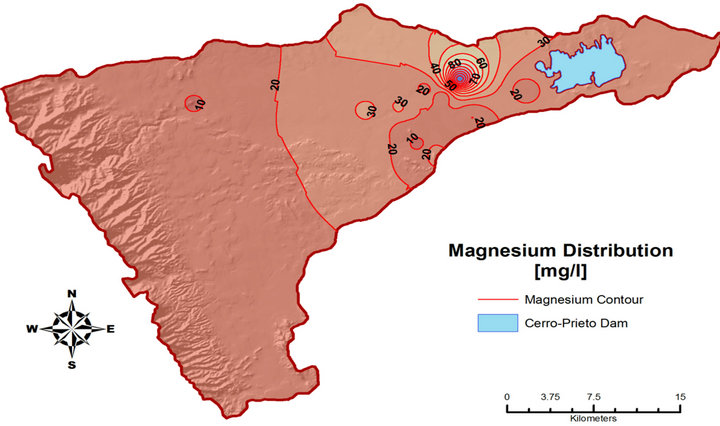
Figure 8. Magnesium distribution.

Figure 9. Chloride distribution.
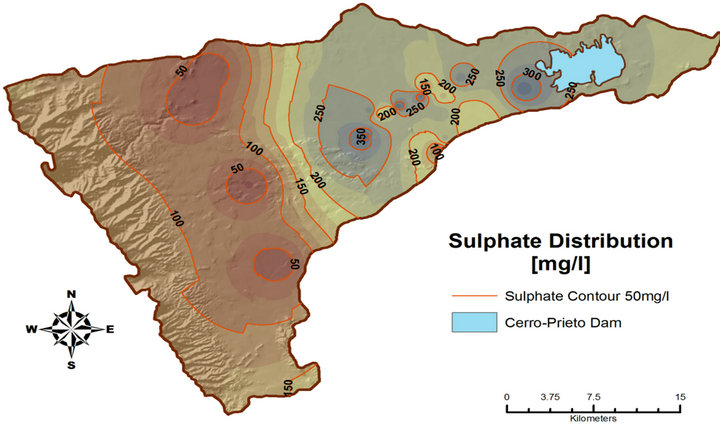
Figure 10. Sulfate distribution.
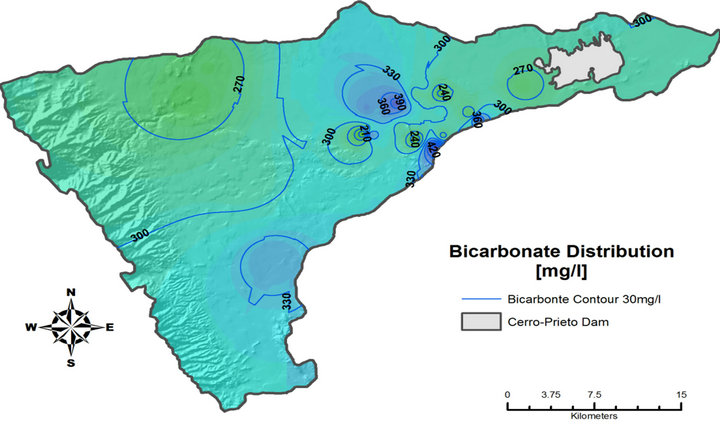
Figure 11. Bicarbonate distribution.
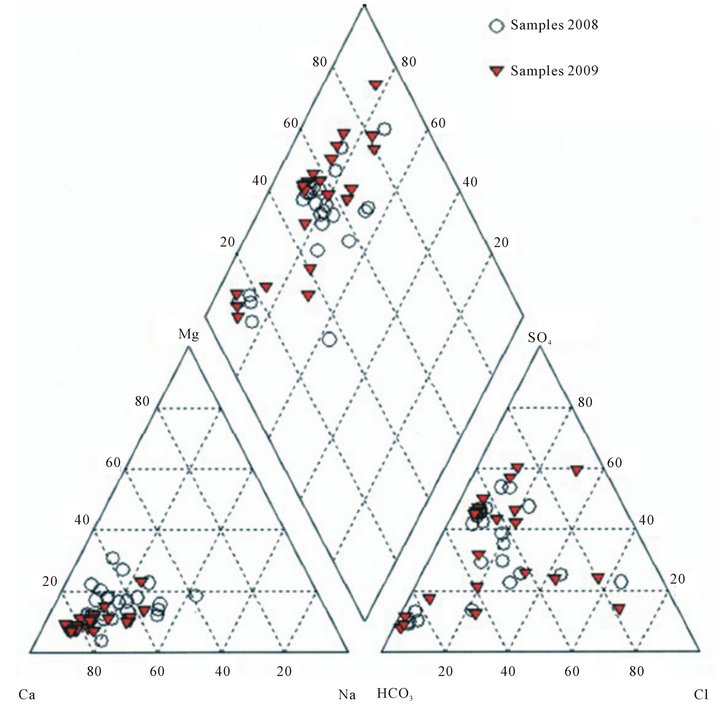
Figure 12. Piper diagram.
6. Conclusions
Hydrochemistry data of water have been utilized to understand the origin, geochemical evolution and hydraulic interconnection of groundwater in Pablillo River Basin. The main conclusions are as follows: the potentiometric map indicates the role of spatial recharge in the whole basin and in the region near to Sierra Madre Oriental that produce the alimentation of shallow water-table of the aquifers. Additionally, the hydrogeochemical data indicate that the fresh groundwater zones of the basin are mainly distributed close to the front pluvial fans of Sierra Madre Oriental.
The waters with more dissolved ions are predominant in the lower alluvial plains around Linares City, Hualahuises City and Cerro-Prieto dam. The concentration of TDS in groundwater increases along the groundwater flow from southwest to northeast and a very variable chemical composition of groundwater were discovered, e.g. EC varies in wide range between ~470 and 8240
µS/cm. The hydrochemical types in the area can be classified in three major types. 1) one type is Ca2+ - Na+  predominance and located on the west side of the study area; 2) the second type is Ca2+ - Na+ -
  predominance placed in the central portion close to the cities and 3) the third group has a Ca2+ - Mg2+ - Na+ present around La Escondida settlement in the northeast part.
The first and the second groundwater types maybe are affected by natural salinization due to: the dissolution of halite and gypsum and the third type is possible affected by the dissolution of dolomite and carbonates. More than a few mechanisms contribute to the later evolution of groundwater chemistry. In the upper topographic levels, a possible CO2 gas dissolution and cation exchange predominates the water chemistry. These reactions can increase concentrations of Na+ and . Moreover, in the lower alluvial plains, the geochemical evolution of groundwater is associated to mineral dissolution.
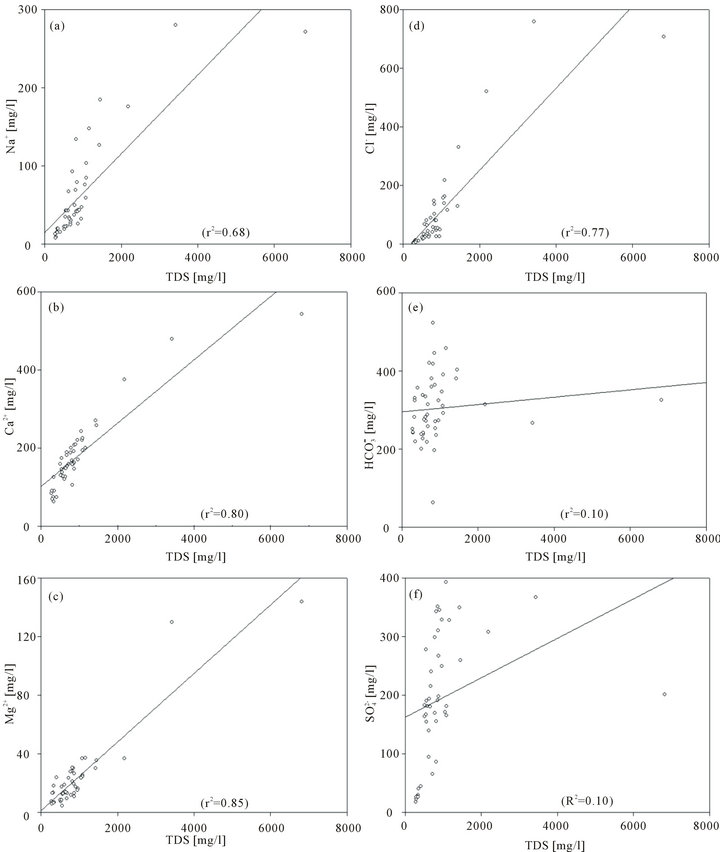
Figure 13. (a)-(f) Diagrams of variations between major ions and TDS in the groundwater.
The  /Cl− ratio is greater than 1 for the majority of samples in the all area, which suggests that gypsumhalite dissolution reactions take place under the condition of the rock weathering to some extent and evaporation is the dominant factor that determines the major ionic composition of groundwater. The overexploitation of groundwater in the citric region and cities intensifies the mixing of shallow groundwater (porous aquifer) and deep groundwater (fractured aquifer).
This paper shows that the natural origin of ground-
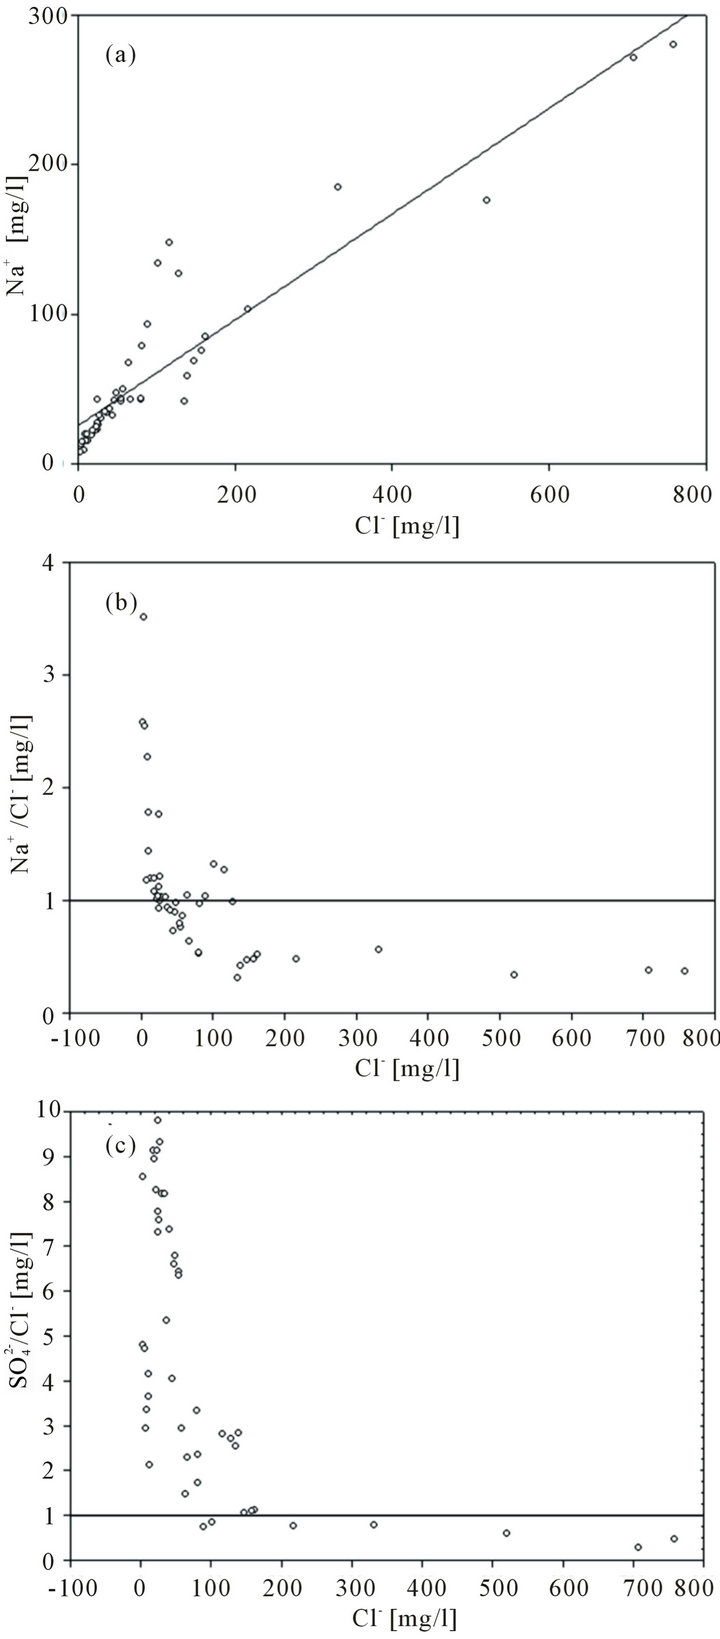
Figure 14. Relationship of Sodium, Na+/Cl− and  /Cl− ratios and chloride.
water affects its quality which can produce health problems in human beans. The groundwater pollution generated by anthropogenic activities should not be the only factor to be considerate in the quality of drinking water.
7. Acknowledgements
Financial support for this work was provided by the PAICyT project CT 124-09 of Universidad Autónoma de Nuevo León, México. Thanks to the Institut für Angewandte Geowissenchaften, Technische Universität Darmstadt-Germany. Special thanks to Prof. Christoph Schü- th and Prof. Andreas Hoppe for their trust. Thanks to the Deutscher Akademischer Austausch Dienst (DAAD-Germany) for support the Ph.D program. The authors would also like to acknowledge the associate editor and the anonymous reviewers for their valuable and constructive comments.
REFERENCES
- CNA, “Determinación de la Disponibilidad de Agua en el Acuífero Citrícola sur, Estado de Nuevo León,” Comisión Nacional del Agua, Monterrey, Nuevo León, 2002.
- M. Jalali, “Geochemistry Characterization of Groundwater in an Agricultural Area of Razan, Hamadan, Iran,” Environmental Geology, Vol. 56, No. 7, 2009, pp. 1479- 1488.
- Q. Feng, G. Cheng and K. Masao, “Trends of Water Resources Development and Utilization in Arid North-West China,” Environmental Geology, Vol. 39, No. 8, 2000, pp. 831-838.
- L. Andre, M. Franceschi, P. Pouchan and O. Atteia, “Using Geochemical Data and Modelling to Enhance the Understanding of Groundwater Flow in a Regional Deep Aquifer, Aquitaine Basin South-West of France,” Journal of Hydrology, Vol. 305, No. 1-4, 2005, pp. 40-65.
- J. A. Ramos-Leal and R. Rodriguez-Castillo, “Aquifer Vulnerability Mapping in the Turbio River Valley, Mexico: A Validation Study,” Geofísica Internacional, Vol. 42, No. 1, 2003, pp. 141-156.
- INEGI, “Censo de Población y Vivienda 2010,” 2013. http://www.inegi.org.mx/sistemas/consulta_resultados/iter2010.aspx?c=27329&s=est
- Z. De Cserna, “Tectónica de la Sierra Madre Oriental de México, Entre Torreón y Monterrey, México,” 20th Congreso Geológico Internacional, Mexico City, 1956, p. 87.
- H. De León-Gómez, “Die Unterläufigkeit der Talsperre José López Portillo/Cerro Prieto Auf Einer Kalkstein— Mergelstein—Wechselfolge Bei Linares, Nuevo León/ Méxiko,” Ph.D., Mittleilungen zur Ingenieurgeologie und Hydrogeologie, RWTH, Aachen Aachen, 1993.
- A. N. Strahler, “Quantitative Analysis of Watershed Geomorphology,” Transactions—American Geophysical Union, Vol. 38, No. 6, 1957, pp. 913-920.
- S. I. De la Garza-González, “Estudio Geológico/Hidrogeológico de la Región Citrícola Linares-Hualahuises, Nuevo León, NE-México,” Tesis de Licenciatura, Facultad de Ciencias de la Tierra, Universidad Autónoma de Nuevo León, Linares, 2000.
- H. De León-Gómez, “Aspectos Hidrogeológicos GenRerales de la Cuenca del río Pablillo, Linares, N.L., Mé- xico,” In: Primer Simposium Regional. Avances y Perspectivas de la Investigación de Recursos Ábioticos del Noreste de México: Agua, Clima, Suelo y Geología, Universidad Autónoma de Tamaulipas, Cd. Victoria, Tamaulipas, 2-4 de Abril de 1990, 1989.
- J. M. Barbarín-Castillo, H. W. Hubberten, P. Meiburg and C. O. Rodríguez, “Hidrogeoquímica de las Aguas Termales del Baño San Ignacio, Linares, Nuevo León, Mé- xico,” Actas Facultad Ciencias de la Tierra, Vol. 3, 1988, pp. 89-99.
- S. M. Galván-Mancilla, “Cartografía Hidrogeológica de la Terraza Baja Entre Hualahuises y Linares, N.L.,” Tesis de Licenciatura, Facultad de Ciencias de la Tierra, Universidad Autónoma de Nuevo León., Linares, 1996.
- L. Lizárraga-Mendiola, H. De-León Gómez, F. Medina- Barrera and J. Návar, “Evaluation of the Impacted Aquifer by the Landfill of Linares, Mexico,” Zbl. Geol. Paläont. Teil I, Vol. 23, 2004, pp. 225-244.
- L. G. Lizárraga-Mendiola, “Análisis y Evaluación del Agua Subterránea del Área del Tiradero Municipal y La Petaca, Linares, N.L. México," Tesis de Maestria, Facultad de Ciencias de la Tierra, Universidad Autónoma de Nuevo León, Linares, 2003.
- S. Schuster, “Ansätze für ein Hydrogeologisches Informationssystem für die Municipios de Linares und Hualahuises. Nuevo Leon,” Diplomarbeit, Fakultät für Geowissenschaften, Universität Leipzig, Leipzig, 1999.
- L. Moreno-Esparza, “Vulnerabilidad del Agua Subterránea a la Contaminación en la Región de Linares Mediante el Método DRASTIC,” Engineering, Facultad de Ciencias de la Tierra, Universidad Autónoma de Nuevo León, Linares, 2009.
- A. A. Aldama, J. Aparaicio, C. Gutiérrez-Ojeda, M. Martínez- Morales, L. González-Hita, G. Herrera-Zamarrón, et al., “Comportamiento Hidrogeológico de los Acuíferps Cuatrocienegas y El Hundido, Coahuila, México,” Tecnología y Ciencias del Agua, Vol. 22, 2007, pp. 37-59.
- A. M. Al-Shaibani, “Hydrogeology and Hydrochemistry of a Shallow Aluvial Aquifer, Western Saudi Arabia,” Hydrogeology Journal, Vol. 16, No. 1, 2008, pp. 155- 165.
- Y. Jiang, C. Zhang, D. Yuan, G. Zhang and R. He, “Impact of Land Use Change on Groundwater Quality in a Typical Karst Watershed of Southwest China: A Case Study of the Xiaojiang Watershed, Yunnan Province,” Hydrogeology Journal, Vol. 16, No. 4, 2008, pp. 727- 735.
NOTES
*Corresponding author.