Journal of Water Resource and Protection
Vol.4 No.2(2012), Article ID:17420,14 pages DOI:10.4236/jwarp.2012.42007
Climate Change and Heavy Rainfall-Related Water Damage Insurance Claims and Losses in Ontario, Canada
1Science Section, Operations-Ontario, Meteorological Service of Canada, Environment Canada, Toronto, Canada
2Adaptation and Impacts Research Section, Science and Technology Branch, Environment Canada, Toronto, Canada
Email: *shouquan.cheng@ec.gc.ca
Received November 1, 2011; revised December 5, 2011; accepted January 10, 2012
Keywords: Climate Change; Statistical Downscaling; Rainfall-Related Flooding Risks; Water Damage; Insurance Claims; Canada
ABSTRACT
The objective of this paper was to project possible impacts of climate change on heavy rainfall-related water damage insurance claims and incurred losses for four selected cites (Kitchener-Waterloo, London, Ottawa, and Toronto) located at Ontario, Canada. To achieve this goal, the future climate change scenarios and rainfall simulations, at local scale, were needed. A statistical downscaling method was used to downscale five global climate model (GCM) scenarios to selected weather stations. The downscaled meteorological variables included surface and upper-air hourly temperature, dew point, west-east and south-north winds, air pressure, and total cloud cover. These variables are necessary to project future daily rainfall quantities using within-weather-type rainfall simulation models. A model result verification process has been built into the whole exercise, including rainfall simulation modeling and the development of downscaling transfer functions. The results of the verification, based on historical observations of the outcome variables simulated by the models, showed a very good agreement. To effectively evaluate heavy rainfall-related water damage insurance claims and incurred losses, a rainfall index was developed considering rainfall intensity and duration. The index was evaluated to link with insurance data as to determination of a critical threshold of the rainfall index for triggering high numbers of rainfall-related water damage insurance claims and incurred losses. The relationship between rainfall index and insurance data was used with future rainfall simulations to project changes in future heavy rainfall-related sewer flood risks in terms of water damage insurance claims and incurred losses. The modeled results showed that, averaged over the five GCM scenarios and across the study area, both the monthly total number of rainfall-related water damage claims and incurred losses could increase by about 13%, 20% and 30% for the periods 2016-2035, 2046-2065, and 2081-2100, respectively (from the four-city seasonal average of 12 ± 1.7 thousand claims and $88 ± $21 million during April-September 1992-2002). Within the context of this study, increases in the future number of insurance claims and incurred losses in the study area are driven by only increases in future heavy rainfall events.
1. Introduction
Increased risks of flooding from heavy rainfall events are recognized in many regions of the world because of the most important threat from climate change. In Canada, the number of flood disasters has significantly risen in the past three decades. From the Canadian Disaster Database of the Public Safety and Emergency Preparedness Canada [1], as shown in Figure 1, there were less than 10 disasters per decade in the first half of the 20th century and 44, 50, and 51 in the 1970s, 1980s, and 1990s, respectively. Using the same database, Brooks et al. [2] identified that flooding in Canada has been directly or indirectly associated with at least $2 billion of damage in the 20th century. From the database, in Ontario, the flood damages have been estimated at about $80 million for each decade of the 1970s and 1980s and about $90 million for the 1990s [3,4]. These figures pertaining to the number of flood disasters and associated damage costs should be considered as minimums, since certain criteria had to be met for the events to be counted as relevant. As result, the actual number of disasters and associated costs may be much higher. Data from CGI Insurance Business Services with respect to monthly aggregated flooding/sewer backup costs revealed that the total rainfallrelated water damage incurred losses for the period April-September 1992-2002 was about $970 million for the four selected cities combined (London, Kitchener-Waterloo, Toronto, and Ottawa, as shown in Figure 2). The annual averaged six-month total incurred losses in the period 1997-2002 increased by 71% compared to

Figure 1. Frequency of flood disasters in Canada, 1900-1999 (Data source: PSEPC, 2006: Canadian Disaster Database version 4.4 [1]).

Figure 2. Study area and location of four selected watersheds in Ontario, Canada.
the annual averaged total losses of $64 million in the period 1992-1996. In recent years, Ontario has been experiencing an increase in frequency and intensity of flood events and their associated economic losses of the damage [4].
The Intergovernmental Panel on Climate Change [5] has projected that the severity and frequency of extreme events such as floods could be expected to increase late this century under a changing climate. Consequently, such a changing climate could increase the flood disaster economic losses in the future. In light of this concern locally in southern Ontario, Canada, this study was designed to project possible changes in the frequency and intensity of heavy rainfall-related flooding risks late this century for four selected cities in Ontario. The increase in future flood disaster economic losses could be associated with two major factors: climatic and socioeconomic. Over the past years, studies of greenhouse gas (GHG) emissions and their relation to climate change have mainly focused on the modeling of atmosphere-land-ocean interactions in order to improve our understanding of hydrological perspectives under a changing climate. However, there are few records in the literature that provide hydrological and socio-economic information on heavy rainfall-related flooding risks under doubled GHG conditions [6]. Over the past decade, attempts have been made to use the GCM coarse-scale scenarios to assess the socioeconomic impacts on communities. For example, Smith [7] outlined methodologies to assess urban flood damage in Australia without providing quantitative estimates as the GCM social-economic scenarios at that time were inadequate for such prognostications. Penning-Rowsell et al. [8] and Smith [9] used socio-economic and climate scenarios with hydrological modeling to estimate potential climate change impacts on urban flood damage in the southern Netherlands and south-eastern Australia, respectively. Urban flood damage by the year 2070 was projected to be 2.2 times greater than that under present conditions in the southern Netherlands and 2.5 - 10 times greater in south-eastern Australia. A more recent study [10] used socio-economic and climate change scenarios to assess flooding risk in England and Wales over the period 2030-2100. The study concluded that compared to 2003, the economic risk due to flooding by the 2080s could increase up to 20-fold under the highest economic growth scenario, while the projected annual cost of sewer flood damages might be four times greater.
In Canada, many studies have assessed the societal vulnerability as well as the increasing insured and uninsured costs associated with heavy rainfall-related flood damage under the present climate [11-13]. However, quantified analyses of flooding risks under future climate scenarios are relatively few. As part of the research project, more recent studies intend to apply station-scale climate change scenarios with the daily rainfall simulation models to project future daily rainfall quantities [14,15]. This future daily rainfall quantitative information will be employed in the current paper to project possible impacts of climate change on future heavy rainfall-related sewer flood insurance claims and incurred losses in four selected cities in the province of Ontario, Canada.
To project heavy rainfall-related sewer flood risks in the future, Cheng et al. [14,15] have developed withinsynoptic-weather-type daily rainfall simulation models to project future daily rainfall quantities, using downscaled standard meteorological variables that were derived by Cheng et al. [16]. The simulation models were developed by considering physical process of rainfall formation with combining theories from both conceptual and statistical modeling. These studies [14,15] attempted to project possible changes in the frequency and intensity of daily rainfall events late this century for the four selected watersheds (Grand, Humber, Rideau, and Upper Thames as shown in Figure 2) in southern Ontario, Canada. In the study [14], since the climate/weather validation process is critical, a formal model result verification process has been built into the analysis to ascertain whether the methods are stable for projection of changes in frequency of future daily rainfall events. For evaluation of daily rainfall-quantity simulation models, four correctness classifications of “excellent”, “good”, “fair”, and “poor” were defined, based on the difference between daily rainfall observations and model simulations. Across four selected river basins, the percentage of excellent and good simulations for model development ranged from 62% to 84%; the corresponding percentage for model validation ranged from 50% to 76%. In addition, Cheng et al. [15] concluded that the methods used in the study are suitable for projecting future station-scale daily rainfall information since data distributions of daily rainfall from both downscaled GCM historical runs and observations over the same time period (1961-2000) in the selected river basins are very similar.
2. Data Sources
Personal and commercial property insurance claims data were provided by CGI Insurance Business Services. The data were aggregated at the monthly level for April-September 1992-2002 at each of the selected cities (KitchenerWaterloo, London, Ottawa, and Toronto, as shown in Figure 2). The data include monthly total number of insurance claims and monthly total incurred losses of personal and commercial property damages, which were caused by water damage including rainfall-related sewer backup, flood and business interruption. To effectively compare insurance costs in terms of dollars from 1992 to 2002, the values were adjusted for inflation in the analysis: the incurred losses for the period 1992-2001 were converted to the values representative of the year 2002, based on inflation rates from the Bank of Canada’s Web site [17].
To better understand monthly and yearly distributions of insurance claims and costs, the monthly and yearly average total number of insurance water damage claims and total incurred losses were calculated and are displayed in Figures 3 and 4. The results suggest that, across the selected cities, there was no evidence of a common pattern with respect to monthly average insurance water damage claims. Figure 4 reveals that there were some years with a very high number of water damage claims that resulted from some large claim events. For example, the monthly total number of water damage insurance claims recorded in 2000 for London and Toronto and in 1996 for Ottawa was approximately double that of the

Figure 3. Monthly average total number of insurance water damage claims and total incurred losses for the period April-September 1992-2002 four selected cities (note varying scales of measurement).

Figure 4. Time series of seasonal total number of insurance water damage claims and total incurred losses for the period April-September 1992-2002 in four selected cities (Note varying scales of measurement).
rest of the years averaged together. Specifically, the total number of claims in June 2000 for London, May 2000 for Toronto, and August 1996 for Ottawa was 1078, 5946, and 2324, respectively (the averaged six-month totals for the rest of the years: 928, 7160, and 2059 for London, Toronto, and Ottawa, respectively). The months associated with a large number of claims usually experienced heavy rainfall events. For example, in the London area, three heavy rainfall events occurred in June 2000, with rainfall measured as 83, 35, and 42 mm for June 11, 13-14, and 24-26, respectively.
To project possible climate change impacts on future heavy rainfall-related sewer flood risks, the historical observations and future projections of rainfall information are essential. Historical observations include daily/ hourly rainfall data within the four selected river basins, which were used in daily rainfall simulation modeling [14]. The future daily rainfall information, projected by a recent study [15], was also used in the current analysis. To project future daily rainfall quantities, the downscaled future climate change scenarios for many weather parameters except rainfall were used with within-weathertype rainfall simulation models (refer to Section 3 for details).
Daily climate change scenarios from various GCMs, including three Canadian GCMs—CGCM1 IPCC IS92a and CGCM2 IPCC SRES A2/B2, one US GCM-GFDLCM2.0 SRES A2, and one German GCM-ECHAM5/MPIOM SRES A2, were used in the study. The daily climate change scenarios were retrieved from the Web sites of both Environment Canada [18] and the Program for Climate Model Diagnosis and Intercomparison (PCMDI) [19]. The GCM future simulations for two periods (2046- 2065 and 2081-2100) are available from the PCMDI Web site. Another time window (2016-2035) is available for CGCMs from the Environment Canada Web site and was also used in the study. In addition, the historical runs (1961-2000) of the five GCM simulations were used to correct the GCM model biases.
3. Summary of the Previous Studies
As part of this research, Cheng et al. [14] have developed within-weather-type simulation models to simulate daily rainfall quantities and statistical downscaling transfer functions to downscale standard meteorological variables to the relevant stations [16]. More recently, Cheng et al. [15] have applied daily rainfall simulation models and statistical downscaling transfer functions to project future daily rainfall quantities. Since these studies were used in this current paper to project possible impacts of climate change on heavy rainfall-related water damage insurance claims and incurred losses, it is necessary to outline major methods used in and results derived from these studies.
A recent study by Cheng et al. [14] employed an automated synoptic weather typing as well as stepwise cumulative logit and nonlinear regression analyses to simulate the occurrence and quantity of daily rainfall events. The synoptic weather typing was developed using principal components analysis (PCA), an average linkage clustering procedure, and discriminant function analysis to identify the weather types most likely to be associated with daily rainfall events for the four selected river basins in Ontario. The entire suite of 144 weather variables during the period April-November 1958-2002 were used in synoptic weather typing, which are hourly surface weather observations of six elements: air temperature, dew point temperature, sea-level air pressure, total cloud cover, and south-north and west-east wind speed. Ten synoptic weather types were identified over the 45-year period as primary rainfall-related weather types. These ten weather types can capture 73% - 77%, 92% - 93%, and 95% - 98% of the rainfall events with daily rainfall greater than or equal to 0.2 mm, 10 mm, and 25 mm, respectively, across the selected river basins.
Within-weather-type daily rainfall simulation modeling comprises a two-step process: 1) cumulative logit regression to predict the occurrence of daily rainfall events, and 2) using probability of the cumulative logit regression, a nonlinear regression procedure to simulate daily rainfall quantities. The 228 predictors used in development of daily rainfall event occurrence simulation models include not only the standard meteorological variables but also a number of the atmospheric stability indices (e.g., Lifted index [20]; K-index [21]; Total Totals index [22]). Across the four selected river basins, the daily-rainfall-event occurrence simulation models revealed that there are significant correlations between the occurrence of daily rainfall events and model simulations. As described in the study by Cheng et al. [14], the models’ concordances, derived from cumulative logit regression, range from 0.82 to 0.96 (a perfect model would have a concordance value of 1.0). To evaluate performance of daily rainfall quantity simulation models, the four correctness levels of “excellent”, “good”, “fair” and “poor” were defined based on the absolute difference between observed and simulated daily rainfall amounts. As described in the study [14], the proportion of simulations on daily rainfall quantities that fell into excellent and good categories was much higher than the proportion that fell into fair and poor categories. For example, across the four selected river basins, the percentage of excellent and good daily rainfall simulations ranged from 62% to 84%.
To project future daily rainfall, in addition to daily rainfall simulation models, downscaled future hourly climate information for the standard meteorological variables (excluding rainfall) that were used in development of daily rainfall simulation models, as described above, is needed. To achieve this, a regression-based downscaling method developed by Cheng et al. [16] was adapted for this current study. This downscaling method comprises a two-step process: to spatially downscale daily GCM simulations to the selected weather stations in the selected river basins and then to temporally downscale daily scenarios to hourly time steps. The downscaling transfer functions were constructed using different regression methods for different meteorological variables since a regression method is suitable only for a certain kind of data with a specific distribution. Performance of the downscaling methods was evaluated by 1) analyzing model R2s of downscaling transfer functions, 2) validating downscaling transfer functions using a leave-one-year-out cross-validation scheme, and 3) comparing data distributions, diurnal/seasonal variations, and extreme characteristics of the weather variables derived from downscaled GCM historical runs with observations over a comparative time period of 1961-2000. The results showed that regression-based downscaling methods performed very well in deriving daily and hourly station-scale climate information for all weather variables. Most of the daily downscaling transfer functions possess model R2s greater than 0.9 for surface temperature, sea-level air pressure, upper-air temperature and winds; the corresponding model R2s for daily surface winds are generally greater than 0.8. The hourly downscaling transfer functions for surface air temperatures, dew point, and sea-level air pressure possess the highest model R2 (>0.95) of the weather elements. The functions for south-north wind speed are the weakest model (model R2s ranging from 0.69 to 0.92 with half of them >0.89). For total cloud cover, hourly downscaling transfer functions developed using the cumulative logit regression have concordances which range from 0.78 to 0.87 with over 75% > 0.8.
Following downscaling of future hourly climate data, the daily within-weather-type rainfall simulation models were able to be used to project future daily rainfall quantities. To achieve this, future daily weather types are needed and projected by applying synoptic weather typing methods with the downscaled future hourly climate data, as described by Cheng et al. [15]. To remove GCM model biases, future downscaled climate data were standardized using the mean and standard deviation of the downscaled GCM historical runs (1961-2000). Across four selected river basins in the Province of Ontario, Canada, the number of days with rainfall ≥25 mm is projected to increase by about 10% - 35% and 35% - 50%, respectively over the periods 2046-2065 and 2081-2100 (from the baseline period April-November, 1961-2002). For seasonal rainfall totals, the corresponding increases are projected to be about 15% - 20% and 20% - 30% by 2046-2065 and 2081-2100, respectively.
4. Historical Analysis
4.1. Monthly Rainfall Index
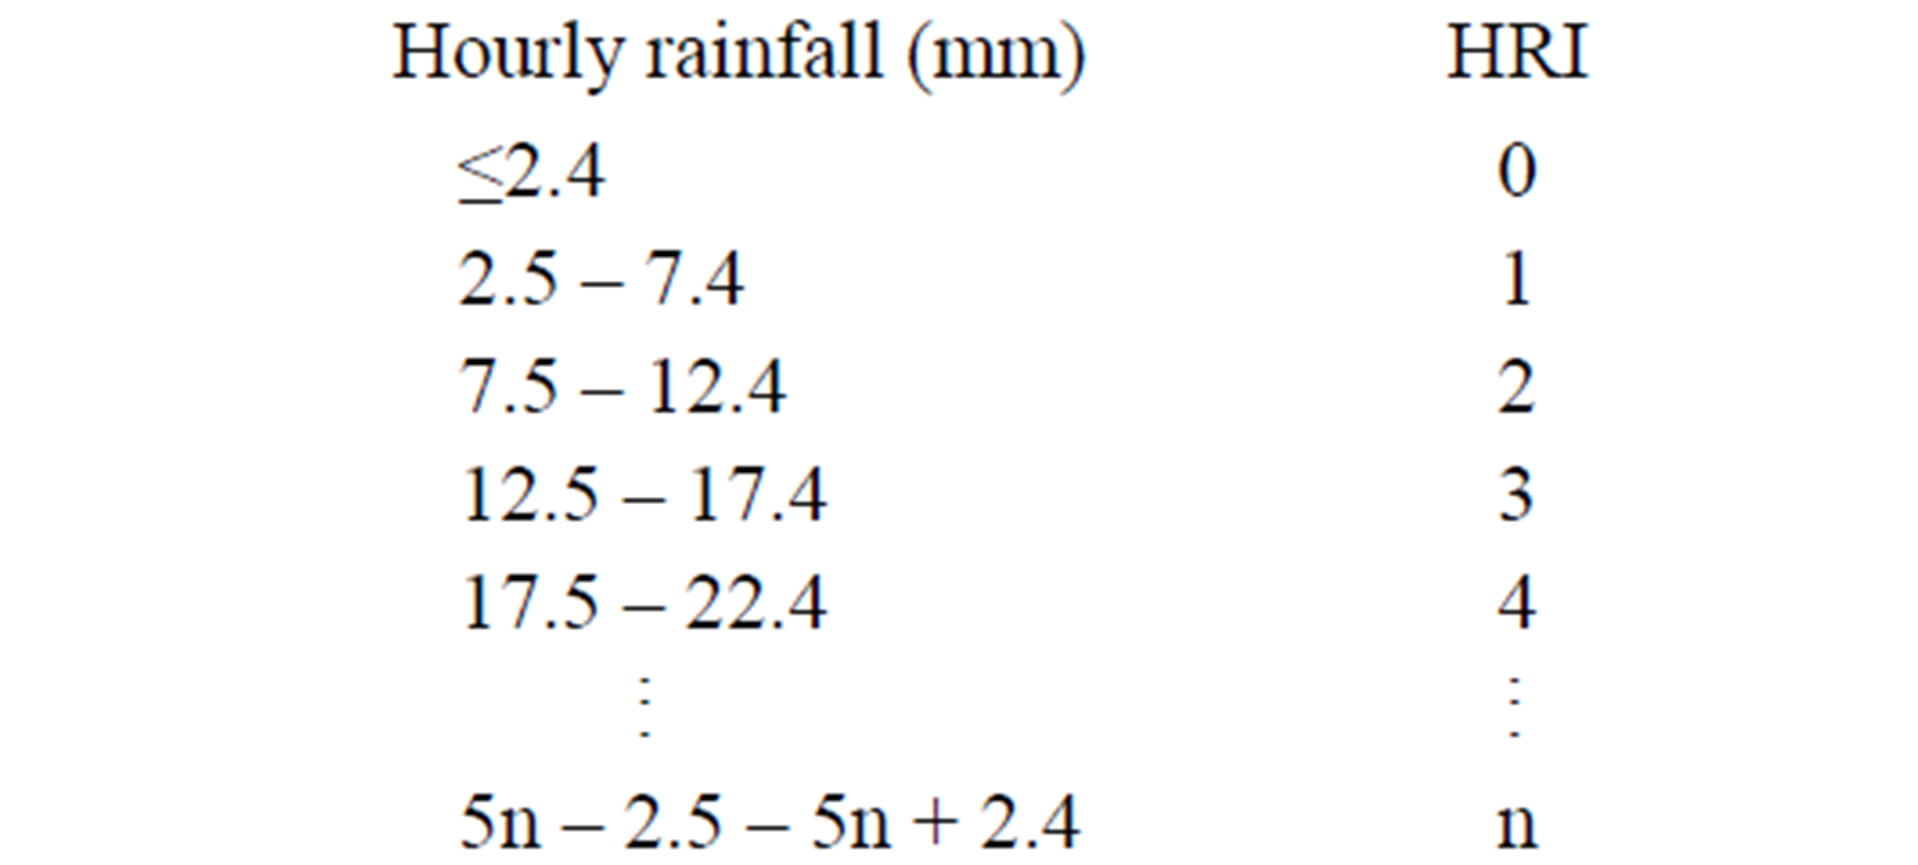
To effectively evaluate heavy rainfall-related water damage insurance claims and incurred losses, a rainfall index was developed considering rainfall intensity and duration. Since insurance claim and cost data were aggregated at the monthly level, the monthly rainfall index (MRI) was determined using hourly rainfall observations. The MRI considers the following rainfall characteristics: 1) hourly rainfall amounts, 2) number of consecutive hours with hourly rainfall ≥ 5 mm during a day, and 3) number of consecutive days with daily rainfall ≥ 15 mm. The thresholds of hourly and daily rainfall amounts used in the analysis are arbitrary; however, it was considered that these thresholds can yield a meaningful number of cases for the analysis. The MRI is calculated according to the following steps:
1) The hourly rainfall index (HRIh) is initially calculated based on hourly rainfall amounts, as outlined below:
2) To effectively consider hourly rainfall intensity during the day, the above HRI needs to be modified to 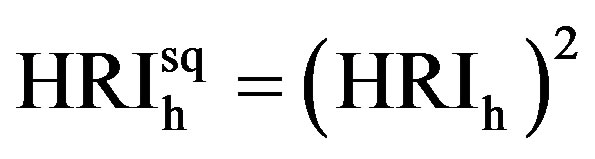 for each of the hours. For example, there are two cases: a 5 mm rainfall was recorded for each of two hours on one day; and a 10 mm rainfall was recorded for one hour on another day. According to the calculation described in step 1, in both cases the same daily accumulated HRI of 2 would result. However, both cases should have different degrees of flooding risks. Based on the modified HRIh described in step 2, the daily accumulated
  for the two days is different: for the first case it is
 , and for the second it is 4 (22).
3) The next consideration is to evaluate “hour in sequence” to track how a particular hour with rainfall ≥ 5 mm is positioned within a consecutive-hour sequence during a day. Within a day, when the first hour meets the rainfall criterion (hourly rainfall ≥ 5 mm), the hour in sequence (Nh) is 1; for the second consecutive hour,  , and so on. For each hour, to consider the impacts of a consecutive sequence of rainfall on water damage, the rainfall index is modified as
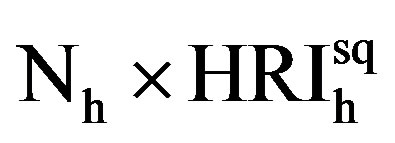 .
.
4) The daily rainfall index (DRId) is the sum of all hourly rainfall indices during a day, as follows:
 (1)
(1)
5) To consider the impacts of a consecutive-day sequence of rainfall events on water damage, “day in sequence” should be taken into account when calculating the MRI. Similar to hour in sequence, day in sequence tracks how a particular day with daily rainfall ≥ 15 mm is positioned within a consecutive-day sequence during a month. When the first day meets the rainfall criterion (daily rainfall ≥ 15 mm), the day in sequence (Nd) is 1; for the second consecutive day,  , and so on. For each day, the rainfall index is produced by multiplying the day in sequence
  with the DRId described above in step 4.
6) Finally, the MRI is the sum of all daily rainfall indices during each month, for the study period (AprilSeptember, 1992-2002), as the following expression:
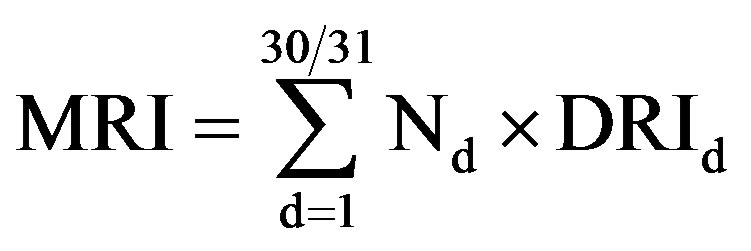 (2)
(2)
4.2. Link between Heavy Rainfall and Water Damage Insurance Claims/Incurred Losses
The relationships between the monthly rainfall index (MRI) and the monthly total number of claims/monthly total incurred losses were evaluated to determine a critical threshold of the rainfall index for triggering high numbers of rainfall-related insurance claims and incurred losses (Figure 5). This analysis was undertaken in the different ways for different cities with availability of hourly rainfall data. For three cities (i.e., London, Ottawa, and Toronto) with a very low percentage of missing hourly rainfall data, as shown in Figure 5, it is immediately apparent that the monthly total number of claims and the monthly total incurred losses for months with the MRI above a certain value are much greater than those for months with the MRI below a certain value. This MRI value was used as the threshold for analysis of

Figure 5. Relationships between monthly rainfall index (MRI) and monthly total number of claims (left)/monthly total incurred losses (right) (April-September 1992-2002) (▲ represents the position of the MRI threshold value for triggering high numbers of rainfall-related water damage insurance claims and incurred losses).
rainfall-related sewer flood water damage claims and incurred losses. From Figure 5, the mean monthly total number of claims for the period April-September 1992- 2002 in London, Toronto, and Ottawa, for months with the MRI above the threshold, was 349, 1844, and 544, respecttively. The corresponding number of the claims for months with the MRI below the threshold was 145, 1104, and 298.
The MRI necessitates to be converted to monthly total rainfall amount because of two reasons: 1) future hourly rainfall scenarios are not available and 2) the MRI is not quite straightforward, especially for providing critical information to the public and decision makers. To achieve this, the relationships between the MRI and monthly total rainfall amount for the period April-September 1961- 2002 were examined for the selected cities where hourly rainfall data were available. As shown in Figure 6, there exists a strong relationship between the MRI and monthly total rainfall amount. Using the equations illustrated in Figure 6, monthly rainfall amount threshold (MRAT) on the y-axis, which could trigger a high number of rainfall-related insurance claims and economic costs, can be calculated based on values of the MRI threshold (Table 1). For reference, the overall mean monthly total rainfall amount and its 95% confidence interval for each city are listed in Table 1. It can be seen that, from the table, the MRAT value varies from city to city; however, all threshold values are greater than the overall mean plus the upper 95% confidence limit.
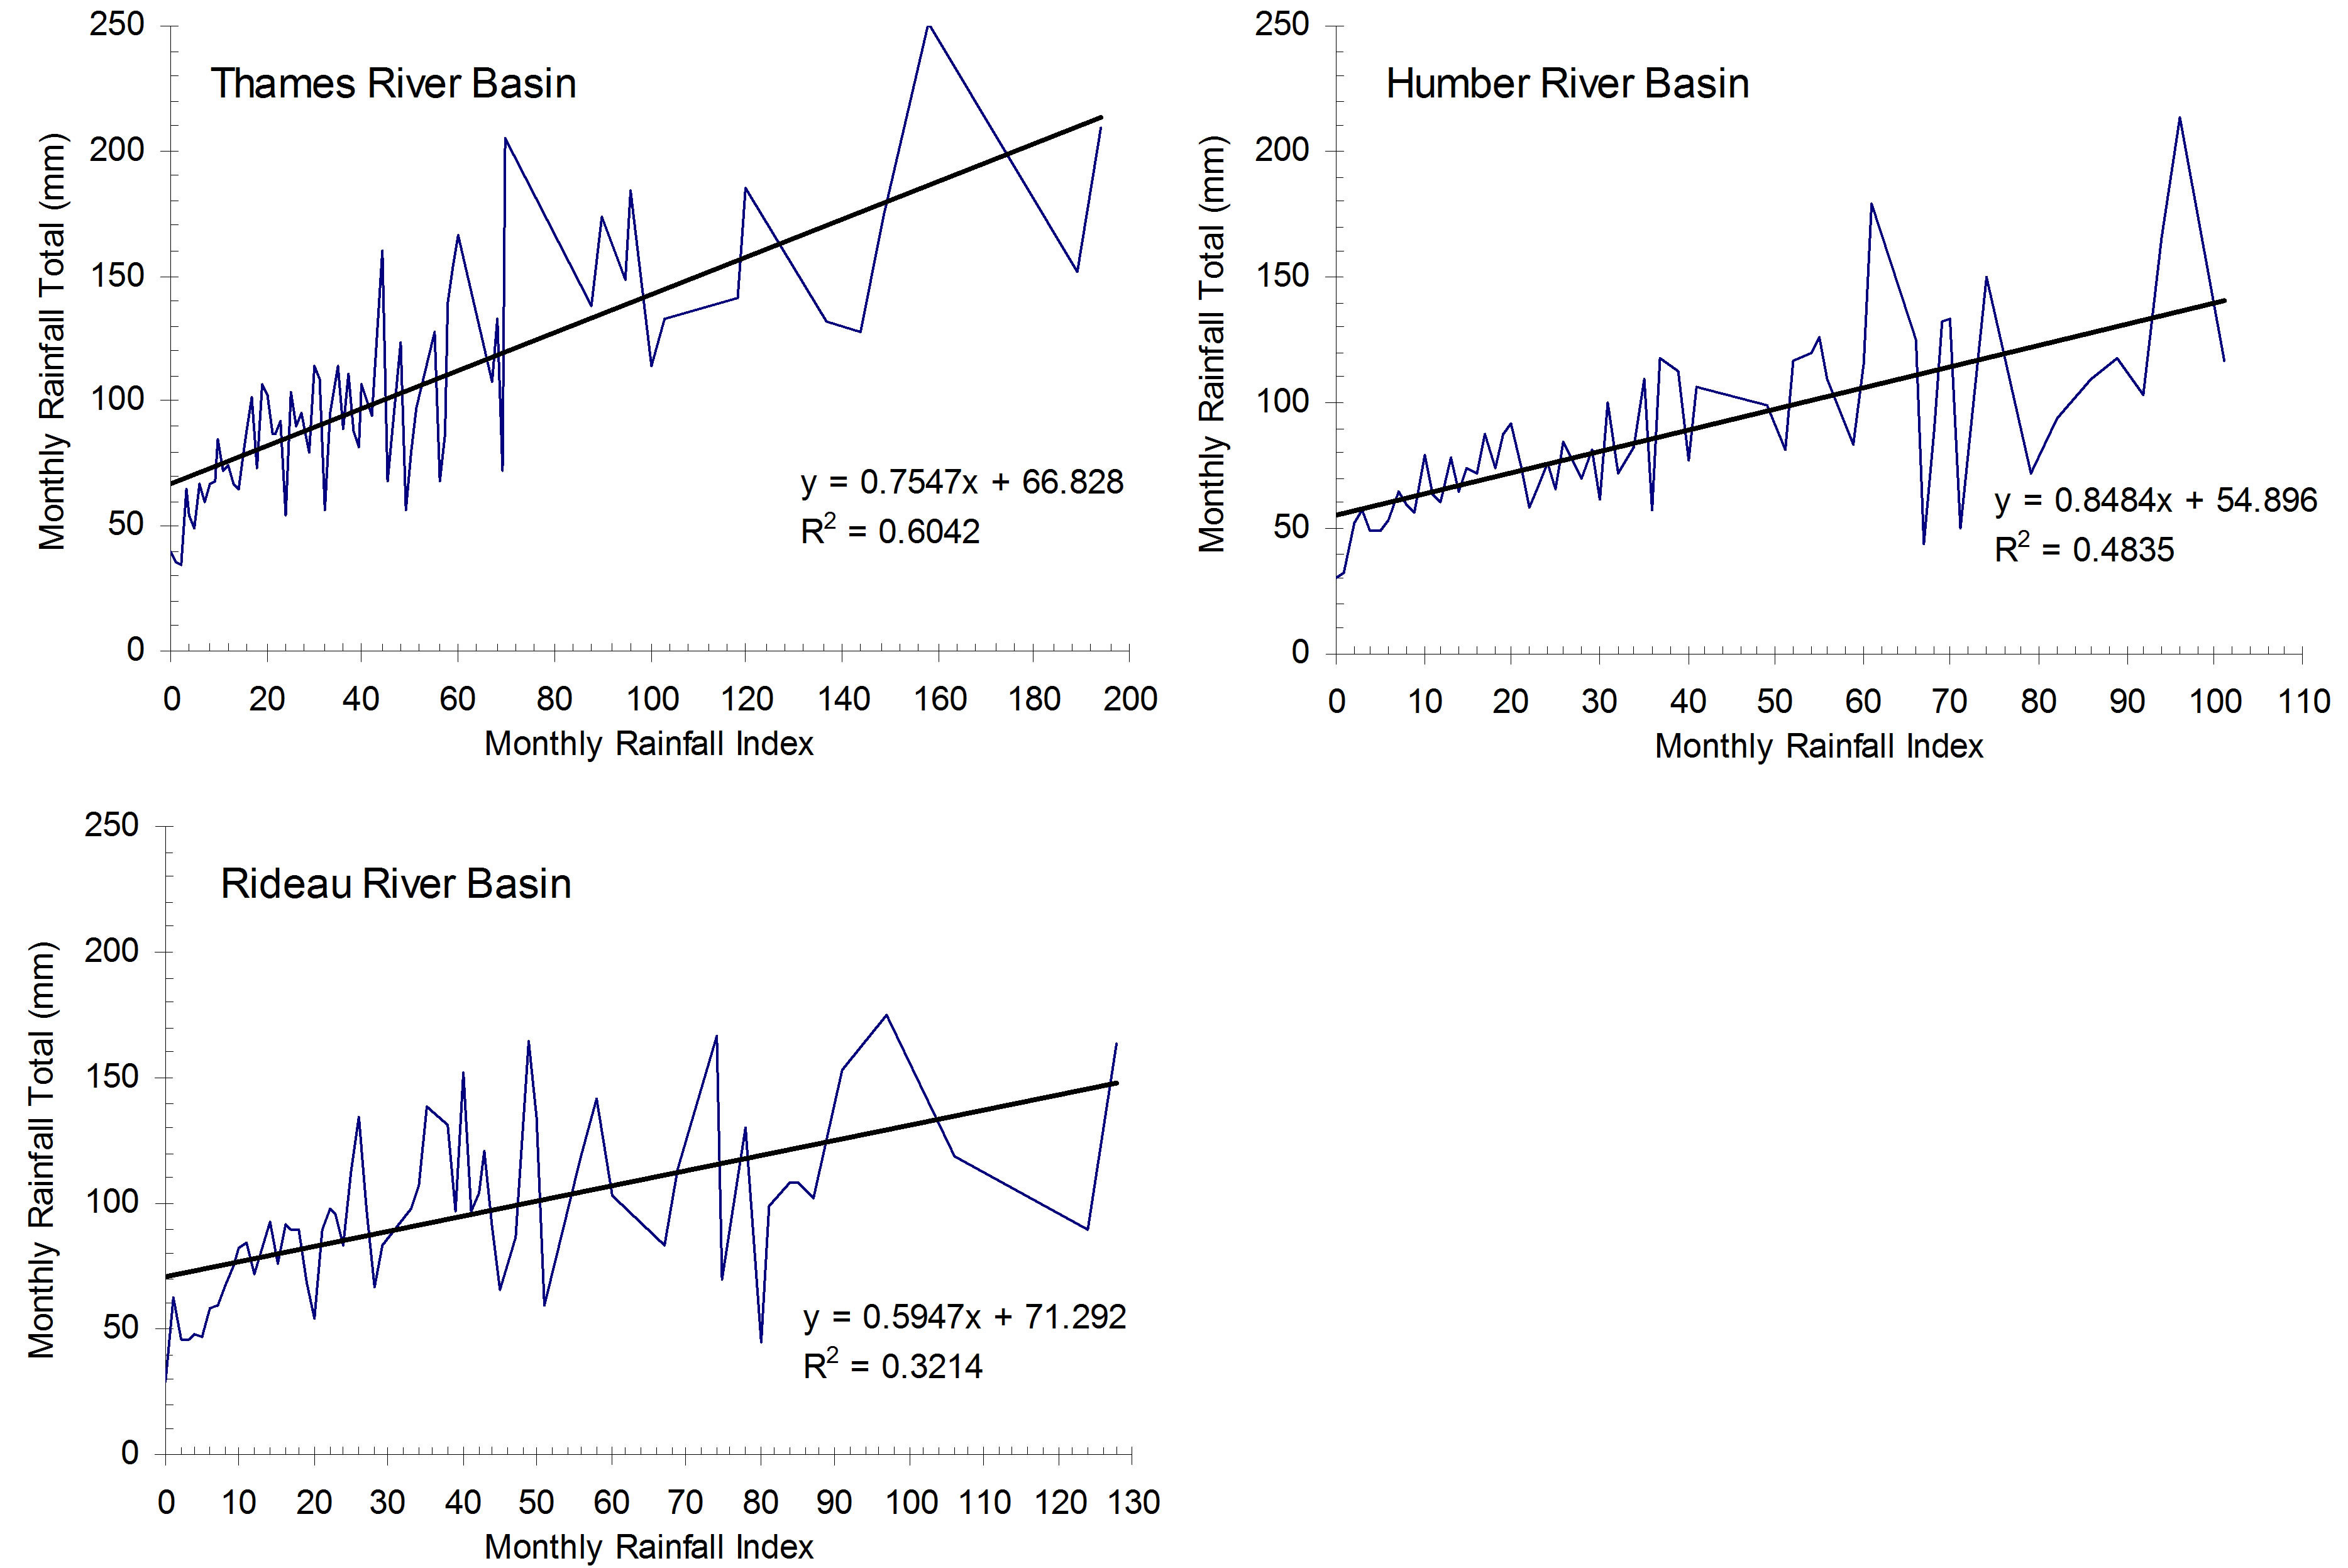
Figure 6. Relationships between monthly total rainfall and monthly rainfall index for three river basins with an adjacent meteorological station (airport) having hourly rainfall observations.
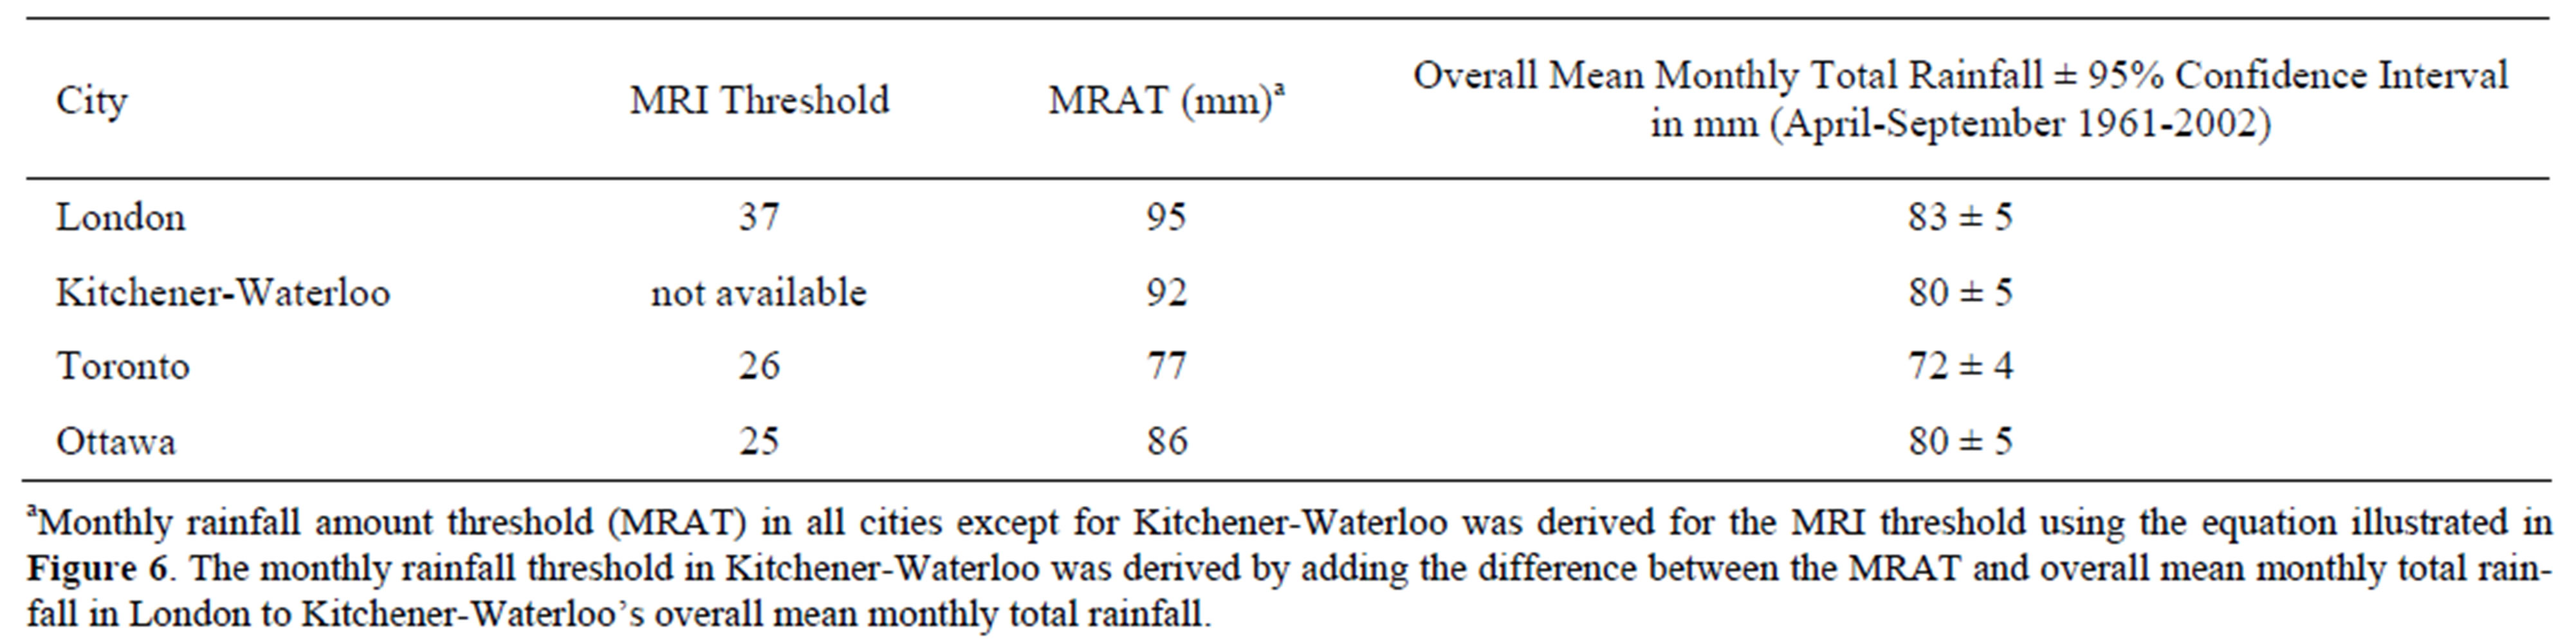
Table 1. Monthly rainfall amount threshold (MRAT) and monthly rainfall index (MRI) in four selected cities.
For the City of Kitchener-Waterloo, having a substantial missing data in hourly rainfall records during the period 1992-2002, a different method was applied to determine the MRAT. There were no any hourly rainfall records observed at Kitchener-Waterloo for 35% of the total months for the period April-September, 1992-2002; another 8% of the months had missing data records for a certain number of days (6 to 9 days). The 57% of the total months with no missing rainfall data were used to test in analyzing the relationships between rainfall and insurance claims, using the same method as used for other cities. The test results indicated that there was no clear evidence showing any MRI thresholds associated with increased insurance claims and incurred losses. This is primarily due to the fact that, because of the missing rainfall data, the ten greatest incurred losses/claims months are excluded from the analysis. It was thus concluded that the hourly rainfall data observed at the City of Kitchener-Waterloo are not suitable for the analysis.
As described by Cheng et al. [14], daily rainfall data observed at climate stations located in the Grand River Basin have a good relationship with the synoptic weather types classified using hourly meteorological data observed at the London International Airport located in the Upper Thames River Basin. The relationship between the MRAT and the overall mean derived for the City of London was used for the City of Kitchener-Waterloo. Specifically, for Kitchener-Waterloo, the MRAT value was determined by adding the difference between London’s MRAT and London’s overall mean monthly total rainfall to the Grand River Basin’s overall mean. The relationship between monthly rainfall total and monthly total number of claims/incurred losses for the City of Kitchener-Waterloo is illustrated in Figure 7.
To more clearly show relationships between monthly rainfall amount and total number of monthly insurance claims/monthly total incurred losses, anomalies of monthly rainfall and insurance claims/incurred losses were analyzed and are displayed in Figure 8. As might be expected, the results showed that most of the months with high-anomaly insurance claims were associated with highanomaly rainfall amounts. To quantitatively describe this, 62 months with the highest-anomaly insurance claims in total during April-September 1992-2002 for the four cities were selected. These months were selected when the monthly insurance claim anomaly was greater than a certain threshold value; specifically the value was 10 for Ottawa, 20 for each of both cities of London and Kitchener-Waterloo, and 80 for Toronto. These threshold values are arbitrary and used in the analysis in order to obtain a certain number of cases from each of the cities. The 62 cases comprise of 18, 14, 16, and 14 for Kitchener-Waterloo, London, Ottawa, and Toronto, and are distributed over the months April to September as 9, 9, 14, 15, 10, and 5, respectively. Of the 62 cases, about 70% (43 months) were associated with high monthly rainfall totals greater than the MRAT. Of the remaining 30% of cases (19 months), the monthly rainfall anomaly was negative (below the overall mean). Seven of the 19 cases were associated with a single heavy rainfall storm or several moderate rainfall processes within a month. Five of the cases were related to heavy rainfall storm(s) that occurred at the end of the previous month, meaning that claims would typically be reported in the following month. The other five cases were associated with localized rainfall storms within the river basin; in these cases the monthly rainfall total was relatively small. For the remaining two cases, no large rainfall events related.
5. Future Projection
Using projections of future daily rainfall quantities, changes in future heavy rainfall-related sewer flood risks in terms of insurance claims and incurred losses could be projected as follows:
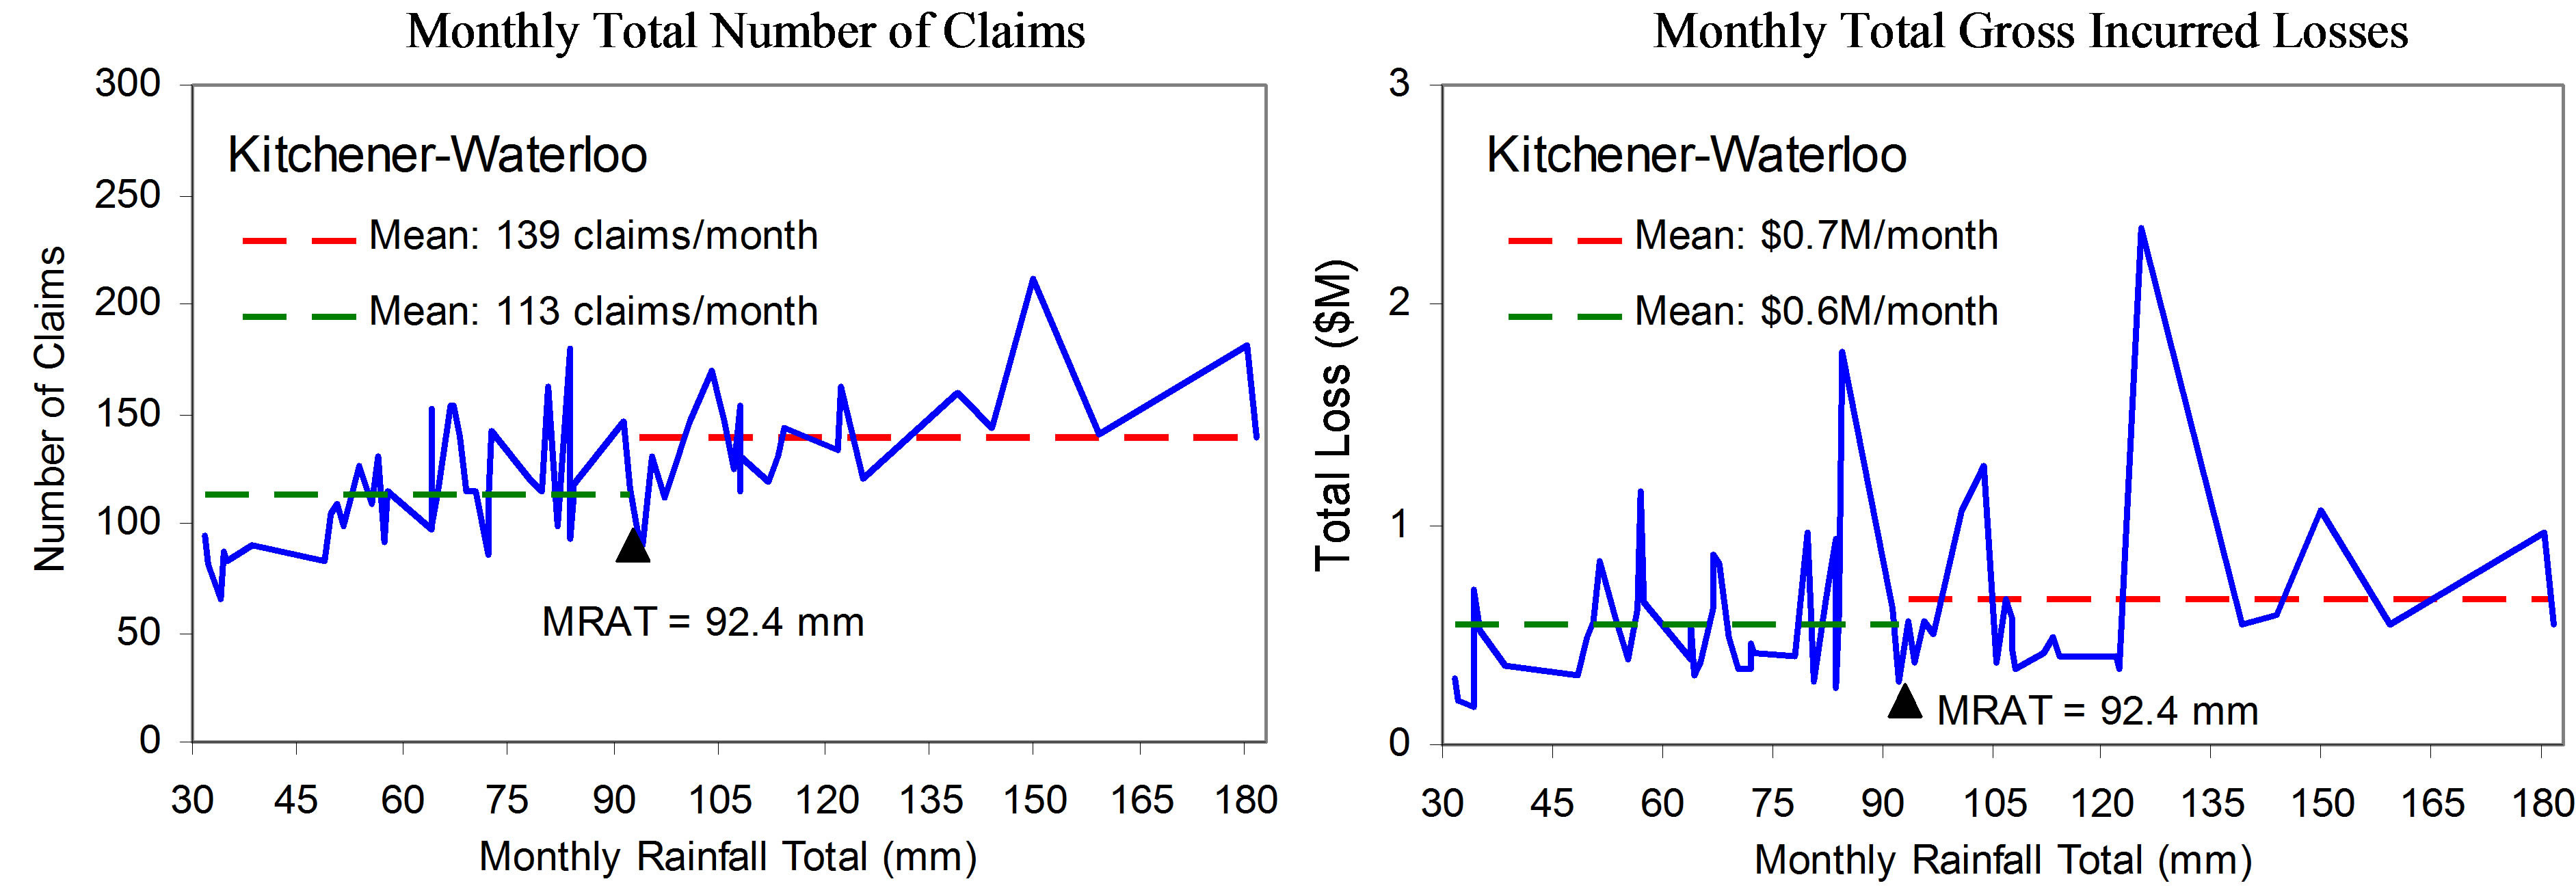
Figure 7. Relationships between monthly rainfall total and monthly total number of claims (left)/monthly total incurred losses (right) (April-September 1992-2002) for Kitchener-Waterloo (▲ represents the position of the monthly rainfall amount threshold (MRAT) for triggering high numbers of rainfall-related water damage insurance claims and incurred losses).
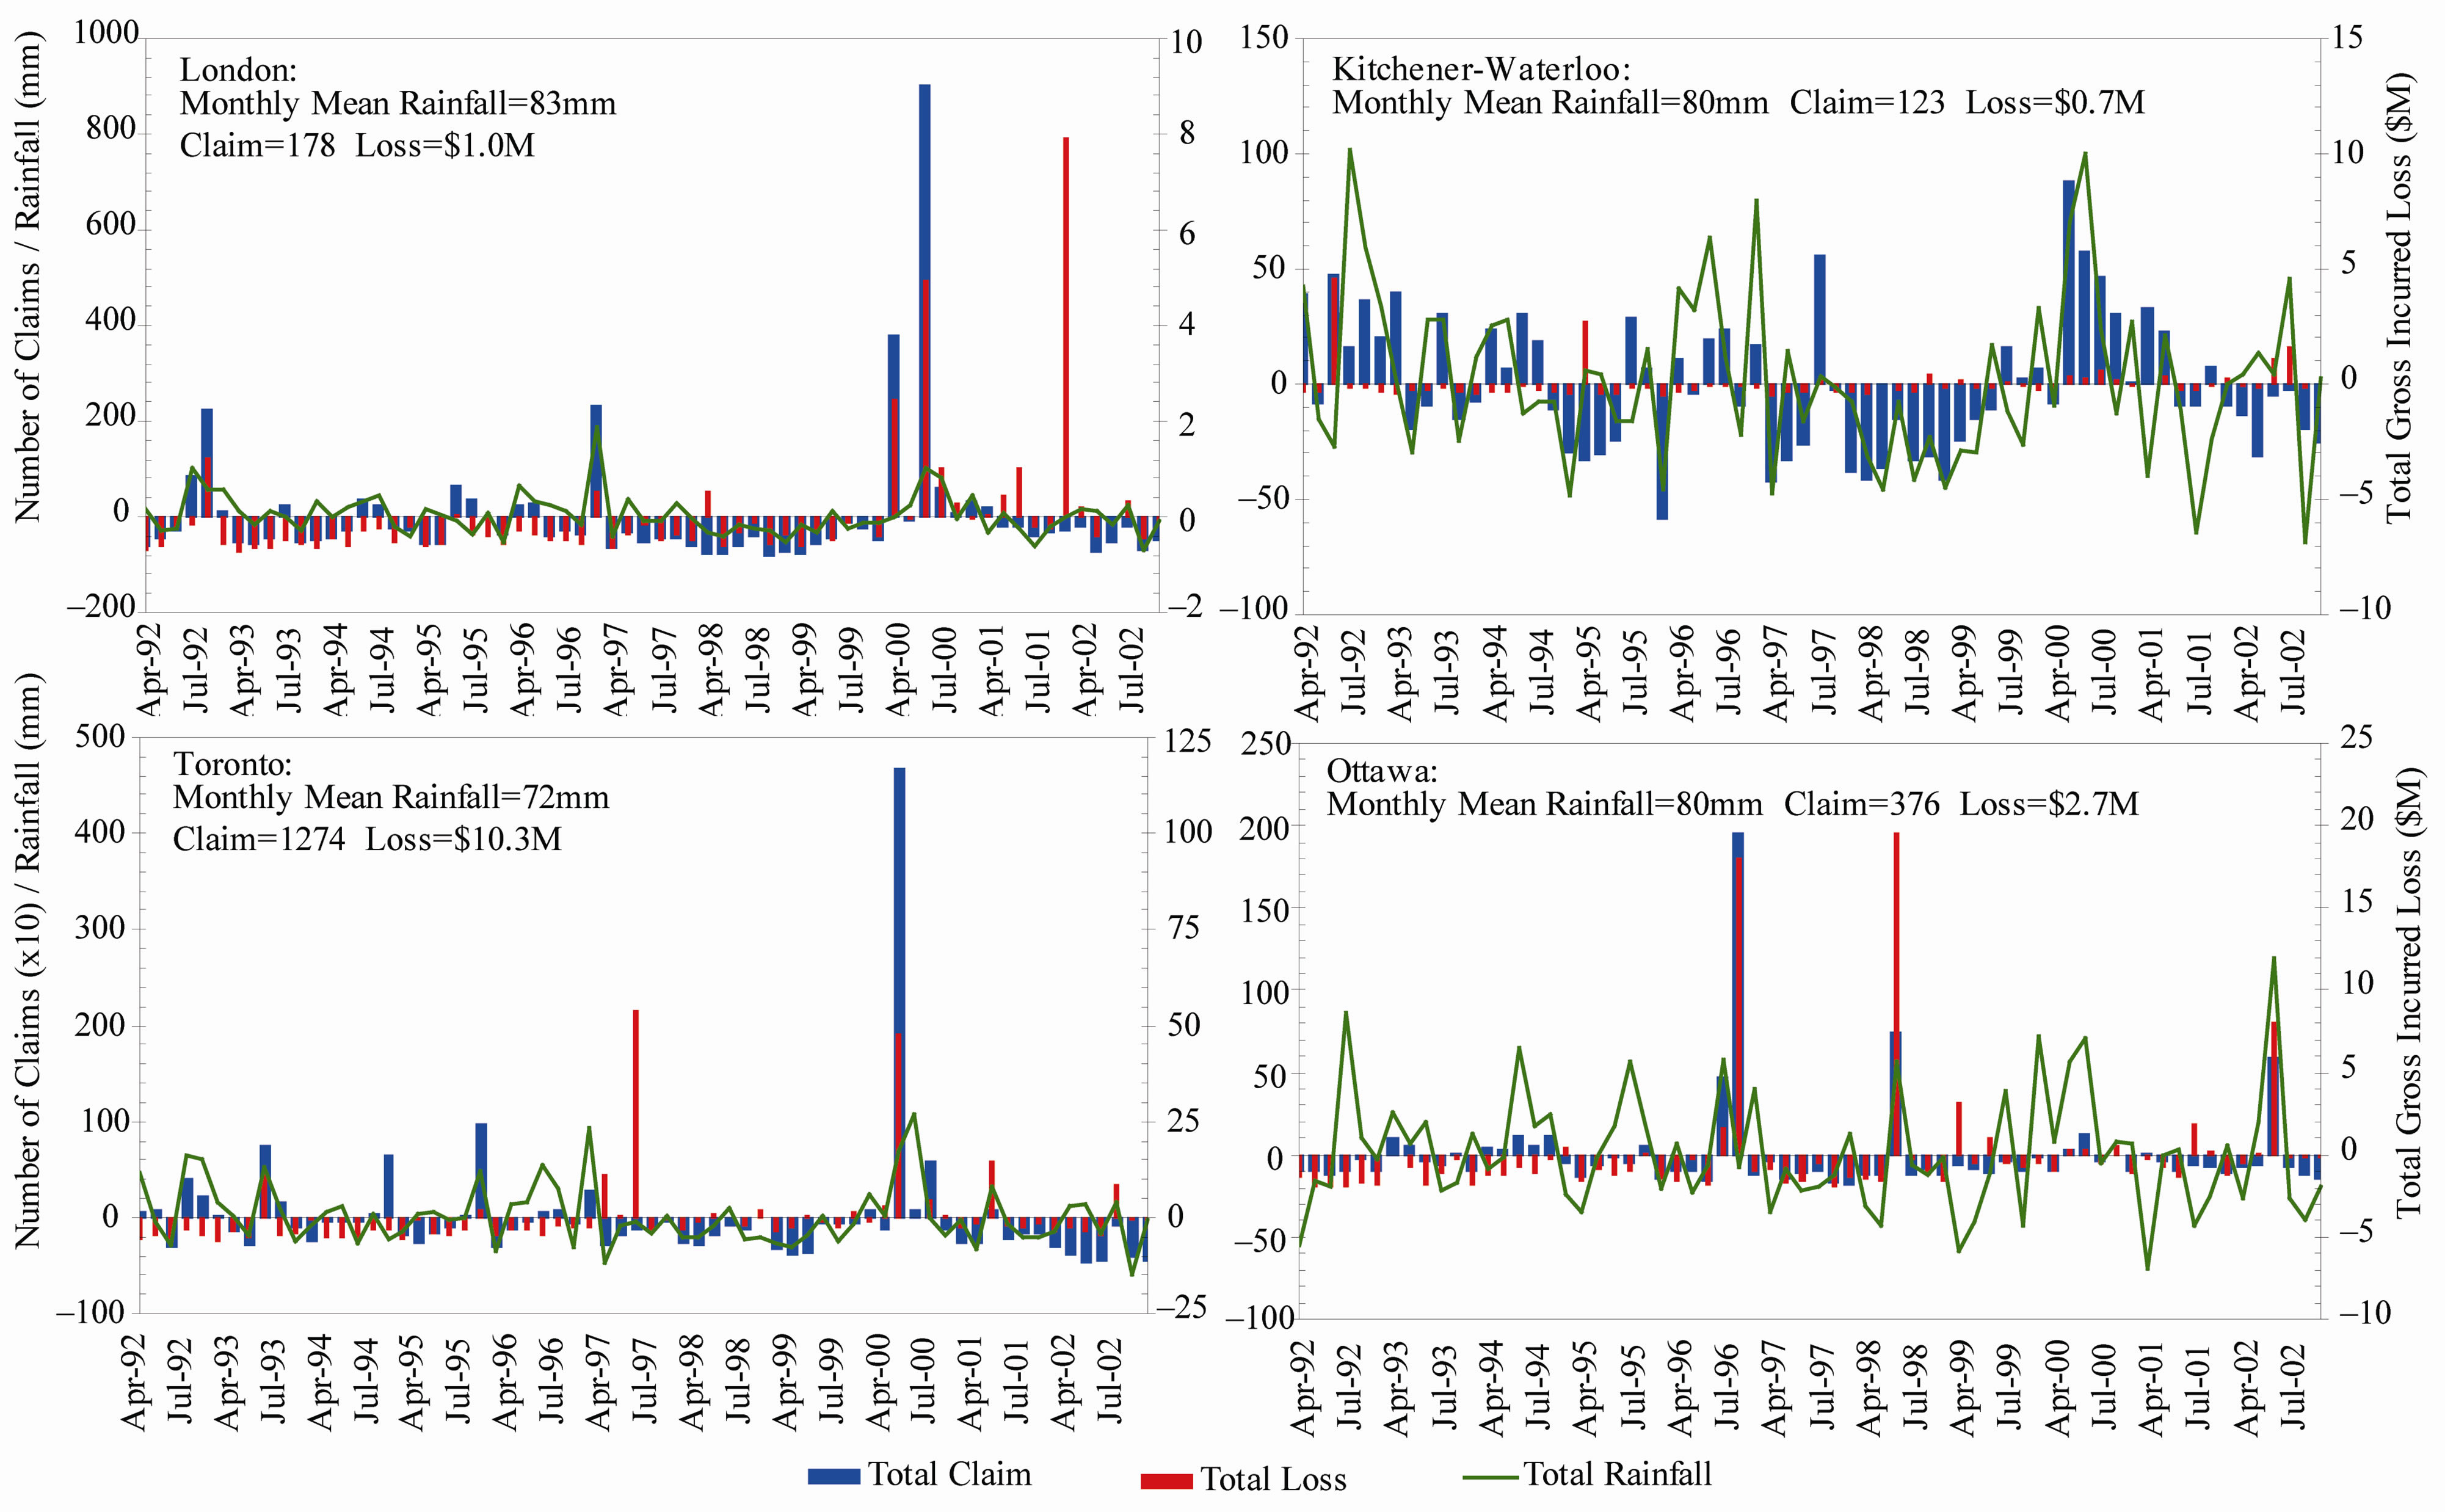
Figure 8. Anomalies of monthly rainfall totals (green line), total number of monthly insurance claims (blue bar) and monthly total incurred losses (red bar) due to rainfall-related water damage in the four selected cities.
 (3)
(3)
where Claimf is future seasonal mean number of insurance claims and Ny is future number of years used in the analysis.  and
and  are the number of months with monthly rainfall totals < and ≥ the critical threshold of monthly rainfall amount, respectively.
  and
and  are the historical monthly mean number of claims with monthly rainfall totals < and ≥ the critical threshold of monthly rainfall amount, respectively. Similarly, future rainfall-related water damage incurred losses can be projected when the number of claims in the Equation (3) is replaced by the incurred losses.
Before projecting changes in future heavy rainfall-related insurance claims and incurred losses, it is necessary to ascertain whether methods used in the analysis are suitable for future projections. To achieve this goal, we analyzed the difference in the number of insurance claims and incurred losses between the results derived from downscaled GCM historical runs and actual values for the same time period April-September 1990-2000. The monthly mean number of rainfall-related insurance claims and incurred losses derived from GCM historical runs and actual values are shown in Table 2. Generally, the results derived from downscaled GCM historical runs are similar to the actual numbers. To quantitatively assess both differences, mean relative absolute differences (RAD) between observations (Oi) and downscaled GCM historical runs (Di) were calculated by the following expression:
 (4)
(4)
where N is the number of total pairs of the data sample shown in Table 2. The relative absolute differences in the monthly mean number of rainfall-related insurance claims and incurred losses vary from 3% to 7% except for monthly mean number of insurance claims in the cities of London (about 10%) and Ottawa (about 20%). These differences were used to adjust projections of changes in the monthly total number of future rainfallrelated insurance claims and total incurred losses, in order to further remove GCM model and downscaling method biases on projections of future rainfall-related sewer flood risks.
The results of percentage changes in future monthly total number of claims and total incurred losses projected from the five future downscaled climate change scenarios are graphically illustrated in Figure 9. It is immediately apparent, from Figure 9, that the increases in future monthly total number of claims and total incurred losses
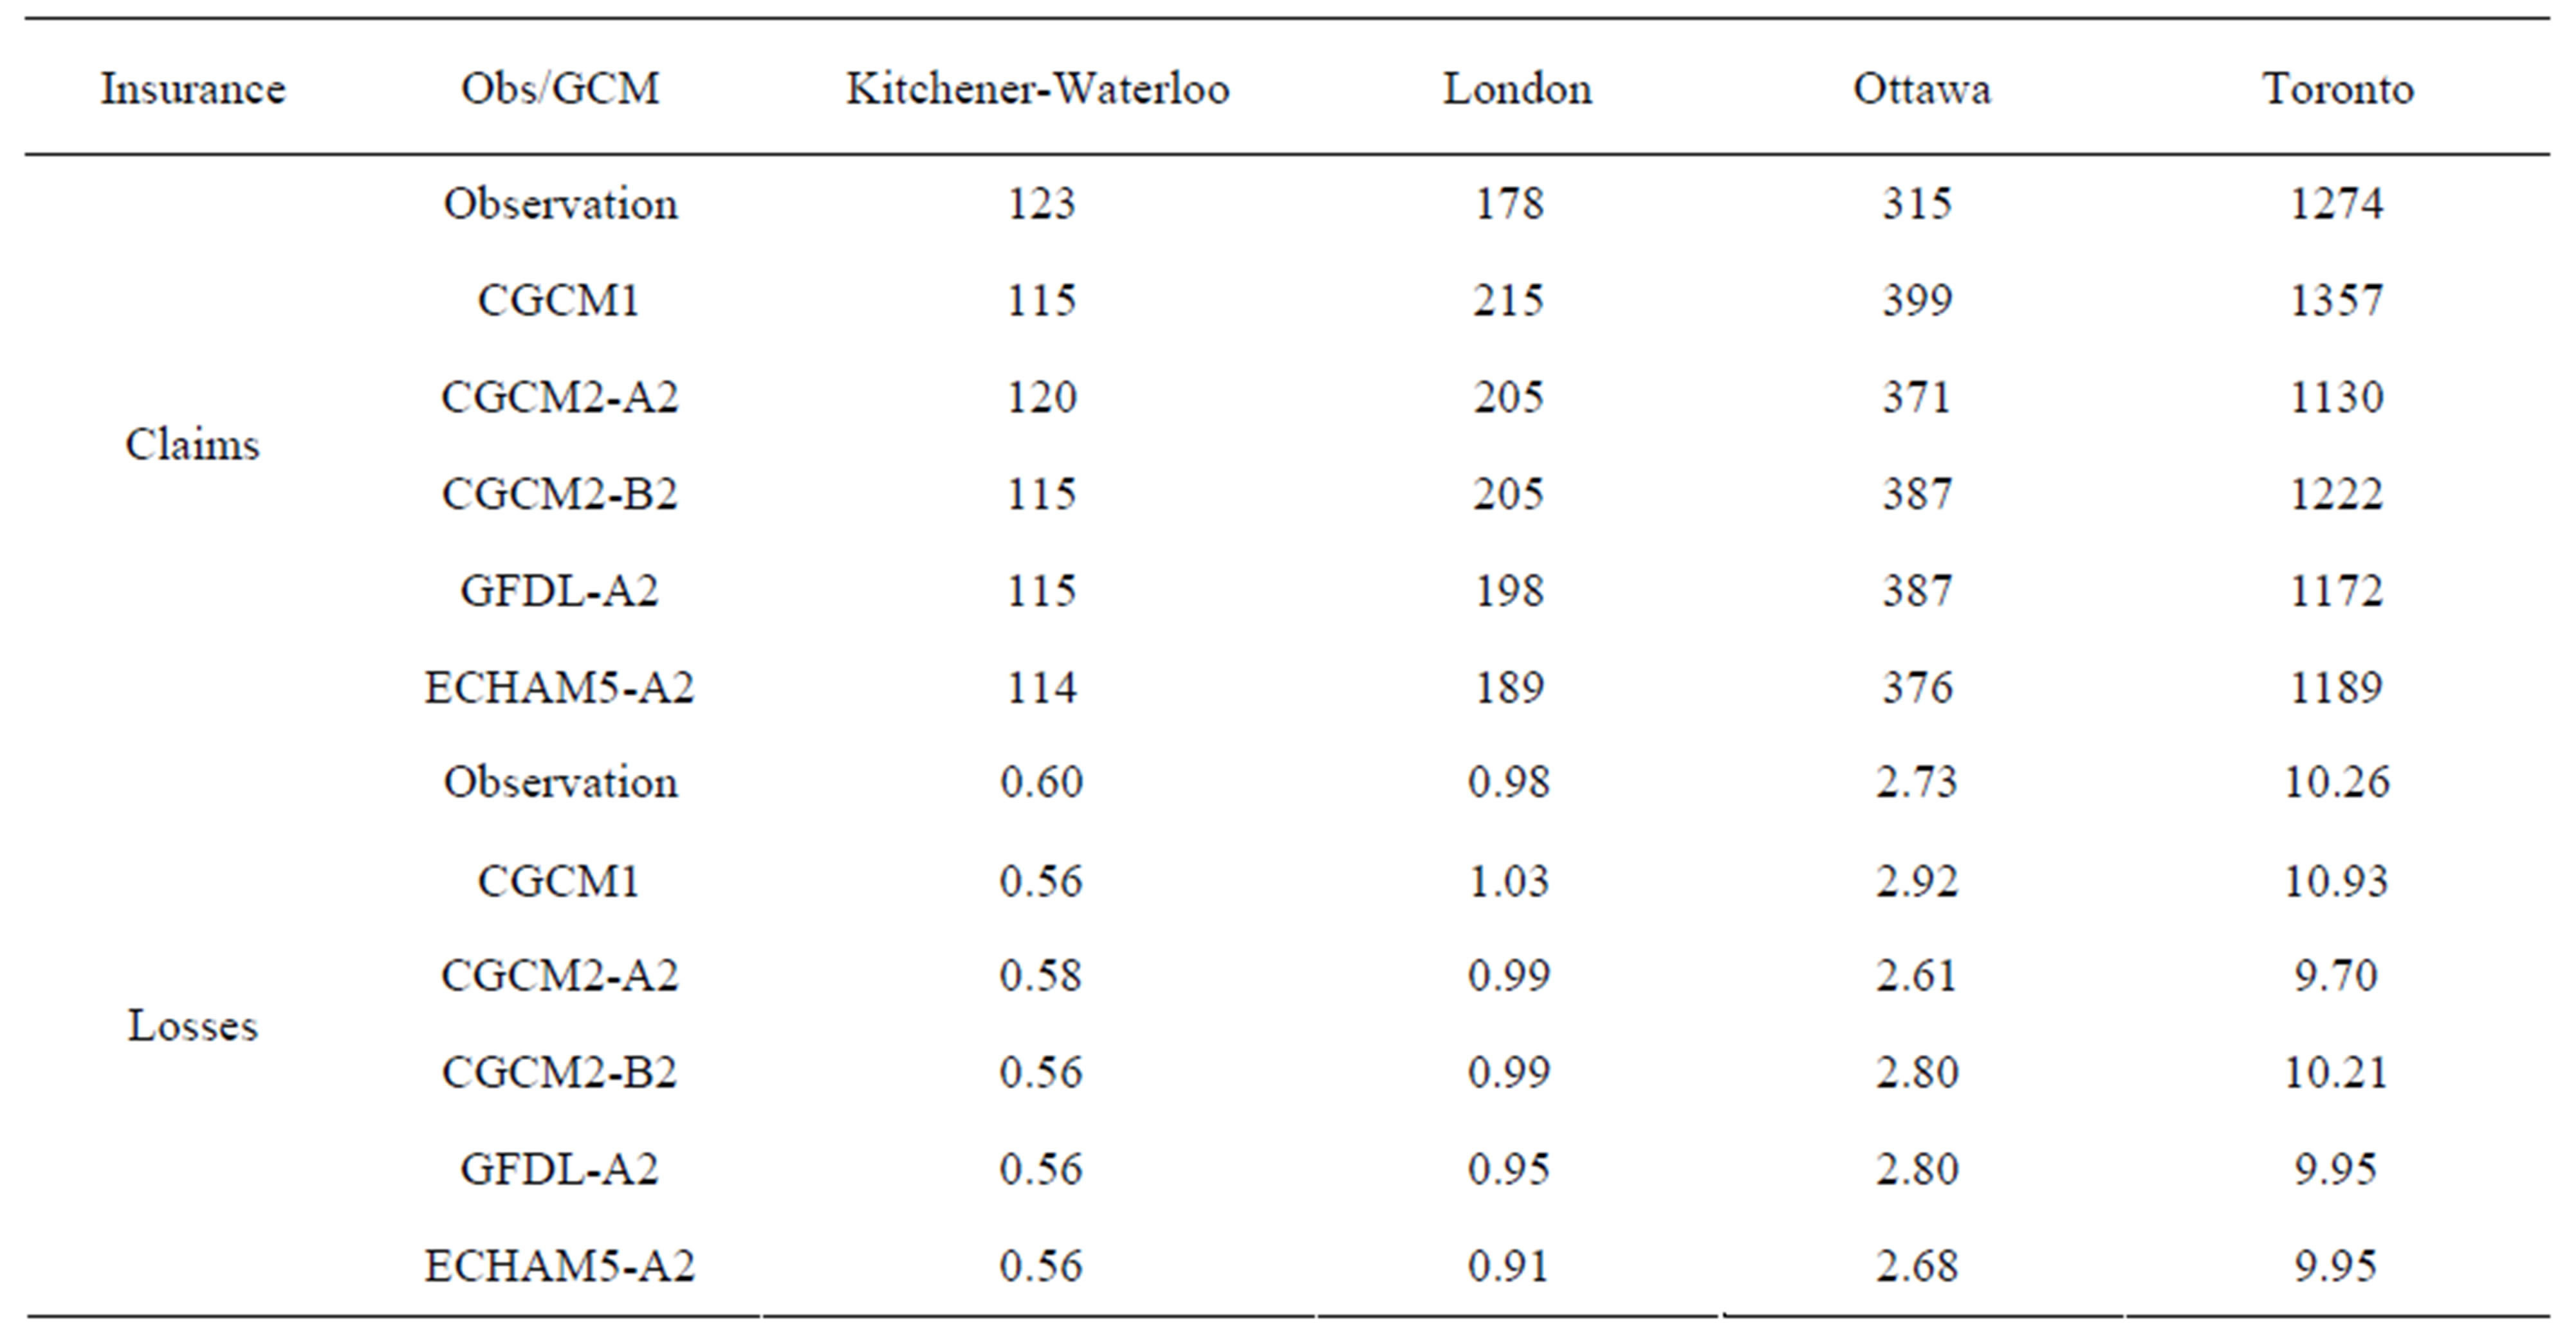
Table 2. The monthly mean number of rainfall-related water damage insurance claims and incurred losses ($ million) for the period April-September 1990-2000.

Figure 9. Percentage changes in the future monthly total number of water damage insurance claims (left) and total incurred losses (right) (three bars for three time periods, in order from left to right: 2016-2035, 2046-2065, and 2081-2100).
in Kitchener-Waterloo are much smaller than those in the other selected cities. The major reason for this is that hourly rainfall observations in Kitchener-Waterloo were not available, so that the relationship between the MRAT and the overall mean derived for the City of London was used for the City of Kitchener-Waterloo. Consequently, the difference in overall mean monthly number of claims/ incurred losses between months with monthly rainfall amount above and under the threshold (MRAT) in Kitchener-Waterloo is much smaller than it is for other cities (refer to Section 4.2 for details). As a result, other three cities, excluding Kitchener-Waterloo, were used to calculate the area mean percentage changes in future monthly total number of insurance claims and total incurred losses to represent an average condition for the study area, as described below.
The modeled results show that, averaged over the five GCM scenarios and three selected cities (excluding Kitchener-Waterloo), both the monthly total number of claims and total incurred losses could increase by about 13%, 20% and 30% for the periods 2016-2035, 2046- 2065, and 2081-2100, respectively from the four-city seasonal average of 12 ± 1.7 thousand claims and $88 ± $21 million during April-September 1992-2002. Within the context of this study, increases in the future number of claims and incurred losses in the study area are driven by only increases in future heavy rainfall events. In other words, these projections consider only changes in frequency and amount of future heavy rainfall events rather than other non-meteorological factors. The Nonmeteorological factors include population growth, socioeconomic changes, and changes in the location and value of assets, aging properties and infrastructure, land use changes and urbanization, and any substantial changes in government policy. Most of these non-meteorological factors could directly or indirectly alter the projections of future insurance claims and economic costs. Most of these influences would tend to increase potential insurance claims and incurred losses, as a result, it is likely that projections of increases in future rainfall-related water damage insurance claims and incurred losses offered by this study will represent the lower bound values for the study area. Therefore the Province of Ontario, Canada could in the future possibly receive more heavy rainfall-related water damage insurance claims and incurred losses than currently projected by the study.
6. Uncertainties and Limitations
6.1. Uncertainty of the Study
The uncertainty of climate change impacts on future heavy rainfall events described in a recent study [15] also applies to this paper since future daily rainfall quantities projected from the study were used in the current paper to project changes in future rainfall-related water damage insurance claims and incurred losses. As described in the study [15], the quality of the GCM climate change projections was much improved after using the statistical downscaling. However, conclusions made in the current study about the impacts of climate change on future rainfall-related flooding risks still relied on GCM scenarios and, as a result, there is corresponding uncertainty about the study findings. Inter-GCM and interscenario uncertainties of future daily rainfall projections were quantitatively assessed by Cheng et al. [15]. They concluded that the inter-GCM uncertainties are similar to the interscenario uncertainties; however, the uncertainties are generally much smaller than the projection of percentage increases in the frequency of future seasonal rain days and heavy rainfall events as well as future seasonal rainfall totals. The overall mean projected percentage increases are 2.2 - 3.7 times greater than overall mean inter-GCM and interscenario uncertainties.
Although the rainfall simulation models developed from the studies [14,15] can simulate most heavy rainfall events, it was found that the models have difficulty in capturing some localized convective rainfall events [14]. This model limitation had an effect on the changes in future rainfall-related sewer flood risks projected from the current study. It is likely that increases in future heavy rainfall-related water damage insurance claims and incurred losses offered by this study will represent the lower bound values for the study area. Therefore the Province of Ontario, Canada could in the future possibly receive more heavy rainfall-related water damage insurance claims and incurred losses than ones are currently projected by this study.
6.2. Limitations of the Data
Hourly rainfall data are essential to derive the relationship between rainfall and sewer flood insurance claims and water damage incurred losses. This relationship was used to project changes in future rainfall-related sewer flood risks. As there was a large percentage of missing hourly rainfall data at the Waterloo-Wellington Airport during the study period (refer to Section 4.2 for details), the relationship between heavy rainfall and insurance claims/incurred losses generated for the London located in Upper Thames River Basin was used for the Kitchener-Waterloo located in Grand River Basin. This could help to explain why the increases in the number of future heavy rainfall-related sewer/flood claims and water damage incurred losses in Kitchener-Waterloo are much smaller than those in the other selected cities.
In addition to limitation of hourly rainfall data, the limitation of other meteorological data, described in the study [15] for developing daily rainfall simulation models, also affect future projections of heavy rainfall-related water damage insurance claims and incurred losses. The major limitation of meteorological data includes that 24-hourly meteorological observations are not available in the Kitchener-Waterloo (Grand River Basin), which are essential to develop synoptic weather typing and within-weather-type daily rainfall simulation models. Consequently, hourly meteorological data gathered at the London International Airport (located in Upper Thames River Basin) were used to develop daily rainfall simulation models for the Grand River. Therefore, the rainfall simulation results, derived for the Grand River Basin, were not as accurate as they might be were 24-hourly meteorological data for the Grand River Basin available. In turn, these results could affect projections of frequency and magnitude of future heavy rainfall events and ultimately influence on projections of changes in future heavy rainfall-related water damage insurance claims and incurred losses derived from this study.
The insurance data, in terms of personal and comercial property sewer flood insurance claims and water damage incurred losses, were aggregated at the monthly level for April-September 1992-2002 at each of the selected cities (i.e., London, Ottawa, Toronto, KitchenerWaterloo). Due to the coarse temporal resolution of the monthly insurance data, the data are restricted in their usefulness for studying detailed information on heavy rainfall-related sewer flood insurance claims and water damage incurred losses. In turn, the changes in future heavy rainfall-related water damage insurance claims and incurred losses projected from the monthly-based dataset could possess a greater degree of uncertainty than those that might be was a daily-based dataset available. If the daily insurance data were available, more detailed relationships between daily/hourly rainfall intensity and daily insurance claims and water damage incurred losses could be possibly determined for local climate change impact analysis.
7. Conclusions and Future Work
The overall purpose of this study is to project possible changes in the heavy rainfall-related sewer flood insurance claims and water damage incurred losses in the 21st century for four selected river basins (i.e., Grand, Humber, Rideau, and Upper Thames) in the Province of Ontario, Canada. In the study, the simulation models of the heavy rainfall-induced insurance claims and water damage incurred losses were developed using observed datasets for the period April-September 1992-2002. In addition, the models were evaluated using downscaled GCM historical runs to ascertain whether the models are suitable for projecting the number of future rainfall-related water damage insurance claims and incurred losses. The results of the verification, based on historical observations of the outcome variables simulated by the models, showed a very good agreement. As a result, a general conclusion from this study is that the methodologies used in the study can be useful to project changes in future heavy rainfall-related flooding risks, in terms of water damage insurance claims and incurred losses.
As discussed previously, the changes in future heavy rainfall-related sewer flood risks projected from the monthly-based dataset could possess a greater degree of uncertainty than those projected from the daily-based dataset. More detailed relationships between daily water damage insurance claims/incurred losses and daily/ hourly rainfall intensity could be evaluated for local climate change impact analysis when daily insurance data were available. Additional research on insurance analysis, using daily insurance data, is needed to investigate what kinds of weather types could trigger a high number of rainfall-related sewer flood insurance claims and water damage incurred losses. In addition, future work on the analysis of rainfall-related sewer flood risks could be undertaken while working closely with municipalities, thus taking into account their needs concerning new and existing infrastructure standards. The information could then be used to help communities and individual homeowners mitigate heavy rainfall-related flooding risks.
This study has projected changes in the number of future heavy rainfall-related sewer flood insurance claims and water damage incurred losses. As discussed above, these projections considered only changes in future heavy rainfall frequency and intensity rather than other nonmeteorological factors. These factors include population growth, socio-economic changes, and the location and value of assets, aging properties and infrastructure, land use and urbanization, and any substantial changes in government policy. These factors could directly or indirectly influence on projections of changes in future water damage insurance claims and incurred losses. Additional research is needed to address the impacts of these nonmeteorological factors on socio-economic losses due to changing flood risks.
8. Acknowledgements
The authors gratefully acknowledge the funding support of the Government of Canada’s Climate Change Impacts and Adaptation Program (CCIAP), which made this research project (A901) possible. We also acknowledge the suggestions made by the Project Advisory Committee, which greatly improved the study.
REFERENCES
- PSEPC, “Canadian Disaster Database Version 4.4,” Public Safety and Emergency Preparedness Canada, 2006.
- G. R. Brooks, S. G. Evans and J. J. Clague, “Floods,” Geological Survey of Canada Bulletin 548—A Synthesis of Geological Hazards in Canada, 2001, pp. 101-143.
- K. Pal, “Assessing Community Vulnerability to Flood Hazard in Southern Ontario,” Canadian Water Resources Journal, Vol. 27, No. 2, 2002, pp. 155-173. doi:10.4296/cwrj2702155
- MNR, “Flood Damages in Ontario,” Technical Report, Ontario Ministry of Natural Resources, Apuskasing, 2004.
- IPCC, “Summary for Policymakers,” In: S. Solomon, D. Qin, M. Manning, Z. Chen, M. Marquis, K. B. Averyt, M. Tignor and H. L. Miller, Eds., Climate Change 2007: The Physical Science Basis. Contribution of Working Group I to the 4th Assessment Report of the Intergovernmental Panel on Climate Change, Cambridge University Press, Cambridge, 2007.
- IPCC, “Climate Change 2001: Impacts, Adaptation, and Vulnerability,” Cambridge University Press, Cambridge, 2001.
- D. I. Smith, “Greenhouse Climatic Change and Flood Damages—The Implications,” Climate Change, Vol. 25, 1993, pp. 319-333. doi:10.1007/BF01098379
- E. C. Penning-Rowsell, J. Handmer and S. Tapsell, “Extreme Events and Climate Change: Floods,” In: T. E. Downing, A. A. Olsthoorn and R. S. J. Tol, Eds., Climate change and Extreme Events: Altered Risk, Socio-Economic Impacts and Policy Responses, Vrije Universiteit, Amsterdam, 1996, pp. 97-127.
- D. I. Smith, “Urban Flood Damage and Greenhouse Scenarios—The Implementation for Policy: An Example from Australia,” Mitigation and Adaptation Strategies for Global Change, Vol. 4, No. 3-4, 1999, pp. 331-342. doi:10.1023/A:1009623925591
- J. W. Hall, E. P. Evans, E. C. Penning-Rowsell, P. B. Sayers, C. R. Thorne and A. J. Saul, “Quantified Scenarios Analysis of Drivers and Impacts of Changing Flood Risk in England and Wales: 2030-2100,” Global Environmental Change Part B: Environmental Hazards, Vol. 5, No. 3-4, 2003, pp. 51-65. doi:10.1016/j.hazards.2004.04.002
- Environment Canada, “Flooding Events in Canada—Ontario: Hurricane Hazel,” 2000. http://www.ec.gc.ca/water/en/manage/floodgen/e_ont.htm#hazel
- Environment Canada, “Remembering Hurricane Hazel 1954—50th Anniversary,” 2004. http://www.atl.ec.gc.ca/weather/hurricane/hazel/en/index.html
- J. Klaassen and M. Seifert, “Extreme Rainfall in Ontario: The Summer 2004 Storms Study,” Environment Canada, 2006.
- C. S. Cheng, G. Li, Q. Li and H. Auld, “A Synoptic Weather Typing Approach to Simulate Daily Rainfall and Extremes in Ontario, Canada: Potential for Climate Change Projections,” Journal of Applied Meteorology and Climatology, Vol. 49, No. 5, 2010, pp. 845-866. doi:10.1175/2010JAMC2016.1
- C. S. Cheng, G. Li, Q. Li and H. Auld, “A Synoptic Weather-Typing Approach to Project Future Daily Rainfall and Extremes at Local Scale in Ontario, Canada,” Journal of Climate, Vol. 24, No. 14, 2011, pp. 3667-3685. doi:10.1175/2011JCLI3764.1
- C. S. Cheng, G. Li, Q. Li and H. Auld, “Statistical Downscaling of Hourly and Daily Climate Scenarios for Various Meteorological Variables in South-Central Canada,” Theoretical and Applied Climatology, Vol. 91, No. 1-4, 2008, pp. 129-147. doi:10.1007/s00704-007-0302-8
- Bank of Canada, “Inflation Calculator,” 2006. http://www.bankofcanada.ca/en/rates/inflation_calc.html
- Environment Canada, “DATA,” 2006. http://www.cccma.bc.ec.gc.ca/data/data.shtml
- PCMDI, “WCRP CMIP3 Multi-Model Dataset,” 2006. http://www-pcmdi.llnl.gov/ipcc/about_ipcc.php
- J. G. Galway, “The Lifted Index as a Predictor of Latent Instability,” Bulletin of the American Meteorological Society, Vol. 37, 1956, pp. 528-529.
- J. J. George, “Weather Forecasting for Aeronautics,” Academic Press, London, 1960.
- R. C. Miller, “Notes on Analysis and Severe Storm Forecasting Procedures of the Air Force Global Weather Central,” Technical Report 200(R), Headquarters, Air Weather Service, USAF, 1972.
NOTES
*Corresponding author.