Journal of Water Resource and Protection
Vol. 3 No. 12 (2011) , Article ID: 16396 , 11 pages DOI:10.4236/jwarp.2011.312094
Assessment of Aquifer Vulnerability Based on GIS and ARCGIS Methods: A Case Study of the Sana’a Basin (Yemen)
Lab. Geosciences of Natural Resources, Hydroinformatic Section, Faculty of Sciences, Ibn Tofail University, Kénitram, Morocco
E-mail: alwathaf7@hotmail.com
Received September 29, 2011; revised October 31, 2011; accepted November 29, 2011
Keywords: Groundwater, Vulnerability, DRASTIC, GIS, Sana’a Basin
ABSTRACT
Groundwater is the main source of water in arid and semi-arid regions. Therefore, pollution of groundwater is a major issue because aquifers and the contained groundwater are inherently susceptible to contamination from wastewater and agricultural activities. Aquifer vulnerability has been assessed in the Sana’a basin using the DRASTIC method, based on a Geographic Information System (GIS). The DRASTIC model uses seven environmental parameters (Depth to water, net Recharge, Aquifer media, Soil media, Topography, Impact of vadose zone, and hydraulic Conductivity) to characterize the hydrogeological setting and evaluate aquifer vulnerability. A regional scale aquifer vulnerability map of the basin was prepared using overlay analysis with the aid of GIS. A DRASTIC vulnerability map, verified by data of nitrate in groundwater, shows that the defined areas are compatible with land-use data. It is concluded that 6.4% of the basin area is highly vulnerable and urgent pollution-preventions measures should be taken for every kind of relevant activity within the whole basin.
1. Introduction
Nowadays, groundwater resources play an important role in meeting demands on water supply because of regional climate change and scanty surface water source or their unsuitability. Pollution of groundwater is a major issue because aquifers and the contained groundwater are inherently susceptible to contamination from land use and other anthropogenic impacts [1]. There are several types of pollution that appear to predominate in groundwater such as heavy metals, nutrients, pesticides and other organic chemicals, and fertilizers. Leaching of various pollutants through the unsaturated zone and groundwater zone gives rise to contamination in these zones. These processes vary from one location to another.
The concept of groundwater vulnerability to contamination was introduced in the 1960s in France by [2]. Then, there were several approaches for developing aquifer vulnerability assessment maps such as DRASTIC [3], GOD [4], AVI [5], and SINTACS [6]. A thorough overview of existing methods is given in [7] and in [8]. These methods have been mainly applied to groundwater protection in porous aquifers, except the EPIK [9,10], PI [11], and COP [12] methods which are specifically developed for the assessment of vulnerability in karstic areas.
Conventional methods (i.e. DRASTIC, AVI, GOD, SINTACS) are able to distinguish degrees of vulnerability at regional scales where different lithologies exist [13]. The DRASTIC method is a familiar method developed in the US Environment Protection Agency (USEPA) by [3] and this method has been applied in several regions by different researches [14-21]. Some of the researches modified the DRASTIC method and added different parameters [22-25] such as land use index, lineament, aquifer thickness, and impact of contaminant. Thirumalaivasan et al. (2003) [1] developed a software package AHP-DRASTIC to derive ratings and weights of modified DRASTIC model parameters.
The DRASTIC method assumes that: 1) any contaminant is introduced at the ground surface; 2) the contaminant is flushed into the groundwater by precipitation; 3) the contaminant has the mobility of water; 4) the areas evaluated using 0.4 km2 or larger [26]. The DRASTIC system is composed of two major parts: 1) the designation of map able units, termed hydrogeological setting; and 2) the application of a numerical scheme of relative ranking of hydrogeological factors [23]. Hydrogeological factors help to evaluate the relative groundwater pollution potential of any hydrogeological setting. Hydrogeological setting is a composite description of all the geological and hydrogeological factors controlling groundwater flow into through, and out of an area [16].
Recently, Geographic Information System (GIS) techniques have been widely used in aquifer vulnerability mapping [27-31]. The major advantage of GIS-based mapping is the combination of data layers and rapid change in the data parameters used in vulnerability classification [25].
Groundwater represents main resource for supply in Sana’a, capita city of Yemen (Figure 1). The need for protection and management of Sana’a basin has been recognized. Agricultural pesticides and wastewater are the main causes of the degradation of groundwater quality in the study area. The main aim of this study is to evaluate the aquifer vulnerability in the basin and determine the degree of contamination of Sana’a basin using the DRASTIC model based on GIS. According to vulnerability, a map showing high to low vulnerability areas was produced for the basin.
2. Study Area
Sana’a basin is an inter-mountain plain located in the central Yemen Highlands. The plain has an elevation of about 2200 m a.s.l, but is surrounded to the West, South and East by mountains rising to more than 3000 m a.s.l. The basin has an area of about 3200 km2 and forms the upper part of the catchment of Wadi al Kharid, a subcatchment of the Wadi al Jawf (Figure 1). The climate is semi-arid with an average annual rainfall of 235 mm at Sana’a [32].
The increase of concentration of nitrate in this area because of effluent from a wastewater treatment plant, link the problem of pollution treatment plant for the following reasons:
1) Designed to carry the station Biology of 500 mg/l while the pregnancy in the waste water supplied to the station 1300 mg/l and hold it unable to address the quantity supplied to the plant, estimated to be 36,000 m3/day, although run the plant at full capacity hydraulic.
2) The station of the type-based biological treatment of the bacteria and when you reach the large quantities of oil discharged in the network failure treatment system to require re-ripening bacteria to about two months Therefore, when the advent of wastewater laden with oils is closed the plant they come out without any treatment.
3) Citizens in the region do not cooperate with the competent authorities, and they oppose any action by the government to get rid of this water because they benefit from it to irrigate their crops.
3. Geology and Hydrogeology
The stratigraphic sequence outcropping or present in the subsurface in the larger Sana’a basin ranges from Jurassic to Quaternary [33], the stratigraphic sequence can be divided in three major groups: Mesozoic and Paleocene sedimentary formations, Tertiary trap volcanic series and Quaternary sedimentary (Figure 2).
Amran Group (Middle to Upper Jurassic): Amran Group (Middle to Upper Jurassic) comprises limestone, marls and shally limestone. It covers 15% of the outcrops in the North of the basin (Figure 2), thickness of Amran Group ranging from 350 to 1000 m [34]. The Amran limestone is generally considered to be a poor aquifer although supplies can be obtained from zones of secondary permeability.
Tawilah Group (Cretaceous to Tertiary): Comprises a series of continental cross-bedded sandstones generally medium to coarse grained with interbedded mudstones, siltstones and occasional silty-sandstones. The Cretaceous Sandstones crop out over about 15% of the basin area in the northern part of the Basin. It is thought to reach a thickness of 400 to 850 m. The Cretaceous sandstone forms the main aquifer in the region. It has low regional permeability but locally higher permeability is found in weathered and fractured zones. It is heavily exploited to the Northeast and Northwest of Sana’a where it either outcrops or occurs beneath up to 50 m of unconsolidated cover. The sandstone is confined under several hundreds meters of Tertiary volcanics in the south of the basin.
Tertiary volcanics: Formerly called the Trap Series, these rocks outcrop over some 35% the Sana’a basin area. They form high plateaus to the South, West and East of the Sana’a plain and underlie the Quaternary deposits in the South of the basin. The sequence is divided into two groups. The lowest group is the “Stratoid volcanics” which include the basalt (a dense homogenous basalt flow with columnar jointing), basalts, tuffs and pyroclastics interbedded with fluvio-lacustrine deposits. The upper “Chaotic volcanics” comprise mixed basalt flows and rhyolite lavas. The total thickness is variable; reaching an estimated ness of groundwater contamination [7]. It can be defined as the possibility of percolation and diffusion of contaminants from the ground surface into the groundwater system. Vulnerability is usually considered as an “intrinsic”

Figure 1. Location and topographic map of the study area (DEM from a satellite dataset).
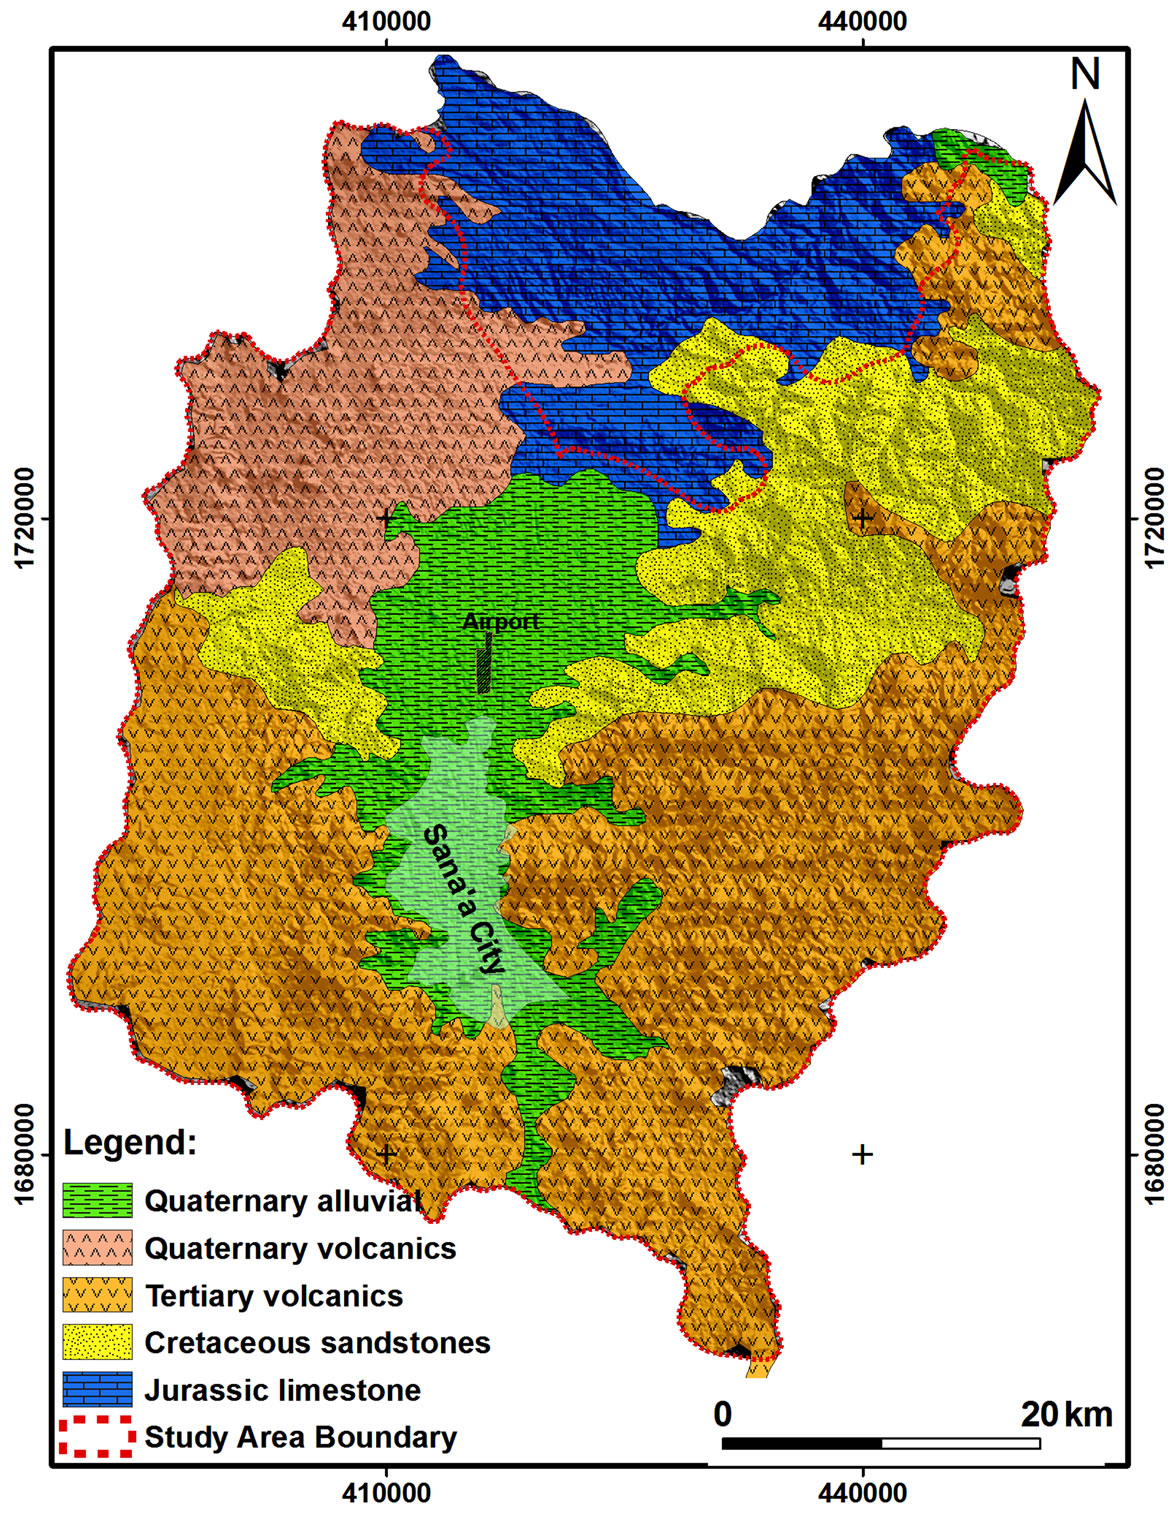
Figure 2. Geological map of the Sana’a basin.
maximum of 600 m to 800 m. The basalt flows and stratoid sequences of the Tertiary volcanics acts as aquicludes, except where fractured or where primary permeability occurs in sediments between flows. The mixed basalt and rhyolite flows at the top of the sequence are more highly fractured and contain perched aquifers which supply dug wells and feed high level springs.
Quaternary Volcanics: Volcanic activity continued into the Quaternary forming a plateau of extensive basalt cones in the North West of the basin interlayered with tuffs and alluvial sediments. The Quaternary basalts have a total thickness of about 100 m to 300 m and cover about 20% of the area of the basin. The Quaternary basalts are highly permeable due to fracturing and to the presence of clastic deposits between flows. Where the formation is saturated it provides an unconfined aquifer.
Quaternary Alluvial: Unconsolidated sediments (mainly alluvial) cover about 15% of the basin area. They are confined to wadi beds and low areas that form the Sana’a plain. Deposition appears to have been of fluvio-lacustrine nature, which led to the accumulation of clays and silts in basins 100 m to 300 m deep. Coarse-grained colluvium and alluvium occurs in the wadi beds at the foot of hills. The unconsolidated Quaternary deposits provide a poorly permeable aquifer, which has been heavily exploited in the Sana’a basin due to its proximity to the urban area [35].
4. Method
4.1. Description of the DRASTIC Method
The concept of groundwater vulnerability was first introduced in France by the end of the 1960s to create awareproperty of a groundwater system that depends on its sensitivity to human and/or natural impacts. “Specific” or “integrated” vulnerability, on the other hand, combines intrinsic vulnerability with the risk of the groundwater being exposed to the loading of pollutants from certain sources [7].
A DRASTIC model applied in a GIS environment was used to evaluate the vulnerability of the Sana’a basin. It was based on the concept of the hydro-geological setting that is defined as “a composite description of all the major geologic and hydrologic factors that affect and control the groundwater movement into, through and out of an area” [3]. The acronym DRASTIC stands for the seven parameters used in the model which are: Depth to water, net Recharge, Aquifer media, Soil media, Topography, Impact of vadose zone and hydraulic Conductivity (Figure 3). The model yields a numerical index that is derived from ratings and weights assigned to the seven model parameters. The significant media types or classes of each parameter represent the ranges, which are rated from 1 to 10 based on their relative effect on the aquifer vulnerability. The seven parameters are then assigned weights ranging from 1 to 5 reflecting their relative importance (Table 1). The DRASTIC Index is then computed applying a linear combination of all factors according to the following equation:


where D, R, A, S, T, I, and C are the seven parameters and the subscripts r and w are the corresponding rating and weights, respectively. This model was selected based on the following considerations. DRASTIC uses a relatively large number of parameters (seven parameters) to compute the vulnerability index, which ensures the best representation of the hydrogeological setting. The numerical ratings and weights, which were established using the Delphi technique [3], are well defined and are used worldwide. This makes the model suitable for producing comparable vulnerability maps on a regional scale. The necessary information needed to build up the several model parameters was available in the study area or could easily be inferred. Data analyses and model implementation were performed using the GIS software.

Figure 3. Methodology flowchart for DRASTIC method.
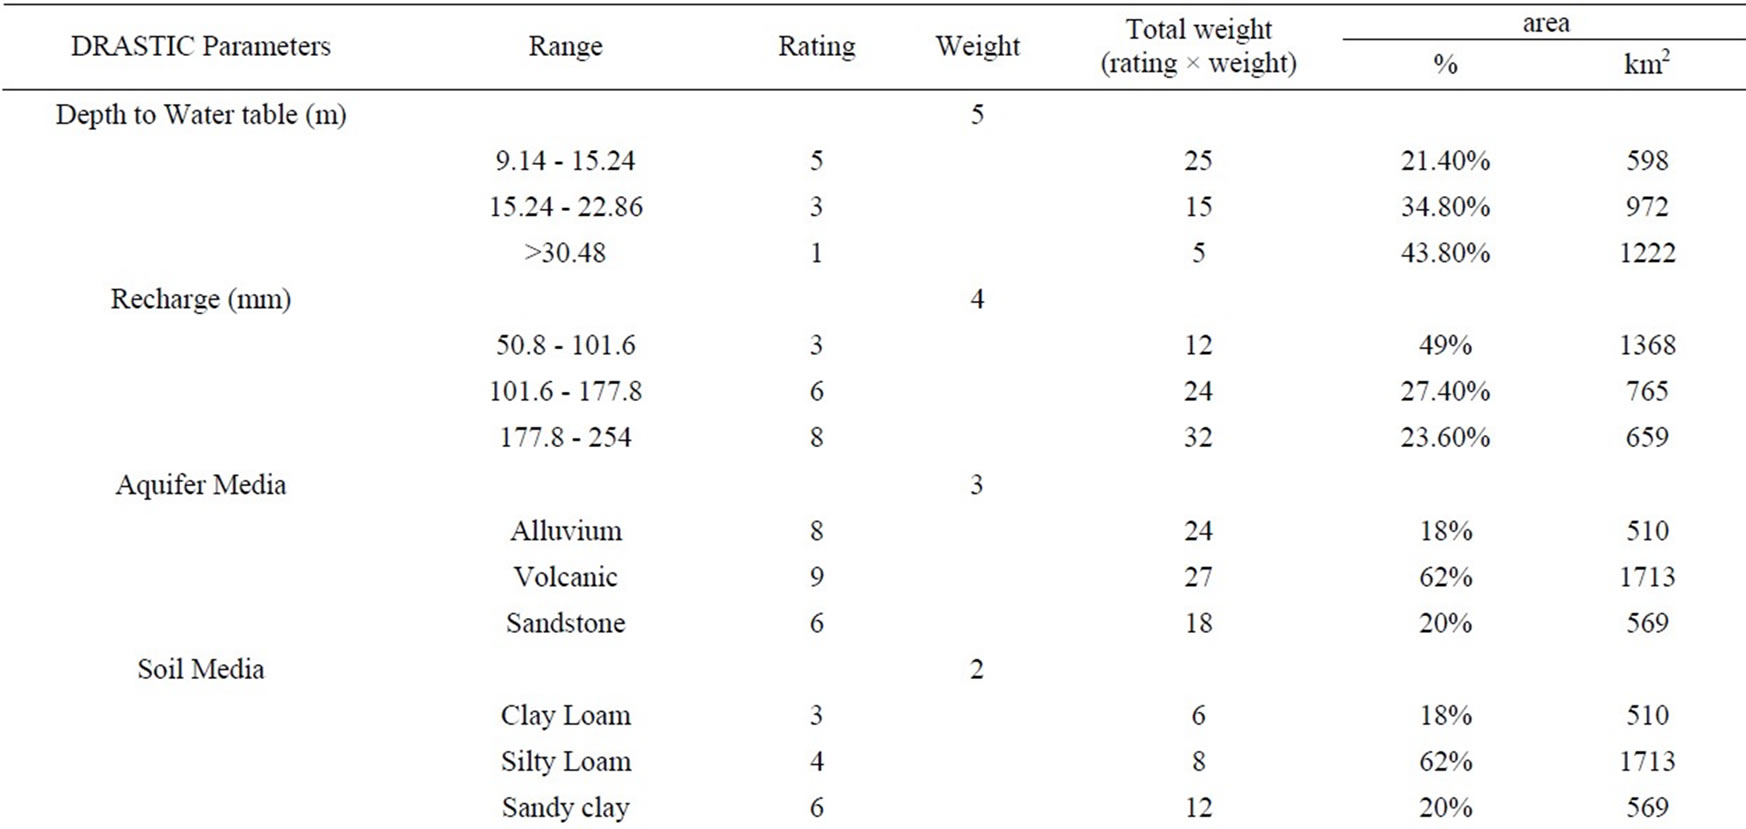

Table 1. DRASTIC rating and weighting values for the various hydrogeological parameter settings [3,18].
4.2. Preparation of the Aquifer Vulnerability Map (DRASTIC)
Input data used for assessment of aquifer vulnerability in the study area were obtained from pervious investigations. The seven maps using vulnerability assessment of the Sana’a basin with DRASTIC method were prepared using hydrogeological data based on GIS-ArcView. Each parameter of the DRASTIC method is explained in the following.
Depth to Water table (D): The depth to water is the distance from the ground surface to the water table. It determines the depth of material through which a contaminant must travel before reaching the aquifer. Thus, the shallower the water depth, the more vulnerable the aquifer is to pollution.
The grid layers for depth to water were generated by computer subtraction of water-level elevation data sets from land surface elevation. Land surface elevations were derived from a digital elevation model (DEM) for Sana’a basin from 1:50,000-scale maps [36]. The waterlevel elevation data sets were developed from groundwater level map [37]. Depth to water ranged from 15 to 30 m in middle and north-east of aquifer and more than 30 m in rest of aquifer.
Net Recharge (R): The primary source of recharge is precipitation and runoff in wadi beds, which infiltrates through the ground surface and percolates to the water table. Net recharge is the total quantity of water per unit area, in millimeters per year, which reaches the water table. Recharge is the principal vehicle for leaching and transporting contaminants to the water table. The more recharge, the greater chance for contaminants to reach the water table.
Recharge in the 22 sub-basins of Sana’a basin was derived from two components: direct recharge from rainfall, and wadi bed recharge. Results indicated that recharge from direct rainfall is a rare phenomenon occurring only during intensive rainfalls where the soil field capacity is exceeded by the amount of water percolating. The mean annual value of direct recharge from rainfall is only 8%, while the major recharge to the Sana’a basin estimated at 92% occurs from surface runoff in wadi beds [38].
Aquifer Media (A): Aquifer media refers to the consolidated or unconsolidated rock that serves as an aquifer. The larger grain size and the more fractures or openings within the aquifer, higher the permeability, and thus vulnerability, of the aquifer. In unconsolidated aquifers, the rating is based on the sorting and amount of fine material within the aquifer. In consolidated aquifers, the rating is based on the amount of primary porosity and secondary porosity along fractures and bedding planes. Information on aquifer media was obtained from the aquifer studies and the geologic map of Sana’a basin.
Soil Media (S): Soil media is the upper weathered zone of the earth, which averages a depth of six feet or less from the ground surface. Soil has a significant impact on the amount of recharge that can infiltrate into the ground. In general, the less the clay shrinks and swells and the smaller the grain size of the soil, the less likely contaminants will reach the water table. Soils in this study area varied greatly from clay to sand.
Topography (T): Topography refers to the slope of the land surface. Topography helps control the likelihood that a pollutant will run off or remain long enough to infiltrate through the ground surface. Where slopes are low, there is little runoff, and the potential for pollution is greater. Conversely, where slopes are steep, runoff capacity is high and the potential for pollution to groundwater is lower. We used a digital elevation model (DEM) to calculate percent slopes. Most of the slopes in this study were in the ranges of 0% - 2% to >18%.
Impact of the Vadose Zone Media (I): The vadose zone is the unsaturated zone above the water table. The texture of the vadose zone determines the time of travel of the contaminant through it. In surficial aquifers, the ratings for the vadose zone are generally the same as the aquifer media. Sometimes a lower rating is assigned if the aquifer media is overlain by a less permeable layer such as clay. As in the aquifer media (A) factor, this information was obtained from the aquifer studies and the geologic map of Sana’a basin. The grid layers for vadose zone media consist of clay, sandstone, and basalt.
Hydraulic Conductivity of the Aquifer (C): Hydraulic conductivity refers to the rate at which water flows horizontally through an aquifer. The higher conductivity, more vulnerable the aquifer, Conductivity values for the aquifers were usually derived from groundwater flow models and represent averages over large areas. Volcanic rocks in East and West in this study have hydraulic conductivity values in the range of 1.15e–7 to 1.50e–5 m/s. The alluvium in middle basin has higher hydraulic conductivity values, ranging from 4.51e–5 to 9.95e–5 m/s.
5. Results and Discussion
To assess groundwater vulnerability to contamination, several attribute layers were assembled as intermediate steps. Attribute layers include hydrogeological setting (recharge/discharge areas), hydraulic conductivity of soil, and depth to water table. Data from these attribute layers were used to produce vulnerability map using ArcGIS. All maps were converted to raster format with 200 m pixel size. Using equation 1, all layers multiplied by their factors. The drastic index was calculated by adding the resulted layers (Figure 4). The map shows the potential and sensitivity of the aquifer for contamination. The resulted index classified into five classes varying from very low to very high. Table 2 shows the ranges in each class and the percentage of area covered by that class. The DRASTIC aquifer vulnerability map clearly shows the dominance of ‘High’ vulnerability classes (shades of red) in the North and Northwest part of Sana’a basin, this is due depth to water is small and in addition to the presence of limestone and alluvial rocks, all of which help to increase the infiltration water into the aquifer as well as increase agricultural activity and location of wastewater disposal in this region which helps to groundwater pollution, the elevated middle part of the study area displays “Low” vulnerability class (shades of blue). This is due to the combination of deep water table, less-porous vadose and aquifer media due presence of basalt rocks.
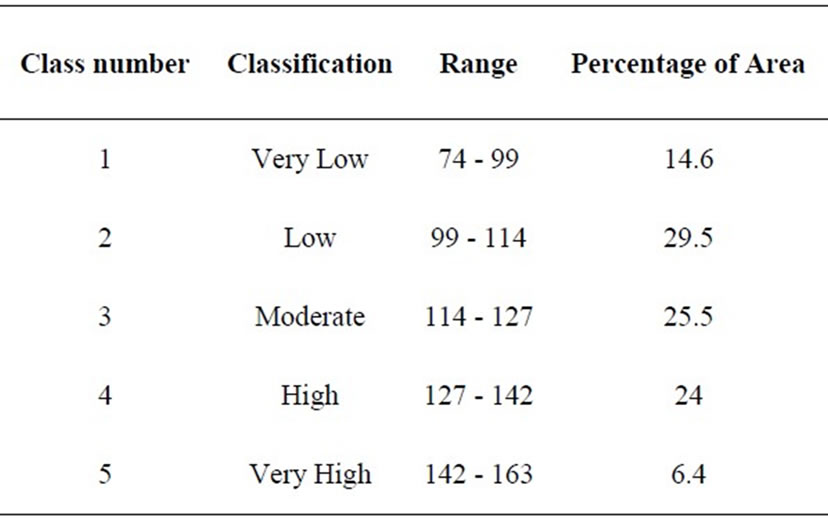
Table 2. Range of class and percentage of covered area by each class.

Figure 4. Vulnerability map of Sana’a basin.
6. DRASTIC Index Validation
The nitrate concentration in groundwater in north of Sana’a basin near the wastewater treatment plant was more than 150 mg/l during September 2004. The maximum acceptable nitrate concentration for human health is 50 mg/l and 45 mg/l according to the World Health Organization [39]. However, if nitrate concentration is higher than 10 mg/l in groundwater, it indicates anthropogenic contamination.
The spatial distribution of nitrate concentration in the groundwater was created using the IDW interpolation methods of ArcGIS spatial analyst (Figure 5). Nitrate was measured in 19 wells during April 2004. Based on these analyses, it is concluded that the areas having high nitrate concentration can be correlated with DRASTIC out-put.
Figure 4 shows that low sensitivity areas are outside of the agricultural areas. Nitrate concentration increases about the wastewater disposal location in north of Sana’a basin near Airport. This area is a highly vulnerable area due to increase of nitrate in groundwater due wastewater discharge towards the aquifer.
7. Conclusions
This study was performed using a GIS model and the DRASTIC method to determine the vulnerability of groundwater in the Sana’a basin. Seven parameter maps were prepared in a GIS environment and the vulnerability

Figure 5. Spatial distributions of nitrate concentration in groundwater in 2004.
classification of the basin was performed using GIS technique. The DRASTIC Vulnerability Index was computed as between 74 and 163. Based on hydrogeological field investigation and using a quantile classification method, these values were reclassified into five classes. The vulnerability map obtained from the DRASTIC method gives location which must have high priority in terms of protection and pollution prevention. DRASTIC method results are useful in the design of aquifer protection and management strategies. This scenario provides an important benefit in relation to time and economy for local authorities involved in managing groundwater resource. Although the whole alluvium is used as an agricultural area in Sana’a basin, highly vulnerable areas constitute only 6.4% of the basin is located in north of basin. Nitrate concentration of groundwater was evaluated for validation of the DRASTIC results. These evaluations show that high nitrate concentration corresponds to possible nitrate enrichment in the highly vulnerable aquifer medium, the low sensitivity areas are outside of the agriculture areas in basin. Nitrate concentrations gradually increase towards the wastewater disposal location, and high nitrate contamination is observed in the locations where wastewater discharges to aquifer. This indicates that the obtained results are realistic and representative to the actual situation in the field. Therefore, the DRASTIC method is applicable in the basin. If wastewater sewage continues for a long time, nitrate contamination will increase step by step in the basin.
The following recommendations may be taken into account to relieve the water pollution resulting from sewage:
1) Short term: the establishment of additional drying basins of the station and Create a channel discharge alternative plastic pipes sizes and diameters suitable for the delivery of outputs of the station to the desert.
2) Medium term: raising the efficiency of the station and expanded.
3) The long term: established a new treatment plants outside the basin.
REFERENCES
- D. Thirumalaivasan, M. Karmegam and K. Venugopal, “AHP-DRASTIC: Software for Specific Aquifer Vulnerability Assessment Using DRASTIC Model and GIS,” Environmental Model & Software, Vol. 18, No. 7, 2003, pp. 645-656. doi:10.1016/S1364-8152(03)00051-3
- J. Margat, “Groundwater Vulnerability to Contamination,” Bases de la Cartographie, Doc. 68 SGC 198 HYD, BRGM, Orleans, 1968.
- L. Aller, T. Bennet, J. H. Leher, R. J. Petty anf G. Hackett, “DRASTIC: A Standardized System For Evaluating Ground Water Pollution Potential Using Hydrogeological Settings,” EPA 600/2-87-035, 1987, p. 622.
- S. Foster, “Fundamental Concept in Aquifer Vulnerability, Pollution Risk and Protection Strategy,” In: W. Van Duijvenbooden and H. G. Van Waegeningh, Eds., Vulnerability of Soil and Groundwater to Pollutions. Committee on Hydrogeological Research, Hague, 1987, pp. 69-86.
- D. Van Stempvoort, L. Ewert and L. Wassenaar, “Aquifer Vulnerability Index (AVI): A GIS Compatible Method for Groundwater Vulnerability Mapping,” Canadian Water Resource Journal, Vol. 18, No. 1, 1993, pp. 25-37. doi:10.4296/cwrj1801025
- M. Civita “Contamination Vulnerability Mapping of the Aquifer: Theory and Practice,” Quaderni di Tecniche di Protezione Ambientale, Pitagora, 1994.
- J. Vrba and A. Zoporozec “Guidebook on Mapping Groundwater Vulnerability,” IAH International Contribution for Hydrogeology, Hannover 7 Heise, Vol. 16, 1994. p. 131.
- R. Gogu and A. Dassargues, “Current Trends and Future Challenges in Groundwater Vulnerability Assessment Using Overly and Index Methods,” Environmental Geology, Vol. 36, No. 6, 2000, pp. 549-559. doi:10.1007/s002540050466
- N. Doerfliger, P. Y. Jeannin and F. Zwahlen, “Water Vulnerability Assessment in Karstic Environment: A New Method of Defining Protection Areas Using a Multi-Attribute Approach and GIS Tools (EPIK Method),” Environmental Geology, Vol. 39, No. 2, 1999, pp. 165-176. doi:10.1007/s002540050446
- N. Doerfliger and F. Zwahlem “Groundwater Vulnerability Mapping in Karstic Regions (EPIK): Application to Groundwater Protection Zones,” Swiss Agency for the Environment, Forests and Landscape (SAEFL), Bern, 1998.
- N. Goldscheider, M. Klute, S. Sturm and H. Hotezl, “The PI Method: A GIS-Based Approach to Mapping Groundwater Vulnerability with Special Consideration of Karst Aquifers,” Zeitschrift für Angewandte Geollgie, Vol. 46, No. 3, 2000, pp. 157-166
- J. M. Vias, B. Andreo, M. J. Perles, F. Carrasco, I. Vadillo and P. Jimenez, “Proposed Method for Groundwater Vulnerability Mapping in Carbonate (Karstic) Aquifers: The COP Method. Application in Two Pilot Sites in Southern Spain,” Hydrogeology Journal, Vol. 14, No. 6, 2006, pp. 912-925.
- J. M. Vias, B. Andreo, M. J. Perles and F. Carrasco, “A Comparative Study of Four Schemes for Groundwater Vulnerability Mapping in a Diffuse Flow Carbonate Aquifer under Mediterranean Climatic Condition,” Environmental Geology, Vol. 47, No. 4, 2005, pp. 586-595. doi:10.1007/s00254-004-1185-y
- J. W. Merchant, “GIS-Based Groundwater Pollution Hazard Assessment: A Critical Review of the DRASTIC Model,” Photogrammetric Engineering & Remote Sensing, Vol. 60, No. 9, 1994, pp. 1117-1127.
- A. J. Melloul and M. Collin, “A Proposed Index for Aquifer Water Quality Assessment: The Case of Isreal’s Sharon Region,” Journal of Environmental Management, Vol. 54, No. 2, 1998, pp. 131-142. doi:10.1006/jema.1998.0219
- Y. Kim and S. Hamm, “Assessment of Potential for Groundwater Contamination Using the DRASTIC/EGIS Technique, Cheongju Area, South Korea,” Hydrogeology Journal, Vol. 7, No. 2, 1999, pp. 227-235. doi:10.1007/s100400050195
- E. Cameron and G. F. Peloso, “An Application of Fuzzy Logic to the Assessment of Aquifers’ Pollution Potential,” Environmental Geology, Vol. 40, No. 11-12, 2001, pp. 1305-1315.
- T. Al-Zabet, “Evaluation of Aquifer Vulnerability to Contamination Potential Using the DRASTIC Method,” Environmental Geology, Vol. 43, No. 1-2, 2002, pp. 203-208. doi:10.1007/s00254-002-0645-5
- R. A. N. Al-Adamat, I. D. L. Foster and S. M. J. Baban, “Groundwater Vulnerability and Risk Mapping for the Basaltic Aquifer of the Azraq Basin of Jordan Using GIS, Remote Sensing and DRASTIC,” Applied Geography, Vol. 23, No. 4, 2003, pp. 303-324. doi:10.1016/j.apgeog.2003.08.007
- H. Baalousha, “Vulnerability Assessment for the Gaza Strip Palestine Using DRASTIC,” Environmental Geology, Vol. 50, No. 3, 2006, pp. 405-414. doi:10.1007/s00254-006-0219-z
- A. Jamrah, A. A. Futaisi, N. Rajmohan and S. Al-Yaroubi, “Assessment of Groundwater Vulnerability in Coastal Region of Oman Using DRASTIC Index Method in GIS Environment,” Environmental Monitoring and Assessment, Vol. 147, No. 1-3, 2007, pp. 125-138.
- S. Secunda, M. Collin and A. J. Melloul, “Groundwater Vulnerability Assessment Using a Composite Model Combining DRASTIC with Extensive Land Use on Israel’s Sharon Region,” Journal of Environmental Management, Vol. 54, No. 1, 1998, pp. 39-57. doi:10.1006/jema.1998.0221
- S. Lee, “Evaluation of Waste Disposal Site Using DRASTIC System in Southern Korea,” Environmental Geology, Vol. 44, No. 6, 2003, pp. 654-664. doi:10.1007/s00254-003-0803-4
- J. A. Mendoza and G. Barmen, “Assessment of Groundwater Vulnerability on the Rio Artiguas Basin, Nicaragua,” Environmental Geology, Vol. 50, No. 4, 2006, pp. 569-580. doi:10.1007/s00254-006-0233-1
- Y. Wang, B. J. Merkel, Y. Li, H. Ye, S. Fu and D. Ihm, “Vulnerability of Groundwater in Quaternary Aquifers to Orginaic Contamination: A Case Study on Wuhan City, China,” Environmental Geology, Vol. 53, No. 3, 2007, pp. 479-484. doi:10.1007/s00254-007-0669-y
- L. Rosen, “A Study of the DRASTIC Methodology with Emphasis on Swedish Condition,” Ground Water, Vol. 32, No. 2, 1994, pp. 278-285. doi:10.1111/j.1745-6584.1994.tb00642.x
- Z. Hrkal, “Vulnerability of Groundwater to Acid Deposition, Jizerske Mountains, Northern Czech Republic: Construction and Reliability of a GIS-Based Vulnerability Map,” Hydrogeology Journal, Vol. 9, No. 4, 2001, pp. 348-357. doi:10.1007/s100400100141
- M. G. Rupert, “Calibration of the DRASTIC Groundwater Vulnerability Mapping Method,” Ground Water, Vol. 39, No. 4, 2001, pp. 625-630. doi:10.1111/j.1745-6584.2001.tb02350.x
- I. R. Lake, A. A. Lovett and K. M. Hiscock, “Evaluating Factors Influencing Groundwater Vulnerability to Nitrate Pollution: Developing the Potential of GIS,” Journal of Environmental Management, Vol. 68, No. 3, 2003, pp. 315-328. doi:10.1016/S0301-4797(03)00095-1
- G. P. Panagopoulos, A. K. Antonakos and N. J. Lambrakis, “Optimization of the DRASTIC Method for Groundwater Vulnerability Assessment via the Use of Simple Statistical Method and GIS,” Hydrogeology Journal, Vol. 14, No. 6, 2006, pp. 894-911. doi:10.1007/s10040-005-0008-x
- A Rahman, “A GIS Based DRASTIC Model for Assessing Groundwater Vulnerability in Shallow Aquifer in Aligarh, India,” Applied Geography, Vol. 28, No. 1, 2008, pp. 32-53. doi:10.1016/j.apgeog.2007.07.008
- M. Al-Hamdi “Competition for Scarce Groundwater in the Sana’a Plain, Yemen, a Study on the Incentive Systems for Urban and Agricultural Water Use,” Ph.D. Thesis, Balkema Publishers, 2000
- Italconsult, “Water Supply for Sana’a and Hodeida. Sana’a Basin Groundwater Studies,” Vol. 1-2, UNDP: Yemen 3202, Rome, 1973.
- G. P. Kruseman and L. Vasak, “Wellfield Investigations Kohlan and Wajid Sandstone 1996,” SAWAS Technical Report No.08. 111, Yemen Arab Republic, 1996.
- J. W. A. Foppen, “Source for Sana’a Water Supply, SAWAS Project; Evaluation of the Effects of Groundwater Use on Groundwater Availability in the Sana’a Basin,” Volume II: Data Availability, SAWAS Technical Report No.05, 1996.
- Survey Authority, “Topographic Map Scale 1:50000,” Republic of Yemen, 1998.
- NWRA, “Groundwater Level Map Scale 1:250000,” Republic of Yemen, 2006.
- WEC, “Wells Inventory in the Sana’a Basin, Water and Environment Center at Sana’a University Sana’a Basin Water Resources Management Study,” Final Report, 2002.
- WHO, “Guidelines for Drinking Water Quality,” Addendum to Vol. 2, 2nd Edition, Health Criteria and Other Supporting Information (WHO/EOS/98.1), World Health Organization, Geneva, 1998.