Journal of Software Engineering and Applications
Vol.7 No.3(2014), Article ID:44256,7 pages DOI:10.4236/jsea.2014.73015
High Precision Bidirectional Heat Pulsed Flow Sensor
Jasmin Radadia, Maher E. Rizkalla
Department of Electrical and Computer Engineering, Purdue School of Engineering and Technology, Indiana University Purdue University Indianapolis, Indianapolis, USA
Email: mrizkall@iupui.edu
Copyright © 2014 by authors and Scientific Research Publishing Inc.
This work is licensed under the Creative Commons Attribution International License (CC BY).
http://creativecommons.org/licenses/by/4.0/


Received 24 January 2014; revised 20 February 2014; accepted 28 February 2014
Abstract
In this work we have designed and simulated a thermal bi-directional integrated circuit mass flow sensor. The approach used here was an extension to the gas flow model given by Mayer and Lechner [1] . The design features high precision response received from analog integrated circuits. An established mathematical model for the heat flow equation including CFD parameters were used within COMSOL simulation (COMSOL Multiphysics, Sweden). Heat pulses of 55˚C for a period of nearly 120 seconds and 50% duty cycles were applied as thermal sources to the flowstream. The boundary conditions of the heat equations at the solid (heating element) fluid interface were set up in the software for the thermal response. The hardware design included one heating element and two sensing elements were used to detect the bi-directional mass flow. Platinum sensors were used due to their linear characteristics within 0˚C to 100˚C range, and their high temperature coefficient (0.00385 Ω/˚C). Polyimide thin film heater was used as the element due to its high throughput and good thermal efficiency. Two bridge circuits were used to sense the temperature distribution in the vicinity of the sensing elements.
Keywords:Smart Sensor; Temperature; Software; Hardware; High Precision, CFD

1. Introduction
With the advancement of new technology in hardware and software, an improvement in the sensor design has helped reduce the complexities in the flow measurement and calibration of circuits. The data acquisition technology has helped interfacing sensors to the computer system. Mayer and Lechner [1] claimed low power consumption mass flow sensor fabricated on a single silicon crystal computed with calibration tables. Other flow sensors were developed [2] , but in general lack features such as low power consumption, flexibility (multifunctional for gases and liquids), and bi-directional flow rate detection. Numerous industrial applications require a precisely controlled fluid flow. The flow sensors can structurally be distinguished as invasive and non-invasive types. Low power integrated sensors have been accomplished with embedded systems [3] and micrfluidic devices [4] , however, these systems have not achieved bi-directional features combining both gas and liquid. The proposed system is a multipurpose gas/liquid flow sensors with very high precision that makes suitable for bioapplications.
This work focuses on mass flow measurement using the thermal flow technique in closed conduits, by constructing a Computational Fluid Dynamic (CFD) model for gas (air) and liquid (water). In order to verify the CFD model data, an experimental in-lab mass flow sensor was designed, and experimental data supporting the CFD model for gas (air) was obtained.
2. Hardware Design
A Polyimide thin lightweight Thermofoil flexible heater/Kapton heater was used as the heating element in this project. It features increased throughput as the heater provides fast and efficient thermal response. Figure 1 shows the thermal heater used in the design, while the measuring flow system layout and practical assembly are given in Figures 2 and 3 respectively.
The figure shows the placement and alignment of the heating and sensing elements. The sensing elements

Figure 1. Polyimide Thermofoil heater/Kapton heater.
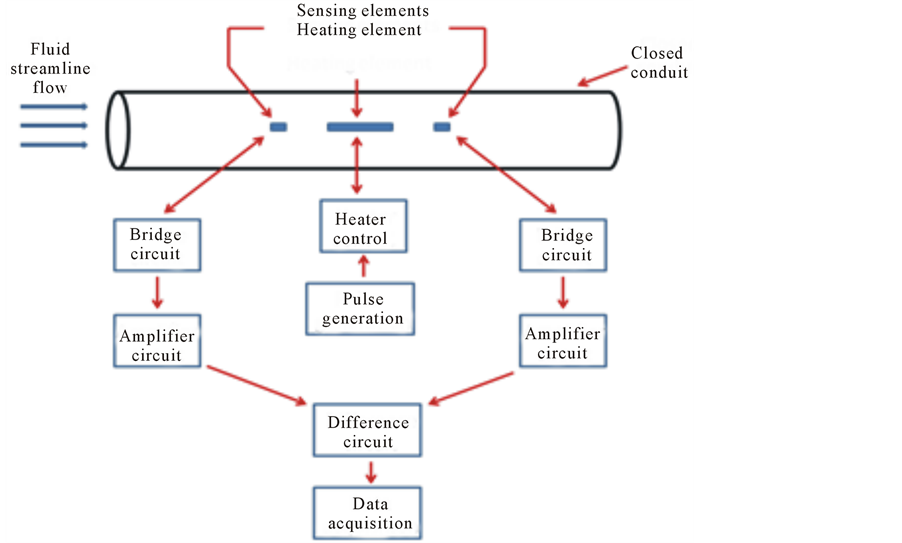
Figure 2 . Flow measurement system layout/p>
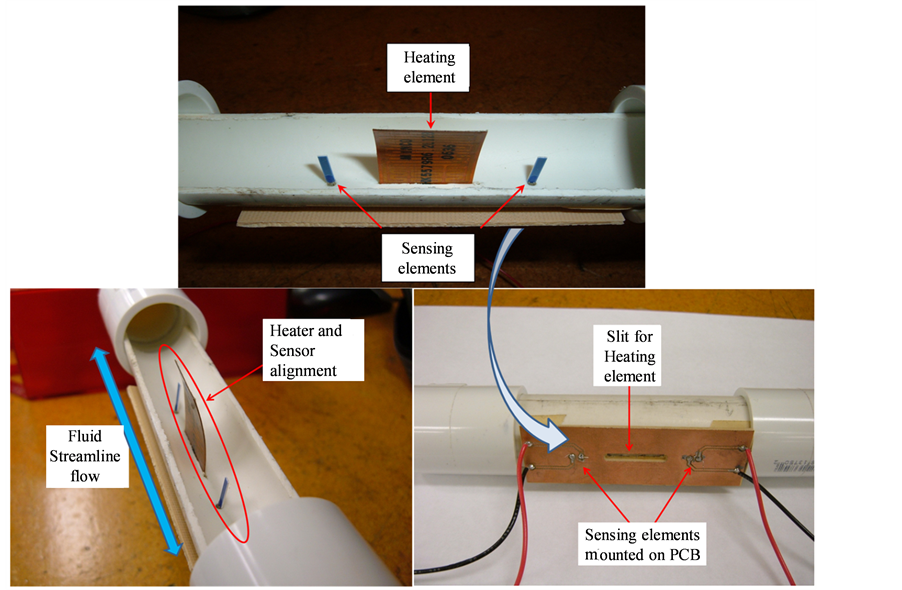
Figure 3. Experimentally assembled calorimetric thermal mass flow sensor.
were placed 1 cm away for heating element in each direction, and were aligned with the edges of the heating element.
3. Electrical Circuit Design
Figure 4 gives the electronic circuit schematics of the measuring system. Each sensing element was connected to an individual electrically balanced Wheatstone bridge. The output voltage signal from each bridge circuit was fed to separate instrumentation amplifier ICs. Since the output signals from the bridge circuits were in millivolts, the gain of the amplifiers was set to ~100 to get the sensor response in volts. The outputs from the amplifiers were fed to a difference circuit, which also consisted of an instrumentation amplifier IC with no gain.
4. Computational Fluid Dynamics Simulation
Figure 5 shows the Computational Fluid Dynamic simulation of heat and mass flow in a Calorimetric thermal flow sensor was performed with the help of COMSOL Multiphysics. The simulation of the sensor was performed for operation in air and water. A geometric model replicating the actual size of the experimental assembly of the calorimetric thermal mass flow sensor was constructed in COMSOL is given.
5. Simulation and Experimental Results
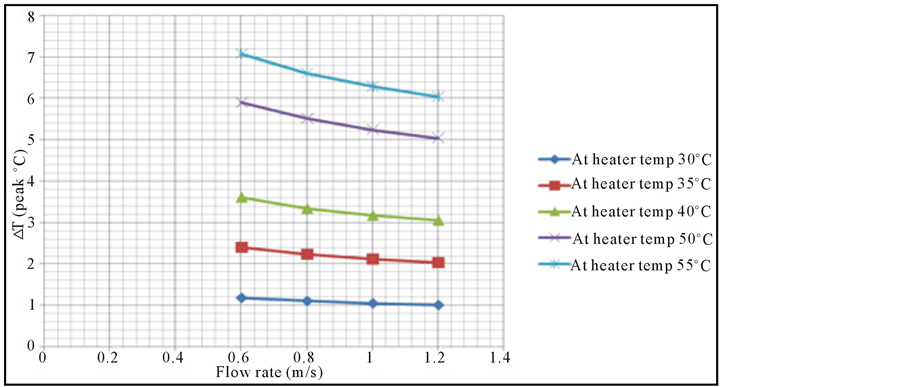
Figures 6 and 7 show the average of peak temperature difference between the upstream and downstream sensing element at different air flow rates. The heating element was operated in pulse mode with 50% duty cycle with peak temperatures at 30˚C, 35˚C, 40˚C, 50˚C and 55˚C. We find that the temperature difference decreases as a function of flow rate. This is intuitive because the downstream sensing element, which gets heated by the convective heat transfer from the heating element, also cools off much faster if the velocity of air is higher. The simulations show that using a higher heater temperature gives a higher slope and hence higher sensitivity in flow measurements. The overall trend between temperature change and velocity was found to be linear at all the heater simulation temperatures. Figure 7 shows the average of peak temperature difference between the upstream
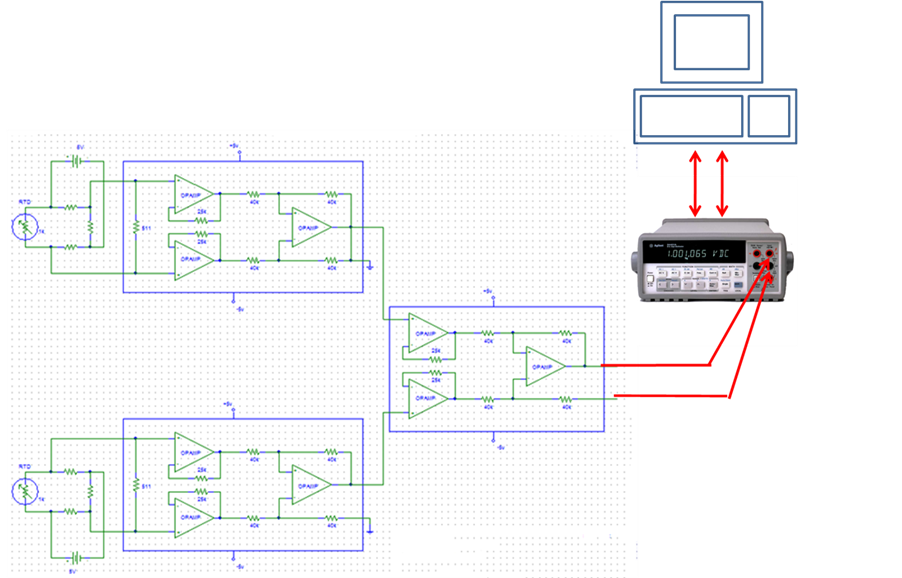
Figure 4. Schematic layout of the sensing circuit and data acquisition scheme.
and downstream sensing element at different water flow rates. The heating element was operated in pulse mode with 50% duty cycle with peak temperatures at 40˚C, 60˚C, 80˚C. Observation for velocity sensing in water was found to be similar as in air. The temperature difference was found to decrease with the increase in water flow velocity, and having a higher heater temperature increased the sensitivity (slope) for velocity sensing. Since water has a higher kinematic viscosity, water sensing had to be simulated at lower velocities in order to remain the laminar flow regime (Re < 500 in simulations). The overall relationship between temperature change and velocity was found to be linear only when heater temperature was held at 40˚C. However at heater temperatures of 60˚C and 80˚C, the temperature difference showed decay similar to a second order polynomial.
Experimental Results
Figure 8 shows the temperature difference between the upstream and downstream sensing elements with respect to time. The heating element was operated in pulse mode and the heat pulse peak was set to 55˚C. The high and low time for the pulse were 60 seconds each, i.e. 50% duty cycle. On observing the graph, it can be seen that with the increase in the flow rate the differential temperature between the sensing elements decreases. The negative difference is due to the flow in the opposite direction.
Figure 9 shows the average of peak temperature difference between the upstream and downstream sensing element at different air flow rates. The heating element was operated in pulse mode with 50% duty cycle at 55˚C. As predicted from the simulation, we see the temperature difference decreases as velocity increases. However, the overall relationship is found to be linear only at the higher three velocity measurements. This can be explained by the fact that simulation does not take thermal characteristics of the sensing element into account. The sensing element consists of platinum wire printed on a thin ceramic sheet. Taking thermal properties of the ceramic sheet may help us understand the so-obtained second order polynomial relationship at lower velocities.
The cooling rate for the sensing element was also detected as a function of the air flow rate, since it could potentially be used to infer air flow rate directly. Figure 10 shows the differential cool-off rate of the downstream sensing element. The heating element was operated in pulse mode with 50% duty cycle at temperatures 40˚C, 50˚C and 55˚C. Data shows that with increase in the flow rate the cool-off rate also increases. Better linearity is seen with higher heater temperatures. This promises that cool-off rate of the downstream sensing element may
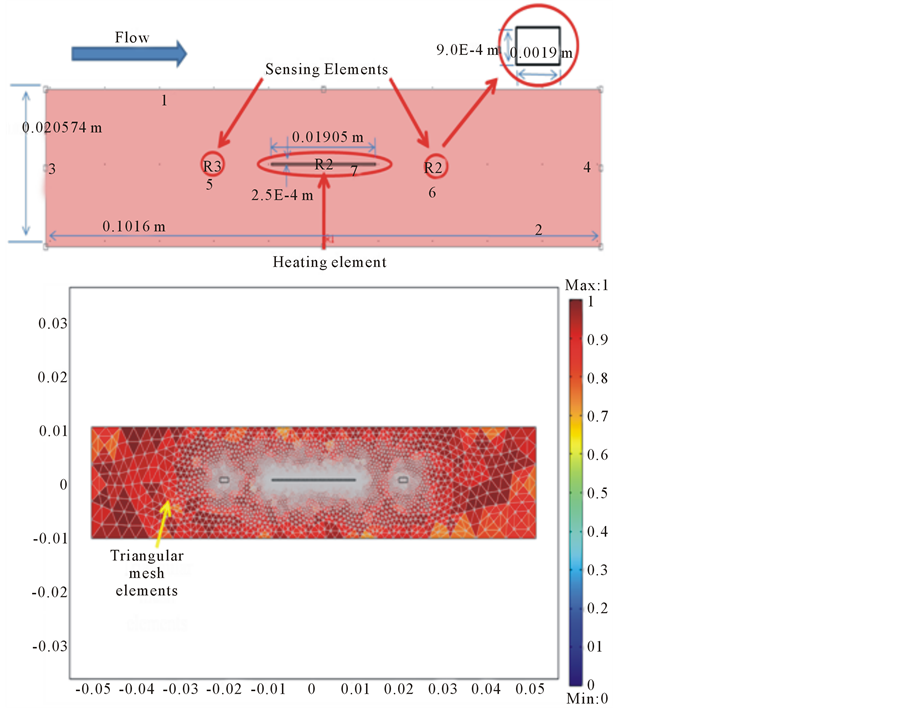
Figure 5. Sensor geometry and mesh elements in COMSOL.
also be used to infer or confirm the air velocity.
6. Conclusions and Future Work
In this research project, a calorimetric thermal mass flow sensor was experimentally assembled and tested to
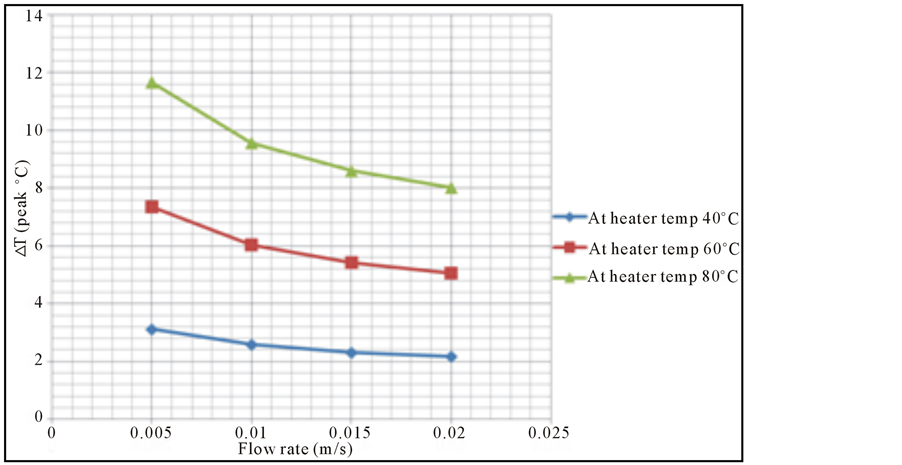
Figure 7. Peak temperature difference vs water flow rate.
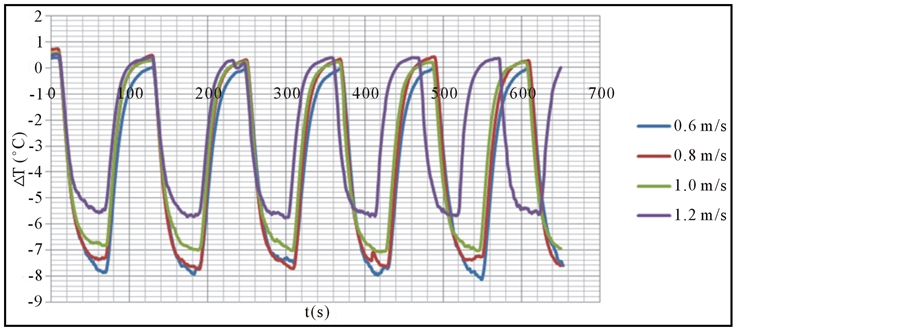
Figure 8. Plot of temperature difference versus time.
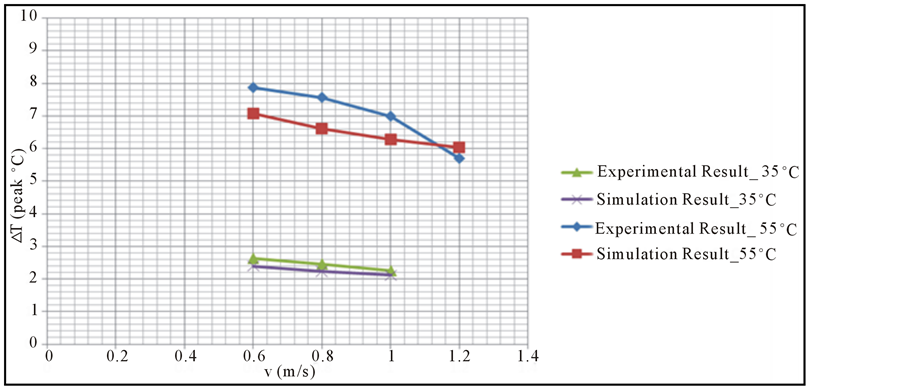
Figure 9. Experimental result and simulated result comparison.
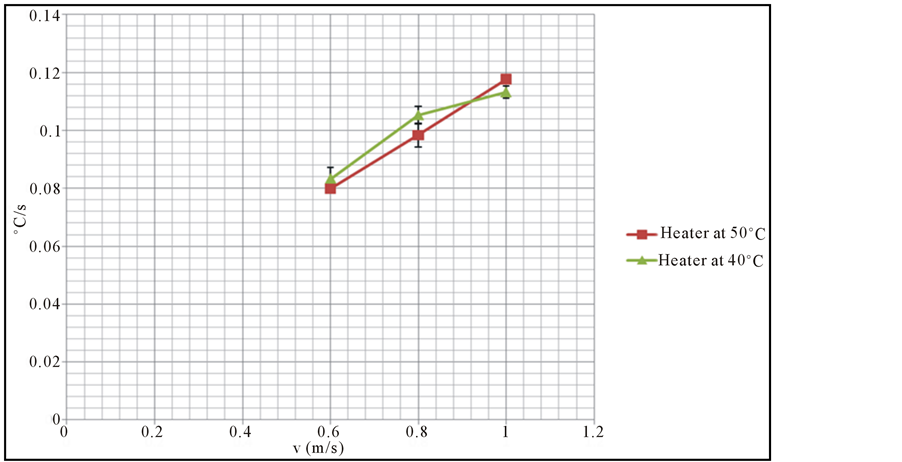
Figure 10. Cool-off rate as a function of air flow rate.
measure flow rates in a closed conduit. Air and water flow were simulated using COMSOL software. The simulations were based on a mathematical model that was required to solve the Navier-Stokes fluid flow equations and the heat conduction/convection equation with boundary settings reflecting near-real situation. The air flow model was validated experimentally with flow rate between 0.6 to 1.2 m/s.
In this work we have demonstrated the design of thermal sensor using thin film platinum sensor and polyimide Thermofoil heating element. This provided the thermal responses expected for the design. The low power instrumentation amplifier provided very accurate measurements, and as low as ~2.5 μV (50 μV max) change was detected. This corresponds to a temperature change as low as 0.02˚C. The difference amplifier provided the direction of the flow. The selection of the temperature controller provided a very stable and accurate temperature distribution in the vicinity of the sensor. The timer circuit was designed to carry out heating operation in pulse mode with 25% and 50% duty cycle.
A computational fluid dynamic (CFD) model replicating the boundary conditions of the assembled flow sensor was built using COMSOL Multiphysics. Simulations for air and water flows were performed. The experimental results were in close agreement with the simulation results.
From the experimental results, it was clear that by reducing the duty cycles the power consumption of the system can be reduced without having any adverse effects on the flow sensitivity of the sensor. It was also concluded that the cool-off rate of the sensors can be a potential measure to predict the flow rate of the fluid under measurement. The challenges in experimental verification of the liquid flow included control of flow and electrical isolation of the sensing elements within the liquid medium. An epoxy material has been identified that can be possibly used for isolation. This was reserved for future consideration. In future we would like to realize a system that can be integrated with wireless devices that can transmit the magnitude of the fluid flow and its direction.
References
- Kuo, J.T.W., Yu, L. and Meng, E. (2012) Micromachined Thermal Flow Sensors—A Review. Micromachines, 3, 550- 573. www.mdpi.com/journal/micromachines
- Olin, J. (2002) The Evolution of Mass Flow Meters. http://www.sierrainstruments.com/prnews/a6.pdf
- Rizkalla, M.E., et al. (2012) Hardware Design for Low Power Integrated Sensor System. International Journal of Communications, Network and System Sciences, 5, 141-146. http://dx.doi.org/10.4236/ijcns.2012.53018
- Greenwood, et al. (2010) Collection of Gaseous and Aerosolized Samples Using Microfluidic Devices with Gas Liquid Interface. IEEE Sensors Journal, 10, 952-959. http://dx.doi.org/10.1109/JSEN.2009.2038071