Journal of Service Science and Management
Vol.08 No.01(2015), Article ID:53406,12 pages
10.4236/jssm.2015.81001
Uncovering Executive Prioritization: Evaluating Customer Value Propositions with the Pairwise Comparison Method
Mika Yrjölä
School of Management, University of Tampere, Tampere, Finland
Email: mika.yrjola@uta.fi
Copyright © 2015 by author and Scientific Research Publishing Inc.
This work is licensed under the Creative Commons Attribution International License (CC BY).
http://creativecommons.org/licenses/by/4.0/


Received 12 January 2015; accepted 18 January 2015; published 21 January 2015
ABSTRACT
Creating customer value is a managerial priority. The role of executives is to choose what type(s) of customer value to propose to customers in the form of a customer value proposition (CVP). The decision is a complex one, because executives have to compare and weigh concrete, measurable elements alongside abstract, subjective ones. The purpose of this paper is to identify themes relating to the use of the pairwise comparison method (PCM) as a tool for prioritizing customer value dimensions from the perspective of retail executives. As a result, this paper first highlights examples of PCM outputs, and second, identifies four themes that capture executive views of the PCM.
Keywords:
Customer Value, Customer Value Proposition, Pairwise Comparison Method, Strategic Decision Making

1. Introduction
The trick is to make informed trade-offs… (Campbell & Whitehead, 2014, p. 1)
Retailing executives strive to understand different aspects of consumption behavior so they may make large- scale, long-term strategic decisions regarding key resources and processes such as locations, branding, and store concepts. Consumers’ shopping and buying decisions in retailing cannot be simplified down to price or location alone, since consumers also search for things like social interaction, self-affirmation, and experiences in their shopping [1] . The concept of customer value captures the full spectrum of consumer behavior, including both concrete, measurable competitive aspects (e.g., price, quality, location, and opening hours) as well as abstract, subjective elements such as atmospherics, play, and consumption meanings. Customer value is seen as a driver of both customer satisfaction and loyalty, which is why it has found its place on the executive agenda [2] . Indeed, the executives’ role is to identify, evaluate, and choose how their offering relates to the creation of relevant customer benefits and the minimization of important customer sacrifices, that is, they decide what type(s) of customer value they propose to their customers in the form of a customer value proposition (CVP).
Choosing a CVP is a complex decision, because executives have to evaluate and compare concrete competitive elements with abstract ones. They have to identify the relevant aspects on which customers base their decisions, find a way to weigh the importance of these dissimilar decision criteria, and finally select the most important ones as priorities. Retailers recognize that soft criteria, such as atmospherics and self-expression, play an important role in consumption, but find it hard to compare them with more concrete competitive criteria such as price or opening hours. This paper adopts the pairwise comparison method (PCM) to elicit executive priorities regarding customer value dimensions, because it has been found useful in comparisons of more subjective criteria against more objective ones [3] . The PCM can be used in evaluating and calculating the relative importance percentages for a set of decision criteria, but it has not been previously used in a decision setting involving customer value.
To investigate how retail executives prioritize customer value dimensions as a basis for their future CVP, the PCM is applied in a shopping center setting. In this setting, the center’s overall value proposition is heavily dependent on the mix of stores present in the center, since the stores affect how customers perceive the shopping center [4] [5] . Finn and Louviere found that over 70 percent of variance in consumer perceptions of shopping center image was accounted for by the tenant stores in the center [5] . For instance, the presence of a discount store was associated with significantly weaker perceptions of quality, wide selection, good service, and latest fashions, but a stronger perception of low prices of the overall shopping center [5] . That is why the executives responsible for the shopping center must evaluate how the store mix contributes to the center’s overall customer value proposition.
The purpose of this paper is to analyze how retail executives utilize the pairwise comparison method (PCM) as a tool for prioritizing customer value dimensions. The respondents include a large retailer’s executives and partners. Together, the group represents the retailer’s shopping destinations and shopping centers that comprise both the retailer’s own chains (e.g., groceries, appliances, clothing) as well as partnering chains (e.g., fashion, services, electronics). As explained above, each store present in a shopping center contributes to the center’s overall CVP in some way, so highlighting individual priorities will serve the group of executives in developing the shopping center further. To uncover how executives of different retail chains operating in the same destination prioritize customer value dimensions, the PCM is applied. After making the paired comparisons individually, the executives discussed their views on the method.
The paper is organized as follows. Section 2 provides the theoretical background focusing on customer value and the CVP. In section 3, the methodological approach is discussed. Section 4 presents the findings, identifying how executives view the PCM and illustrating how the PCM results can spur strategic discussion. Finally, section 5 comprises a discussion section and presents the conclusions.
2. Theoretical Framework
2.1. Customer Value Proposition
The customer value proposition is a managerially-oriented concept used to position the company in the market in terms of customer value [6] . A CVP positions the company relative to the competition by answering the questions: “Who is the target customer?”, “Why should the customer buy it?”, and “What are we selling?” ([7] , pp. 107-108). A CVP thus specifies the differentiating benefits and sacrifices related to an offering. It is important to focus only on competitive elements on which the company equals or outstrips the performance of its rivals [8] . These types of decisions involve multiple trade-offs for companies as simultaneously investing in all types of customer value is rarely possible or even wise. Therefore, prioritization is a requirement of developing a CVP.
The CVP ties the customer and company perspectives together for value creation and the creation of competitive advantage [6] . Ideally, the CVP represents the complete customer experience in terms of what the customer considers to be relevant value-creating benefits [9] . An efficient CVP helps customers compare and categorize the offering in relation to the competition, for example, when they divide offerings into groups they like and do not like. To help customers make these comparisons, a CVP should concentrate only on one or two differentiating elements that resonate with the targeted customer segments [8] . Thus a competitive CVP is one that attracts and serves targeted customer segments.
Beyond its role as a positioning device, the CVP also orients the company to focus on delivering the customer benefits articulated in the CVP. The competitiveness of a CVP should be evaluated on how well company resources and competencies suit the delivery of the promised value [6] . The CVP should therefore reflect business model areas where the company can create a competitive advantage [10] . A price-driven value proposition, for instance, could be based on economies of scale. The choice of the type of customer value to include in a CVP carries major implications for retailers in areas such as segmentation, training, concept development, branding and marketing communications. For example, a price-driven retailer will provide services and applications that enable its customers to compare prices and save money in delivery charges, whereas an experience-oriented retailer will offer services that inspire customers with ideas and stories [11] .
2.2. Choosing Customer Value Dimensions for Comparison
The development of a CVP can be characterized as a choice of one or more main types, or dimensions, of customer value. To investigate how retail executives evaluate, compare, and prioritize these customer value dimensions as a basis for their future CVP, the PCM is applied. The first step in the PCM process is to choose the decision criteria for the comparisons. Therefore, a literature review was conducted to identify relevant customer value dimensions. It should be noted that making the paired comparisons is a cognitively demanding task. As the number of criteria increases, the number of required comparisons grows rapidly [12] . A high number of pairwise comparisons can lead to information overload, threatening the quality of the final decision. Thus, either the number of compared decision criteria should be limited, or the researcher needs to find ways of handling incomplete data [12] . As a rule of thumb, the number of compared priorities should preferably be restricted to a maximum of seven [13] . Adding more priorities results in a greater number of comparisons, and this cognitive strain can lead to great inconsistencies in responses. Therefore the aim of the literature review was to reach a limited set of value dimensions that characterize the most relevant aspects of customer value without serious overlap.
Customer value is a customer’s subjective evaluation of the positive and negative consequences of owning or using a product or service, “the ultimate reason that people buy what they buy” ( [6] p. 621; [14] [15] ). It is a multidimensional construct, reflecting both utilitarian/economic and psychological/hedonic benefits and sacrifices related to a firm’s offering [2] [6] [15] - [18] . There are numerous ways of further categorizing customer value dimensions, such as from more concrete and objective to more abstract and subjective or from more tran- saction-centered to more interaction-centered [18] - [22] . Following Rintamäki et al. [6] , this paper conceptualizes customer value as consisting of economic (focus on price), functional (focus on solutions), emotional (focus on customer experience), and symbolic (focus on meaning) dimensions (Table 1). They capture the relevant dimensions of customer value without serious overlap between dimensions.
Economic customer value relates to customer perceptions of an offering’s price [2] . Some customers make purchase decisions based solely on price, and such consumers are either unable or unwilling to spend the amount necessary to acquire higher quality products or services. However, these customers might be willing to sacrifice time and effort (i.e., functional value) to obtain the best price. Some other consumers look for the best relation between quality and price, and will upgrade to a more expensive product if they perceive the quality increase to outweigh the price increase [6] . Thus, economic value is defined as “the lowest price or the best tradeoff between quality and price” ( [6] , p. 627).
Functional customer value is related to convenient shopping solutions that minimize the customer’s functional sacrifices such as time, physical effort, and cognitive strain [19] . A product is perceived as having functional value, if it is well-equipped to perform its intended function [14] . For retailers, functional value is created when the retailer offers products that meet its customers’ needs, help customers make the right decisions, and orchestrate a convenient shopping solution [6] [23] - [25] . Here, functional value is defined as “finding the right products with as little time and as little physical and cognitive effort as possible” ( [6] , p. 627).
Emotional customer value is related to the experiential aspects of shopping. Following Sheth et al., we define emotional value as the “perceived utility derived from an alternative’s capacity to arouse feelings or affective states” ( [14] , p. 161; see also [6] ). For customers appreciating emotional value, the shopping experience becomes an end valued in its own right [19] [20] . Emotional value emphasizes the role of the store environment and atmosphere, including the use of visual, auditory, and olfactory cues, and personal service [26] [27] .

Table 1. Definitions used when conducting the pairwise comparisons.
Symbolic customer value is related to the self-expressive aspects of consumption [6] . Flint sees symbols as “special kinds of social objects that stand for something; they have meaning and when used are intended to convey a shared meaning to a receiver, who incidentally can be oneself (i.e., self-communication)” ( [28] , p. 352). Symbols and symbolic value are in play when buying, using, or owning a product represents something other than the product’s obvious function [6] . We follow Rintamäki et al. in defining symbolic value as “positive consumption meanings that are attached to self and/or communicated to others” ( [6] , p. 629). Symbolic value is thus created when customers choose a brand or a retailer that is socially interpreted as enhancing the positive image of themselves. Even products traditionally seen as purely utilitarian can be purchased for their social, symbolic value [14] . While symbolic benefits are related to positive consumption meanings such as confidence and status, symbolic sacrifices relate to negative consumption meanings that can result in feelings of shame, or that conflict with self-image.
3. Methodology
3.1. The PCM as a Tool for Uncovering Executives’ Views and Preferences
There are numerous ways of eliciting opinions from executives on the importance of decision criteria. They could simply rank the relative importance of the customer value dimensions; however, this approach has been criticized because it is too abstract and often results in inconsistencies [29] . The executives could also express their views using traditional five- or seven-point Likert scales, which would yield importance weights for the criteria [30] . Nonetheless, in this type of setting, they may evaluate many or even most priorities as important, which would not facilitate strategic discussion [31] . As a third option, executives could be asked to distribute points (usually 100) across the decision criteria, but this approach might also result in little variance in perceived relative importance [30] . As a fourth option, they could compare each criterion against each other one in a series of pairwise comparisons. Based on these comparisons, the relative importance weights for the criteria could then be calculated. This last option, called the PCM, is used in this paper since it provides more information than the other methods and does not suffer from the same limitations [32] . Furthermore, the PCM suits executive decision making for a number of other reasons. First, making comparative judgments is easier than making absolute judgments of each criterion’s importance [33] [34] . Second, the inputs for PCM can include subjective concepts such as customer value. Third, the PCM can be used with a variety of other decision-making methods [3] .
The PCM is adopted to reveal customer value priorities in positioning a retail chain. The dimensions of customer value (i.e., economic, functional, emotional, and symbolic value) represent the criteria on which to base the positioning decision. As Saarijärvi, Kuusela, and Spence ( [35] , p. 637) observe: “In comparison to other methods that often return little variance in perceived importance, PCM offers more information.” The PCM uncovers three types of information: first, it provides the rankings of the compared priorities (i.e., which is the most important priority), second, it provides the relative weights of the priorities, and third, it assesses how consistently the comparisons were made. The PCM is thus a suitable method for identifying how executives view the relative importance of decision-making criteria. It has been widely used in many disciplines, often as a part of the Analytic Hierarchy Process (AHP) [13] [33] [34] [36] . The business literature shows AHP has been used in various decision-making situations such as media selection [37] , marketing-driven business strategy design [38] , product portfolio decisions and new product concept evaluation [39] .
3.2. The Data Generation Process
The data generation process comprised five phases (Figure 1). First, the decision problem was formulated-fo- cusing on using the PCM for prioritization and decision making (see [3] for a review of the different approaches used with the PCM and AHP). Second, a literature review was conducted to identify and select customer value dimensions for comparison. Third, two pilot sessions with students were used to test the PCM answer sheet and rehearse for the actual data generation. Based on these steps, some small changes were made to the questions and definitions given to the participants. Fourth, the data was generated as part of a large retailer’s seminar for a group of its executives and partners. The executives are responsible for the development of the retailer’s shopping destinations and shopping centers that consist of both the retailer’s own chains (e.g., groceries, appliances, clothing) and partner chains (e.g., fashion, services, electronics). The partners were executives from retailers that operate in the shopping centers.
In the beginning of the fourth phase, the participants attended a presentation on customer value and its four dimensions. Definitions for each customer value dimension were given both as part of the presentation and as a handout (Table 1). Participants were encouraged to ask questions if something remained unclear, and they were asked to write down what each customer value dimension meant in their specific business context. This was done in order to facilitate thinking and enabling the respondents to complete the pairwise comparisons. A summary of executives’ context-specific translations of customer value is shown in Table 2. Then, the pairwise comparison method was explained to the participants and the comparisons were made. Again, respondents were encouraged to ask questions if they felt anything was unclear. The instructions for making the comparisons were given both orally and in written form. The pairwise comparisons were gathered using a standard interval scale shown in Figure 2. The scale has been documented to have robust psychometric properties and has been extensively used since its introduction in an AHP setting [34] [40] [41] . The decision task was to evaluate which dimensions of customer value were priorities for their retail chain in the future. The form consisted of comparisons for each customer value pair (six comparisons in total).

Figure 1. The data generation process.
Table 2. Executive “translations” of customer value dimensions.
Before the fifth phase, the participants were asked to answer three additional questions after completing and submitting the pairwise comparison form. This was done to help the respondents discuss their views regarding the PCM by comparing it to these other methods. In these questions, the problem presented to the participants was exactly the same, but the method of response was different. First, the participants were asked to rank the different dimensions of customer value based on their importance. Second, the participants were asked to distribute 100 points among the value dimensions. And third, the participants evaluated each dimension’s importance on a 5-point Likert scale.
Finally, in the fifth phase, a group discussion was conducted on the PCM and the prioritizing of customer value dimensions. The whole session lasted nearly two hours. The participants were encouraged to engage in a group discussion on the qualities of the PCM as a strategic tool. Later, the interview recording was transcribed and analyzed along with notes made by the researcher during data generation.
3.3. Analysis
After data generation, customer value preferences for each participant were derived from the pairwise comparison. Then, inconsistencies in the pairwise evaluations were calculated. In the context of the PCM, inconsistencies refer to a participant’s conflicting comparisons. There should be transitivity of preferences as well as agree- ment on the strength of directionality (e.g., if a < b and b < c, then a should be

Figure 2. The interval scale used in the pairwise comparisons.
Table 3. Inconsistency levels.
aThe response was adjusted to achieve consistency.
Eight sets of pairwise comparisons were made and five of them achieved an inconsistency level of 10% or less. Using a technique developed by Saaty [13] , the inconsistent responses were adjusted in an attempt to reach an acceptable inconsistency level. This was executed by comparing pairwise comparisons with each priority’s eigen value to identify the most inconsistent judgment and then adjusting that value. Thus, response G obtained acceptable consistency. However, two responses remained highly inconsistent. Normally the respondents would be asked to complete their survey forms again, but this was deemed unnecessary, since the data were already quite rich and the executives are time-constrained.
The group discussion data and researcher notes were analyzed using a qualitative approach. As a result, the data were categorized into four themes: contextually dynamic, comprehensiveness, preference-elicitation, and feedback on consistency. In the next session, the findings are discussed.
4. Findings
4.1. Using the PCM to Identify Executives’ Views
Saarijärvi et al. explain that the PCM can identify executives’ opinions regarding their relative priorities as well as the inconsistencies of such preferences [35] . Here, the PCM is used to identify which customer value dimensions were seen as priorities and how the opinions varied between respondents. The objective is to demonstrate how the PCM results can fuel strategic discussion regarding the shopping center positioning.
The PCM data analysis began by deriving the actual relative weights resulting from the pairwise comparisons. The weights were calculated utilizing the eigenvector method, which is widely used with the pairwise comparison matrix [42] . These relative weights, organized by customer value dimension, are shown in Figure 3. For each respondent, the evaluations add up to 100%. From the figure, it is apparent that opinions vary regarding the relative importance of economic and functional dimensions. At the same time, only respondent B views emotional value as unimportant, and only respondents E and G see symbolic value as a priority.
Examining Figure 3, the PCM reveals the one or two top priorities of each respondent while clearly highlighting the value dimensions with low relative weights. Emotional value clearly emerges as a priority for all but one respondent. Economic customer value, in turn, is not seen as a priority by most of the respondents. It is however, the number two priority for two respondents. This suggests that respondents were not keen on positioning themselves first and foremost as a cheap brand or a discount retailer. In the group discussion, the respondents expressed the opinion that focusing on economic value would not constitute doing profitable business:
I tried to imagine what the customers would actually expect. What types of things could be important, in relation to where we want to be in the marketplace? Of course, we don’t want to be in the space with the lowest margins. On the other hand, customer expectations are also about to change…at least some of the customers. There will always be those focusing only on price. The type of experiential shopping and such is sure to increase, and people are willing to pay more for it. (Respondent E)
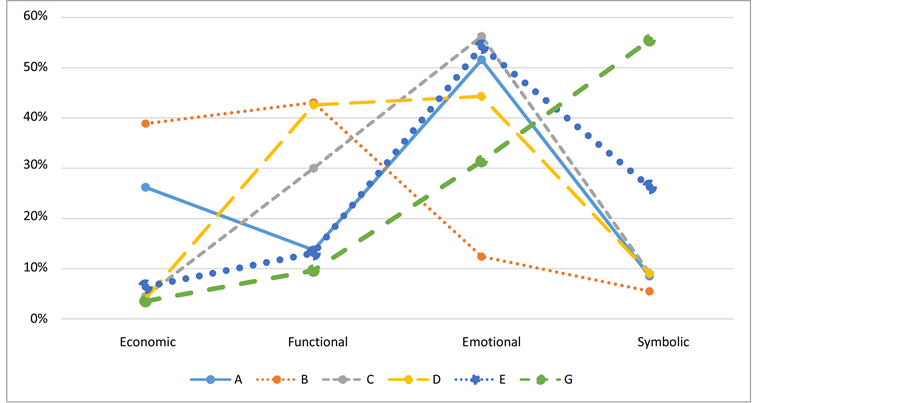
Figure 3. Executive evaluations of customer value priorities.
In the quoted excerpt above, economic value is abandoned in favor of experiential shopping, exemplified by emotional customer value. While some respondents perceived economic value as important, they also acknowledged the challenges in creating it. One respondent answered bluntly: “The concept is currently unable to create economic customer value.” Other respondents also noted that their price level was above average, but emphasized that they are not competing on price:
Like B said before, profitability and profitable business is found on that side of customer value. It isn’t in bulk merchandise. (Respondent E)
I agree, and for us also, the customer doesn’t really care about the exact price, the economic value dimension doesn’t stand out in our business. Our concept is heavily focused on the functional value: it’s easy for the customer and with high quality. And emotional value is definitely an important part of the concept. That is, a good experience and good service. (Respondent D)
Organizing the data around the respondents makes isolating their different views a relatively simple task (Figure 4). These differences appear as vertical deviations in each line, so the more horizontal a line is, the closer the respondents’ opinions regarding the relative importance of that customer value dimension. For economic value, for instance, respondents C, D, E, and G all rank it as unimportant with the relative weight being below 10 percent, while respondents A and B both see it as their second priority. Functional value, in turn, is seen as important by three respondents, and unimportant by three. Interestingly, emotional value is ranked as the top priority by five respondents, while one respondent views it as relatively unimportant. For symbolic value, only two respondents rank it as important.
4.2. Executives’ Views of the Pairwise Comparison Method
The overall reception of the PCM was positive. In the discussion, the executives told the researcher that the PCM form was straightforward to answer, although the decision problem itself was perceived as difficult. The executives’ perspectives on the PCM are next discussed through four themes: contextually dynamic, comprehensiveness, preference-elicitation, and feedback on consistency (Table 4).
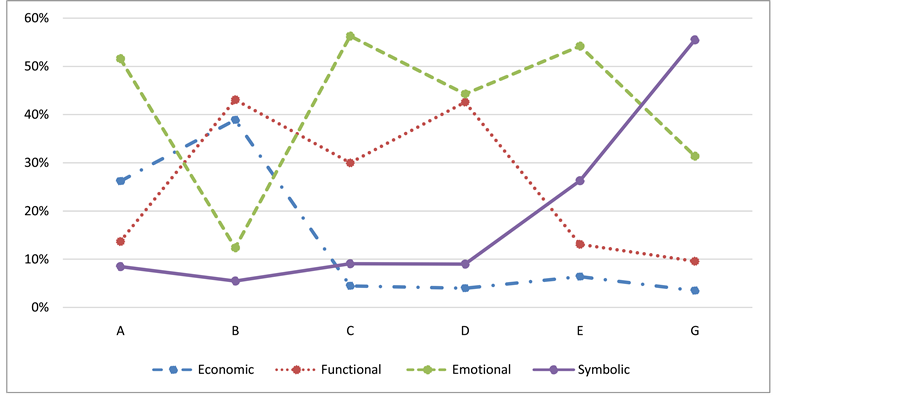
Figure 4. Customer value priorities by respondent.
Table 4. Executive views of the PCM.
Contextually dynamic
Most respondents perceived the method as a simple tool that could be useful and relevant in their own decision making. As one respondent notes: “It is easy to imagine that a method such as this pairwise comparison could be used as a helpful tool in many situations. I feel we should use tools like these.” When asked to elaborate on the situations in which they could use the PCM, the respondents suggested the PCM could be used as a part of prioritizing, strategy-making, or as a basis for strategic discussion:
These types of value-related judgments and goals that we’re making now, these would definitely be useful for us to use. At least in our company. (Respondent H)
I can imagine that these types of tools or analytical methods would be very useful as a part of going through the strategy and goal setting. We have to think in terms of different viewpoints and what dimension would in fact be the most important in our organization. (Respondent C)
Executives felt the method and the decision task were relevant to them, since in the course of their strategic work they had to make value-related judgments and take different viewpoints into account. Many reported that they could relate to the method and the customer value dimensions:
When we’re designing a new shopping center, we don’t use the pairwise comparison as such, but we do go through these things. At least subconsciously. For example, in which direction should we lead the development and who are our customers in five or ten years. We do talk about similar things to these customer value dimensions, like what would our customers appreciate. But it isn’t in such a structured form. (Respondent B)
The approach used here succeeded in capturing the relevant decision criteria and structuring the decision in a way that mirrors the actual discussion around developing positioning for a shopping center. However, it should be highlighted that the perceived usefulness of the PCM/customer value approach was specifically related to future-oriented, strategic decision problems. The respondents felt that other, more short-term, decision problems could be solved using traditional economic analysis.
Comprehensiveness
A second theme emerging from the discussion was the comprehensiveness of the method. Respondents felt they needed to concentrate on filling in the PCM form. They reported feeling that they had to “ponder about things more than in the other form” and acknowledging that “your thoughts go further as you fill more of these.” This was seen as a major benefit of the approach. Others responded with similar thoughts:
Somehow I feel that the pairwise comparison is harder, but in a way also better, because you had to think. You always had to drop one of the paired dimensions to a weaker status. (Respondent B)
I felt that that was a good thing in the pairwise comparison. That you were being forced to think more, which at least in my opinion could lead to a better outcome than making another, faster type of ranking…that you think and argue with yourself as to why you are placing this mark exactly here. (Respondent C)
Related to the above comments, respondents also recognized that they had to explore previously ignored relationships between certain criteria. By having to explicitly compare each pair of criteria, respondents perform a more thorough evaluation of their importance. A “faster type of ranking” might easily lead to a ranking based solely on a vague overall assessment, or one dimensional comparison of the criteria. On the other hand, comprehensiveness can also be a demerit if too many criteria are offered for evaluation, as described in the methodology section.
Preference-elicitation
Making choices is often difficult, especially when there are several dissimilar options, as was the case here. The PCM breaks the multiple-option problem down to a series of pairwise comparisons, which are easier to make. The respondents emphasized that the method forces the respondent to make trade-offs between the priorities:
You have to make a choice. Of course you can always put all of the crosses in the middle of the line, but then you’re lying to yourself. You have to value some options more than the others, and that shows in the end result. (Respondent B)
The executives were strongly averse to assigning the value of 1 on the scale. Indeed, one respondent noted that “in real life, rarely are any two things of even value.” Because respondents rarely evaluate alternatives as being of equal importance, the PCM will yield fairly large differences between the priorities, which in turn might aid decision making.
Feedback on consistency
As mentioned in the methodology section, applying the PCM also involves calculating the degree of inconsistency for each participant. Inconsistencies as such can also be a source of important information. The executives told the researcher that being informed of how much they contradicted themselves was in itself valuable. However, trying to avoid inconsistency in making the comparison added a degree of difficulty:
It was pretty difficult to go through all the comparisons and set them into a ranking in a way. I felt that as I reached the next comparison, that I’m already making choices that contradict each other. For example, in the previous comparison I valued emotional customer value highly, but in the next I felt it wasn’t so important. It was pretty difficult. (Respondent F)
So you disagreed with yourself. (Respondent B)
It happens easily. (Respondent C)
Indeed, three respondents’ answers did not reach an acceptable level of inconsistency. Even after adjusting the responses, two were left with unacceptable inconsistency.
5. Discussion and Implications
5.1. Outlining the Contribution
This paper adopts the pairwise comparison method to offer a new perspective on evaluating customer value propositions. The purpose of this paper is to analyze how executives utilize the pairwise comparison method (PCM) as a tool for prioritizing customer value dimensions. Using the multidimensional customer value concept and prioritizing the customer value dimensions with the PCM, it was possible to uncover executive preferences on different ways of creating customer value. Eight executives representing a large retailer and its partners made pairwise comparisons of customer value dimensions to uncover which value dimensions they viewed as priorities for future positioning. After completing the pairwise comparisons, the group discussed how the respondents viewed the PCM approach in relation to strategic decision making. As a result, four themes capturing the executives’ perspectives on the PCM were identified: contextually dynamic, comprehensiveness, preference-elicita- tion, and feedback on consistency.
This paper aims to make a contribution in a number of ways. First, the study departs from other PCM or AHP studies by using a rather simple, future-oriented decision task. This is because the PCM is viewed more as a discussion-facilitating strategic tool than a method resulting in ready-to-use resource allocation percentages. Indeed, the PCM is useful in highlighting differences in executives’ opinions as well as providing feedback on how consistent their views are. In the illustrative example described above, for example, there is considerable agreement that emotional customer value is important for almost all of the retail chains operating in the same retail destination. On the other hand, disagreements were evident regarding other customer value dimensions. For a group of executives, however, disagreements can act as a valuable resource, because the group and the individuals will be aware of more aspects, perspectives, and alternative courses of action [43] -[46] . Being aware of these issues, the group can discuss them, if necessary hire consultants, and collect more information on the problem, which might ultimately improve the quality of decisions [43] .
Secondly, the PCM is seen as a viable tool for executives, since it is easy to understand the basic principle through which the comparisons are made and the weighting in terms of importance is calculated (e.g., the theme contextually dynamic). Although the mechanism is simple, the task of making the comparisons is cognitively demanding, which was seen as a benefit by the respondents (e.g., comprehensiveness). The method imposes structure on a decision problem and makes the respondents think about relationships between criteria they might otherwise ignore. They have to make trade-offs (Skinner, 1969), and the process of making those trade-offs is of value to the executives (preference-elicitation). Additionally, the PCM provides feedback on consistency, which was perceived as useful in reducing decision bias.
Third, the paper sheds light on the possible ways of using the PCM in practice. In the respondents’ view, the PCM is most suitable for situations involving strategic, abstract, and future-oriented problems, where instead of financial analysis the executives have to rely more on their preferences, intuition, and subjective evaluations. The PCM was seen as a supportive tool for a group decision setting where it is important to make everyone’s preferences visible (Figure 5). For a customer-oriented organization, the PCM could be used to uncover customer value priorities on different levels of the organization, in that it might reveal whether executive, manager, and employee priorities are aligned. In addition to decisions regarding the CVP, the PCM, combined with other managerial tools, could be valuable in evaluating and prioritizing a variety of strategic issues such as new busi-

Figure 5. PCM as part of strategy work.
ness opportunities, company values, and markets. The PCM can also add strength to other decision-making methods that require preference judgments for their inputs [3] . As Raghubir et al. write, one function of metrics is to convert “distinct decision alternatives that are initially incomparable into a set of consequences scaled on desirability so that it is possible to evaluate and contrast different alternatives” ( [47] , p. 69). Here, the PCM can help in “turning intangibles into value” ([47] , p. 69).
5.2. Study Limitations
A few limitations in the research setting were identified. First, the compared priorities (here, the four dimensions of customer value) need to be defined unambiguously to reach a shared understanding of what constitutes a given priority. This is a demanding condition considering the complex nature of the customer value concept. This was achieved by providing the respondents with pre-defined, theory-based explanations of each customer value dimension. Each value dimension was discussed in a group setting and questions regarding it were answered. In the second phase of data generation, the participants were also encouraged to write down specific examples of how each value dimension was understood in their business context.
Second, the role of the specific business context should not be underestimated. For instance, this study investigated how a group of executives would prioritize customer value in their own context and retailers not repre- senting a shopping center or shopping destination context might not prioritize emotional customer value. Future studies could utilize the same customer value/PCM setting in different contexts to investigate whether similar patterns emerge. Would industrial organizations focus more on the utilitarian dimensions of value, for example? Is the variance among the priorities linked to cognitive diversity among the executives [43] ?
References
- Balasubramanian, S., Raghunathan, R. and Mahajan, V. (2005) Consumers in a Multichannel Environment: Product Utility, Process Utility, and Channel Choice. Journal of Interactive Marketing, 19, 12-30. http://dx.doi.org/10.1002/dir.20032
- Gallarza, M.G., Gil-Saura, I. and Holbrook, M.B. (2011) The Value of Value: Further Excursions on the Meaning and Role of Customer Value. Journal of Consumer Behaviour, 10, 179-191. http://dx.doi.org/10.1002/cb.328
- Vaidya, O.S. and Kumar, S. (2006) Analytic Hierarchy Process: An Overview of Applications. European Journal of Operational Research, 169, 1-29. http://dx.doi.org/10.1016/j.ejor.2004.04.028
- Anderson, P.M. (1985) Association of Shopping Center Anchors with Performance of a Nonanchor Specialty Chain’s Performance. Journal of Retailing, 61, 61-67.
- Finn, A. and Louviere, J.J. (1996) Shopping Center Image, Consideration, and Choice: Anchor Store Contribution. Journal of Business Research, 35, 241-251. http://dx.doi.org/10.1016/0148-2963(95)00129-8
- Rintamäki, T., Kuusela, H. and Mitronen, L. (2007) Identifying Competitive Customer Value Propositions in Retailing. Managing Service Quality, 17, 621-634. http://dx.doi.org/10.1108/09604520710834975
- Webster Jr., F.E. (1994) Market-Driven Management. Using the New Marketing Concept to Create a Customer- Oriented Company. John Wiley and Sons, New York.
- Anderson, J.C., Narus, J.A. and Van Rossum, W. (2006) Customer Value Propositions in Business Markets. Harvard Business Review, 84, 91-99.
- Selden, L. and MacMillan, I.C. (2006) Manage Customer-centric Innovation―Systemically. Harvard Business Review, 84, 108-116.
- Johnson, M.W., Christensen, C.M. and Kagermann, H. (2008) Reinventing Your Business Model. Harvard Business Review, 50-59.
- Saarijärvi, H., Mitronen, L. and Yrjölä, M. (2014) From Selling To Supporting―Leveraging Mobile Services in the Context of Food Retailing. Journal of Retailing and Consumer Services, 21, 26-36. http://dx.doi.org/10.1016/j.jretconser.2013.06.009
- Carmone, F.J., Kara, A. and Zanakis, S.H. (1997) A Monte Carlo Investigation of Incomplete Pairwise Comparison Matrices in AHP. European Journal of Operational Research, 102, 538-553. http://dx.doi.org/10.1016/S0377-2217(96)00250-0
- Saaty, T.L. (1994) The Analytic Hierarchy Process, Series VI. RWS Publication, Pittsburgh.
- Sheth, J.N., Newman, B.I. and Gross, B.L. (1991) Why We Buy What We Buy: A Theory of Consumption Values. Journal of Business Research, 22, 159-170. http://dx.doi.org/10.1016/0148-2963(91)90050-8
- Woodruff, R.B. (1997) Customer Value: The Next Source for Competitive Advantage. Journal of the Academy of Marketing Science, 25, 139-153. http://dx.doi.org/10.1007/BF02894350
- Gale, B.T. (1994) Managing Customer Value: Creating Quality and Service That Customers Can See. The Free Press, New York.
- Zeithaml, V. (1988) Consumer Perceptions of Price, Quality and Value: A Means-End Model and Synthesis of Evidence. Journal of Marketing, 52, 2-22. http://dx.doi.org/10.2307/1251446
- Holbrook, M.B. (1999) Consumer Value: A Framework for Analysis and Research. Routledge, London. http://dx.doi.org/10.4324/9780203010679
- Babin, B.J., Darden, W.R. and Griffin, M. (1994) Work and/or Fun: Measuring Hedonic and Utilitarian Shopping Value. Journal of Consumer Research, 20, 644-656. http://dx.doi.org/10.1086/209376
- Holbrook, M.B. and Hirschman, E.C. (1982) The Experiential Aspects of Consumption: Fantasies, Feelings, and Fun. Journal of Consumer Research, 9, 132-140. http://dx.doi.org/10.1086/208906
- Khalifa, A.S. (2004) Customer Value: A Review of Recent Literature and an Integrative Configuration. Management Decision, 42, 645-666. http://dx.doi.org/10.1108/00251740410538497
- Smith, J.B. and Colgate, M. (2007) Customer Value Creation: A Practical Framework. Journal of Marketing Theory and Practice, 15, 7-23. http://dx.doi.org/10.2753/MTP1069-6679150101
- Bettman, J.R. (1979) An Information Processing Theory of Consumer Choice. Addison Wesley, Boston.
- Carpenter, J.M. (2008) Consumer Shopping Value, Satisfaction and Loyalty in Discount Retailing. Journal of Retailing and Consumer Services, 15, 358-363. http://dx.doi.org/10.1016/j.jretconser.2007.08.003
- Seiders, K., Berry, L.L. and Gresham, L.G. (2000) Attention, Retailers! How Convenient Is Your Convenience Strategy? Sloan Management Review, 41, 79-90.
- Turley, L.W. and Milliman, R.E. (2000) Atmospheric Effects on Shopping Behavior: A Review of the Experimental Evidence. Journal of Business Research, 49, 193-211. http://dx.doi.org/10.1016/S0148-2963(99)00010-7
- Carbone, L.P. (2004) Clued In: How to Keep Customers Coming Back Again and Again. Prentice-Hall, Upper Saddle River.
- Flint, D.J. (2006) Innovation, Symbolic Interaction and Customer Valuing: Thoughts Stemming from a Service-Do- minant Logic of Marketing. Marketing Theory, 6, 349-362. http://dx.doi.org/10.1177/1470593106066796
- Zahedi, F. (1986) The Analytic Hierarchy Process―A Survey of the Method and Its Applications. Interfaces, 16, 96- 108. http://dx.doi.org/10.1287/inte.16.4.96
- Christiansen, T., Berry, W.L., Bruun, P. and Ward, P. (2003) A Mapping of Competitive Priorities, Manufacturing Practices, and Operational Performance in Groups of Danish Manufacturing Companies. International Journal of Operations and Production Management, 23, 1163-1183. http://dx.doi.org/10.1108/01443570310496616
- Kim, Y.P., Yoon, C.H. and Yun, D.K. (2005) Determining Customer-Oriented Technical Importance Ratings: An Eva- luative Study. International Journal of Quality and Reliability Management, 22, 393-409. http://dx.doi.org/10.1108/02656710510591228
- Carmone, F.J., Kara, A. and Zanakis, S.H. (1997) A Monte Carlo Investigation of Incomplete Pairwise Comparison Matrices in AHP. European Journal of Operational Research, 102, 538-553. http://dx.doi.org/10.1016/S0377-2217(96)00250-0
- Saaty, T.L. (1977) A Scaling Method for Priorities in Hierarchical Structures. Journal of Mathematical Psychology, 15, 234-281. http://dx.doi.org/10.1016/0022-2496(77)90033-5
- Saaty, T.L. (1980) The Analytic Hierarchy Process. McGraw-Hill, New York.
- Saarijärvi, H., Kuusela, H. and Spence, M.T. (2012) Using the Pairwise Comparison Method to Assess Competitive Priorities within a Supply Chain. Industrial Marketing Management, 41, 631-638. http://dx.doi.org/10.1016/j.indmarman.2011.06.031
- Saaty, T.L. and Vargas, L.G. (2001) Models, Methods, Concepts and Applications of the Analytic Hierarchy Process. Kluwer Academic Publishers, Norwell. http://dx.doi.org/10.1007/978-1-4615-1665-1
- Dyer, R.F., Forman, E.H. and Mustafa, M.A. (1992) Decision Support for Media Selection Using the Analytic Hierarchy Process. Journal of Advertising, 21, 59-72. http://dx.doi.org/10.1080/00913367.1992.10673360
- Wind, Y. (1987) An Analytic Hierarchy Process Based Approach to the Design and Evaluation of a Marketing Driven Business and Corporate Strategy. Mathematical Modelling, 9, 285-291. http://dx.doi.org/10.1016/0270-0255(87)90484-2
- Wind, Y. and Saaty, T.L. (1980) Marketing Applications of the Analytic Hierarchy Process. Management Science, 26, 641-658. http://dx.doi.org/10.1287/mnsc.26.7.641
- Harker, P.T. and Vargas, L.G. (1987) The Theory of Ratio Scale Estimation: Saaty’s Analytic Hierarchy Process. Ma- nagement Science, 33, 1383-1403. http://dx.doi.org/10.1287/mnsc.33.11.1383
- Searcy, D.L. (2004) Aligning the Balanced Scorecard and a Firm’s Strategy Using the Analytic Hierarchy Process. Ma- nagement Accounting Quarterly, 5, 1-10.
- Saaty, T.L. (2003) Decision-Making with the AHP: Why Is the Principal Eigenvector Necessary. European Journal of Operational Research, 145, 431-446. http://dx.doi.org/10.1016/S0377-2217(02)00227-8
- Miller, C.C., Burke, L.M. and Glick, W.H. (1998) Cognitive Diversity among Upper-Echelon Executives: Implications for Strategic Decision Processes. Strategic Management Journal, 19, 39-58. http://dx.doi.org/10.1002/(SICI)1097-0266(199801)19:1<39::AID-SMJ932>3.0.CO;2-A
- Bantel, K.A. and Jackson, S.E. (1989) Top Management and Innovations in Banking: Does the Composition of the Top Team Make a Difference? Strategic Management Journal, 10, 107-124.
- Lant, T.K., Milliken, F.J. and Batra, B. (1992) The Role of Managerial Learning and Interpretation in Strategic Persistence and Reorientation: An Empirical Exploration. Strategic Management Journal, 13, 585-608. http://dx.doi.org/10.1002/smj.4250130803
- Wiersema, M.F. and Bantel, K.A. (1992) Top Management Team Demography and Corporate Strategic Change. Aca- demy of Management Journal, 35, 91-121. http://dx.doi.org/10.2307/256474
- Raghubir, P., Roberts, J., Lemon, K.N. and Winer, R.S. (2010) Why, When, and How Should the Effect of Marketing Be Measured? A Stakeholder Perspective for Corporate Social Responsibility Metrics. Journal of Public Policy and Marketing, 29, 66-77. http://dx.doi.org/10.1509/jppm.29.1.66