Intelligent Information Management
Vol.08 No.04(2016), Article ID:68236,11 pages
10.4236/iim.2016.84007
Statistical Fault Diagnosis Methods by Using Higher-Order Correlation Information between Sound and Vibration
Hisako Orimoto
Department of Management Information Systems, Prefectural University of Hiroshima, Hiroshima, Japan

Copyright © 2016 by author and Scientific Research Publishing Inc.
This work is licensed under the Creative Commons Attribution International License (CC BY).
http://creativecommons.org/licenses/by/4.0/


Received 6 April 2016; accepted 9 July 2016; published 12 July 2016
ABSTRACT
It is important to specify the occurrence and cause of failure of machines without stopping the machines because of increased use of various complex industrial systems. In this study, two new diagnosis methods based on the correlation information between sound and vibration emitted from the machine are derived. First, a diagnostic method which can detect the part of machine with fault among the assumed several faults is proposed by measuring simultaneously the time series data on sound and vibration. Next, a diagnosis method based on the estimation of the changing information of correlation between sound and vibration is considered by using prior information in only normal situation. The effectiveness of the proposed theory is experimentally confirmed by applying it to the observed data emitted from a rotational machine driven by an electric motor.
Keywords:
Statistical Faults Diagnosis, Correlation Information, Sound and Vibration

1. Introduction
Recently, various industrial systems have increased and become complicated. The estimation and prediction of damage part in rotational machines without stopping these are required for cost reduction and improvement of safety. Most of studies proposed up to now for the diagnosis have analyzed by use of either of sound or vibration emitted from the machine in frequency domain [1] - [9] . These standard methods in frequency domain are useful for analyzing each mechanical failure based on the internal mechanism. However, these methods require a lot of procedures on signal processing for measured sound and vibration data.
In the previous study, a faults diagnosis method was proposed by using correlation information between sound and vibration emitted from a machine in time domain [10] . However, this method required correlation information of sound and vibration in both normal and failure situations in advance.
In this study, by utilizing correlation information between sound and vibration emitted from the machine more effectively, a new faults diagnosis method is derived from two points of view. More specifically, a faults diagnosis method based on the conditional probability distribution reflected liner and non-liner correlation information of lower or higher order between sound and vibration is proposed. When a specific failure occurs among multiple faults established in advance, a diagnosis method able to detect the machine part with the failure is proposed. By adopting expansion expression of conditional probability distribution based on the multinomial distribution to evaluate several failure situations, a new faults diagnosis method of machine is first proposed. Next, a faults diagnosis method to find change of correlation information between sound and vibration is considered by measuring simultaneously the sound and vibration only in normal situation as prior information. Finally, the effectiveness of proposed theoretical method is experimentally confirmed by applying it to measurement data of sound and vibration emitted from a rotational machine.
2. Theory
2.1. Estimation of Probability for Fault Occurrence (Summary [10] )
First, let us introduce a random variable y with two exclusive values of 0 and 1 corresponding to normal situation without fault of machines and a failure situation with the fault. Furthermore, two kinds of variables on sound and vibration are expressed as  and
and . In the case of paying attention to the variables
 ,
,  , and y, all the information on mutual correlations among
 ,
,  , and y is included in the conditional probability distribution
 . By using the well-known Bayes’ theorem:
 (1)
(1)
the probability of fault occurrence can be predicted in an expansion expression, as follows:
 (2)
(2)

where,  denotes the averaging operation with respect to the random variables. As the fundamental probability density function
 , the generalized binomial distribution is adopted, and the orthonormal functions can be determined as
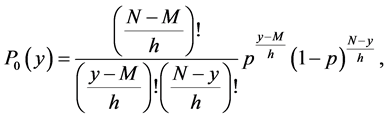 (3)
(3)

 (4)
(4)
with
 ; the maximum value of y,
 ; the minimum value of y,
 ; the level difference interval of y.
By use of a computer for the observed time series data on sound and vibration, on-line signal processing can easily be carried out.
2.2. Expression of Probability Distribution for Diagnosis Method of a Specific Failure among Multiple Faults
Since the specific correlation relationship between sound and vibration emitted from an identical machine exists, it is possible to diagnose faults of the machine by detecting the change of correlation characteristic between sound and vibration. As examples of multiple faults of machine,  and
and  express the state variables corresponding to fault 1 and fault 2. In this section, when a specific failure occurs among multiple faults established in advance, a diagnosis method able to detect the machine part with the failure is proposed.
First, the joint probability distributions  and
and  are expanded into an orthonormal polynomial series.
 (5)
(5)
 (6)
(6)
 (7)
(7)
where, correlation information among variables with lower and higher orders is reflected in the expansion coefficient . Here,
  and
and  are orthonormal polynomials with two weighing functions
 ,
,  , respectively. As the fundamental probability density functions
 ,
,  , Gaussian distribution is adopted.
 (8)
(8)

Thus, from Equation (8), the orthonormal functions can be determined as the Hermite polynomial [11] .
 (9)
(9)
Furthermore, a trinomial distribution is adopted as the standard distribution  expressing two kinds faults states.
 (10)
(10)

Two variables  and
and  correspond to the following states.
Normal: , Fault 1:
 , Fault 2:
 ,
,
where , p is probability of fault 1 and q is probability of fault 2. Thus, from Equation (10), the orthonormal function [11] can be determined as

 (11)
(11)
Therefore, the arbitrary constants are determined as , and
, and  is a factorial function [11] of th order defined as

 ,
, ; discrete level interval of y.
The coefficients  are decided by the normalized condition for the probability.
 (12)
(12)
Furthermore, in the case of considering more than three kinds of failures, a multinomial distribution can be adopted as the standard distribution of Equation (10). It is possible to derive the fault diagnosis in the same manners as the present study by calculating orthogonal polynomial based on the preciously published method [11] .
The following expression can be obtained from Equations ((5), (6)), using Bayes’ theorem on conditional probability distribution.
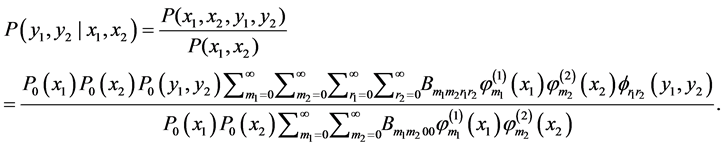 (13)
(13)
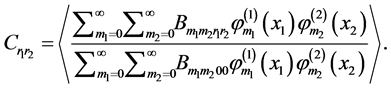
Therefore, fault occurrence probability  is predicted from observation data of sound and vibration by considering the conditional expectation of Equation (13).
 (14)
(14)
2.3. Expression of Probability Distribution for Fault Diagnosis Based on Only Prior Information
Since the specific correlation relationship between sound and vibration emitted from an identical machine exists, it is possible to diagnose faults of the machine by detecting the change of correlation characteristic between sound and vibration.
The fault diagnosis methods proposed in 2.1 and 2.2 require prior information in both situations before and after a failure occurs. However, only the prior information before the failure occurs can be really obtained. In this section, a faults diagnosis method is proposed based on only prior information in normal situation. The variables ,
,  are sound and vibration emitted from rotational machine, respectively. The faults occurrence can be diagnosed from changing information of the correlation of between sound and vibration.
First, the joint probability distribution  is obtained in an orthonormal polynomial series.
 (15)
(15)
 (16)
(16)
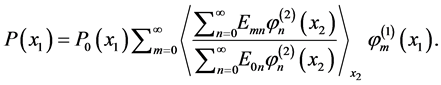
Gaussian distribution is used as the standard distributions , and the Hermite polynomial is determined as the orthonormal polynomials. Then, the probability distribution
  for sound can be predicted from the vibration data, as follows:
 (17)
(17)
 (18)
(18)
Since the correlation information between  and
and  change when a fault occurs, the prediction of
  becomes difficult from Equation (18). Therefore, it is possible to diagnose the faults occurrence by evaluating the prediction error.
In general, cumulative distribution is more suitable than probability distribution for evaluating the prediction error.
There, by using Equation (18) cumulative distribution  is given by the following equation.
 (19)
(19)
with
 (20)
(20)
 (21)
(21)
 (22)
(22)
Furthermore, the faults diagnosis based on the prediction error when evaluating the probability distribution of vibration from sound data is also possible by exchanging the variable  for
for  in Equations ((18)-(22)).
3. Experiment
The proposed method was used to detect faults of a rotational machine by simultaneously observing the sound and vibration emitted from the machine. The correlation relationship between the sound and vibration in the case of failure situations changes from the correlation characteristic in the absence of a fault. Therefore, by detecting information on the change of the correlation characteristic between sound and vibration, it is possible in principle to predict machine faults. The RMS values of the sound pressure level (dB) and the acceleration amplitude (m/s2) emitted from a rotational machine driven by an electric motor were simultaneously measured, as shown in Figure 1.
As an example of fault, three weights were put on the lower part of the bearing and the distortion was made. As the other example of fault, a cogwheel with a small scratch was adopted. The distortion of bearing and the existence of a scratch on a cogwheel were considered for fault 1 and fault 2 as a trial. The 5000 data points were measured for normal, fault 1 and fault 2. The observation data were transformed to the sound pressure level and the acceleration amplitude by use of the following relation.
 (23)
(23)
 (24)
(24)
P: sound pressure [Pa], : acceleration amplitude in each axis [m/s2].
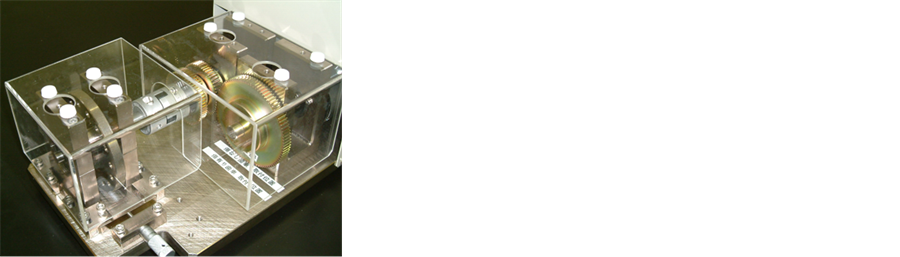
Figure 1. Experimental equipment.
The scatter diagram between the sound and vibration in three cases before and after occurrence of the fault in the machine is shown in Figure 2. Figure 2(a) shows the scatter diagram in normal situation without the fault.
 (a)
(a)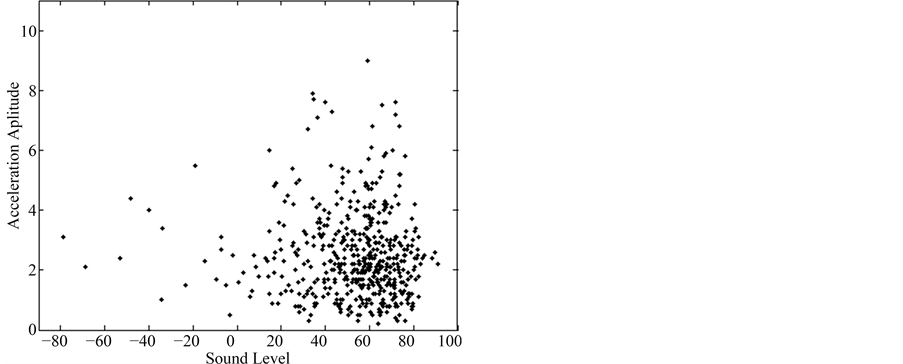 (b)
(b)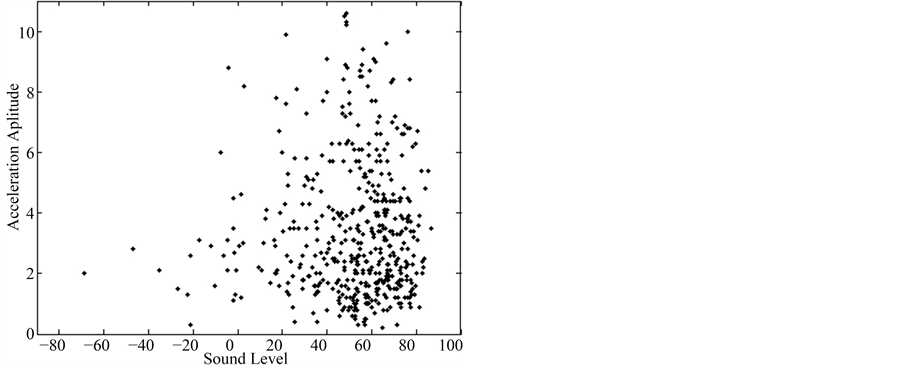 (c)
(c)
Figure 2. Scatter diagram between sound and vibration for the observed data in three situations. (a) Normal situation without the fault; (b) Failure situation with the fault for a bearing; (c) Failure situation with the fault for a cogwheel.
Furthermore, Figure 2(b) and Figure 2(c) show the scatter diagrams in failure situations with the fault on the bearing and the cogwheel. It is obvious that the correlation relationship between the sound and vibration in the cases of failure situations occurring of the fault changes from the correlation characteristic before the occurrence of the fault. Therefore, by detecting the changing information of the correlation characteristic between the sound and vibration, it is possible to predict the fault of the machine in principle.
3.1. Experimental Consideration for Diagnosis Method with Multiple Faults
First, two different time series data sets (Data Set 1 and Data Set 2) for sound and vibration in three different time intervals were successively measured, in cases with and without fault occurrence. Using the 1500 data points of Data Set 1, which contained both cases of faults occurrence (500 data points for each fault) and fault-free cases (500 data points) as the learning data, the expansion coefficients of Equation (7) were first evaluated. Next, after dividing each data set into 30 sub-data sets consisting of 500 data points with 450 overlapping points, the probability of fault occurrence  was predicted by use of Equation (14) based on the 500 sampled data in each sub-data set. The relationship between each Data Set and the sub-data sets is illustrated in Figure 3.
The results of prediction of the probability for normal situation, failure situations with the fault 1 and 2 are shown in Figure 4 for Data Set 1 and in Figure 5 for Data Set 2. From these results, we can find that the fault probability clearly exhibits large values in the sub-data sets corresponding to the failure situation. More precise prediction of the fault probability is possible by considering correlation information of lower and higher orders, because the correlation characteristics (of lower and higher orders) between sound and vibration change after failure. Thus, the proposed method to detect precisely the change of correlation information is useful in the detection of machine failures.
3.2. Experimental Consideration for Fault Diagnosis Method with Less Prior Information
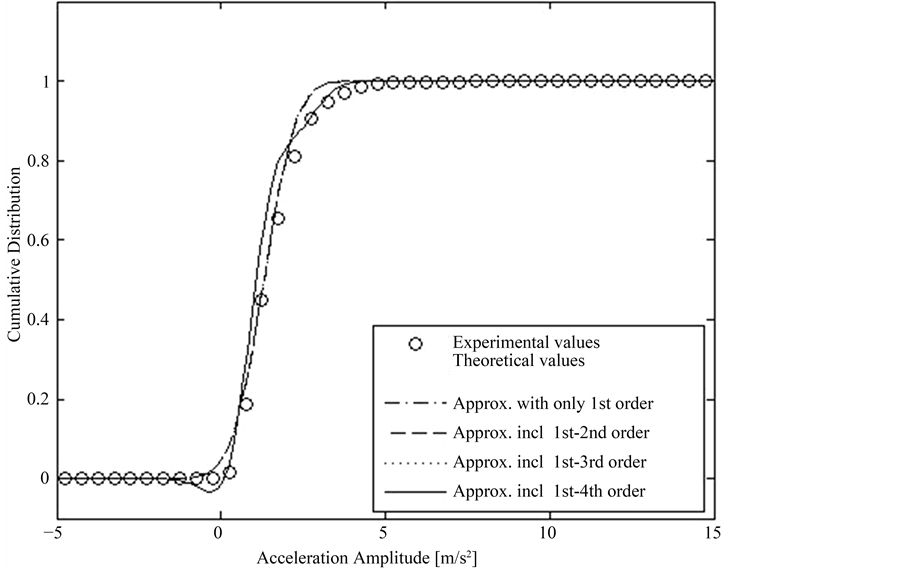
The fault diagnosis method with less prior information proposed in 2.3 was applied to real observation data. First, the expansion coefficients in Equation (15) were calculated by using 1000 data points in normal situation. Next, sub-data sets with 1000 data points were made from total 15,000 data points consisting of each 5000 data points in normal, fault 1 and fault 2 situations. Furthermore, probability distribution of vibration (or sound) was predicted by observing the data of sound (or vibration) by using sub-data sets. One of the prediction results is shown in Figure 5 in a form of cumulative distribution. The differences between experimental values and predicted values are shown in Table 1. Prediction errors at the 50% level and average of the prediction errors evaluated at every 10% level from the 10% level value to the 90% level value are shown in Table 1. The prediction errors were calculated from experimental values  and predicted values
  at 9 points, from the 10% level to the 90% level by using the following relationships.
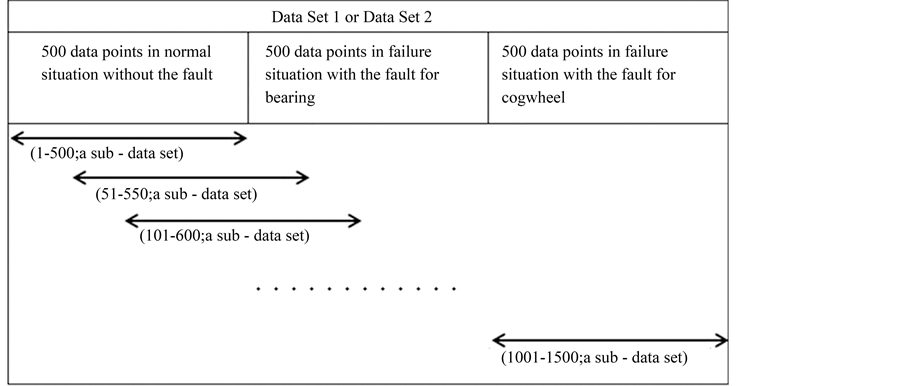
Figure 3. Relationship between data sets and sub-data sets.
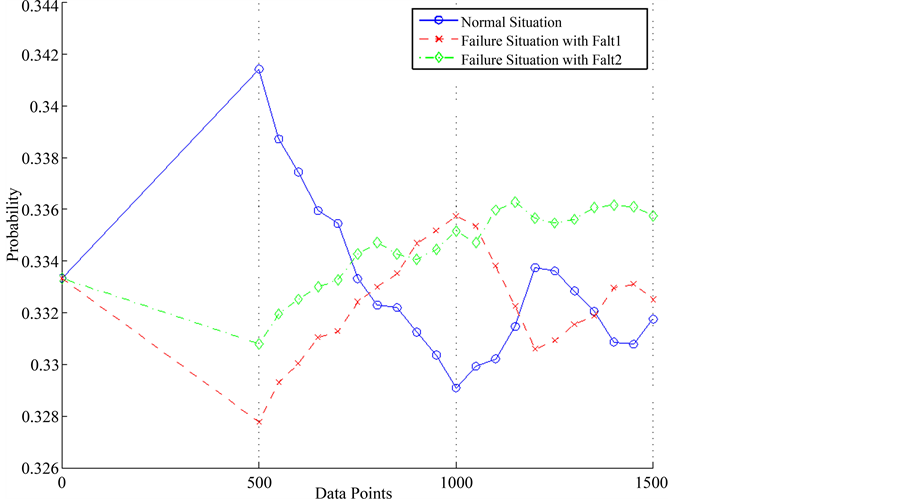
Figure 4. Prediction by use of the learning data.
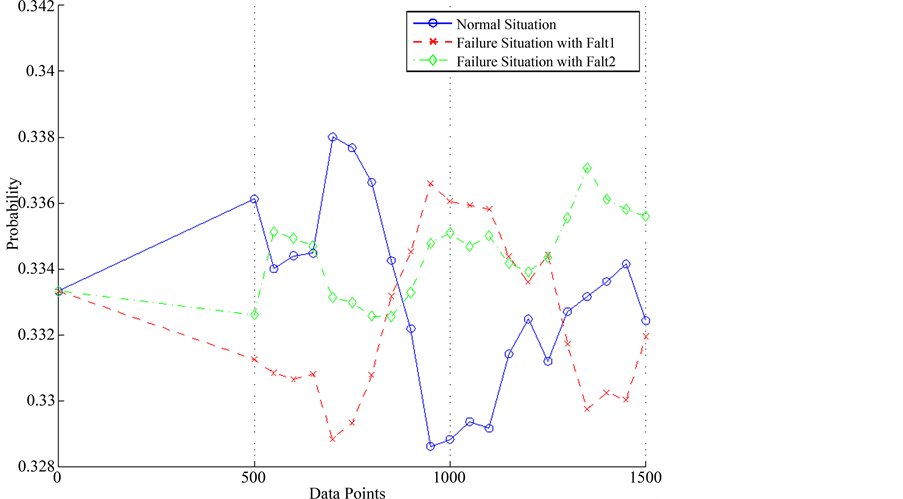
Figure 5. Prediction by use of the different data from the learning data.


When fault 1 and fault 2 occur, large prediction errors are obtained for the probability distribution of vibration based on the observation of sound. As shown in Figure 6, the experimental values could not be predicted and there are great discrepancy between the experimental values and the theoretical values. Table 1, a prediction error is small for normal situation of data point from 1 to 5000. On the other hand, a prediction error becomes big for abnormality situation including a fault of data point from 5001 to 15,000. The validity of the fault diagnosis method based on the prediction error of the cumulative distribution has been confirmed numerically from the experimental result.
 (a)
(a)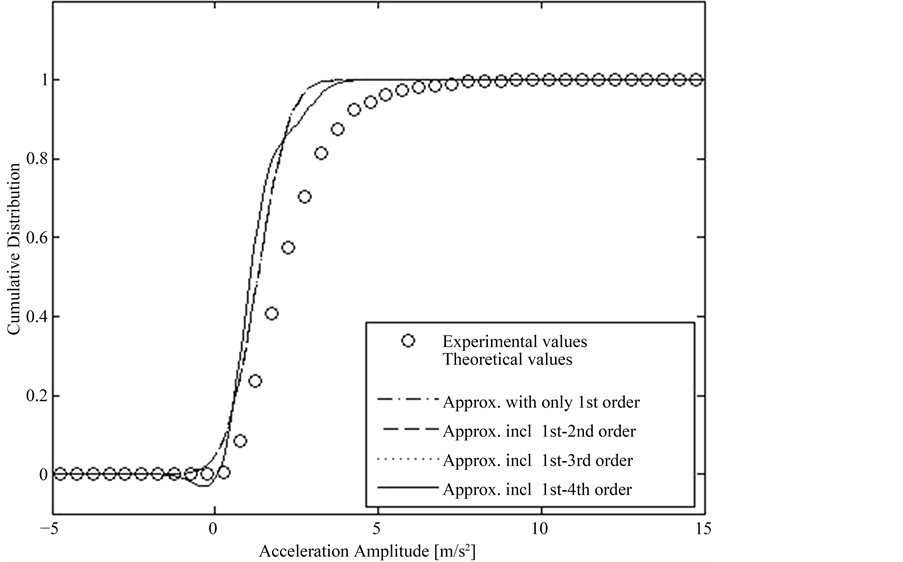 (b)
(b)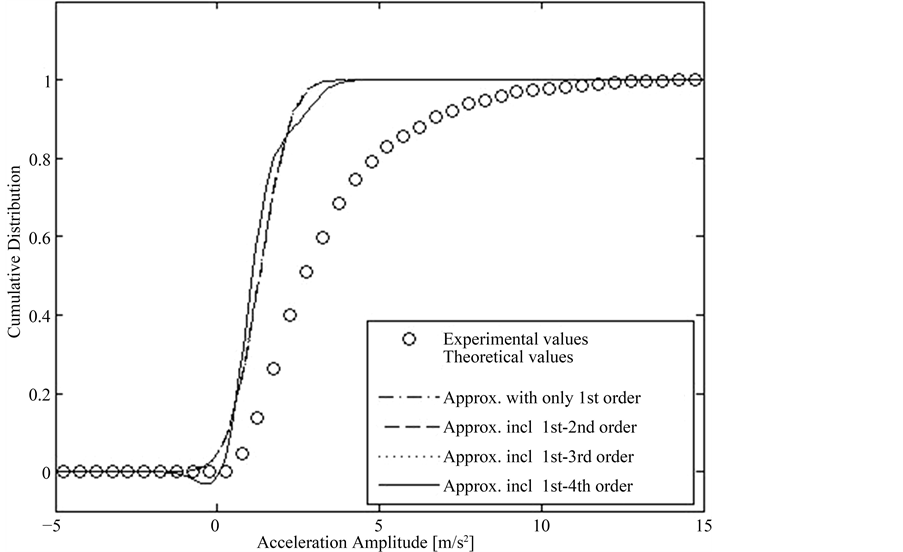 (c)
(c)
Figure 6. Prediction of the probability distribution for vibration based on the measurement data of sound. (a) Normal situation without the fault; (b) Failure situation with the fault for a bearing; (c) Failure situation with the fault for a cogwheel.

Table 1. Prediction errors for the probability distribution of vibration based on the measurement data of sound.
4. Conclusion
This paper has paid attention to the correlation information between sound and vibration emitted from rotational machine, and a method based on the conditional probability distribution with linear or non-linear correlation information of lower order or higher order has been proposed for the diagnosis of multiple faults and fault diagnosis with less prior information. Furthermore, the proposed method has been applied experimentally to observe data emitted from a rotating equipment. The proposed method focuses on the observational data in time domain, and the complicated preprocessing such as frequency analysis is unnecessary. Therefore, the proposed method is suitable for on-line signal processing. More specifically, the proposed fault diagnosis method can specify the fault part of machine by using fault probability. Furthermore, based on the information in only normal situation, it is possible to diagnose the fault in a form of the estimated error of cumulative distribution. Both methods have advantages to diagnose faults numerically. However, the proposed method is still at the early stage of study. Thus, there are a great number of problems in the future. For example, 1) The practical method should be developed at the actual environment existing background noise, 2) The determination method for the most suitable learning period to grasp correlation characteristic has to be proposed, and 3) It is necessary to extend the theory to simultaneous generation of multiple faults.
Acknowledgements
This work was supported by JSPS KAKENHI Grant Number 24760322.
Cite this paper
Hisako Orimoto, (2016) Statistical Fault Diagnosis Methods by Using Higher-Order Correlation Information between Sound and Vibration. Intelligent Information Management,08,87-97. doi: 10.4236/iim.2016.84007
References
- 1. Nian, G.S., Lin, Z.J., Sheng, J.J. and An, H.C. (1989) A Vibration Diagnosis Approach to Structural Fault. Journal of Vibration, Acoustics, Stress and Reliability in Design, 111, 88-93.
http://dx.doi.org/10.1115/1.3269829 - 2. Adams, R.D., Cawley, P., Pye, C. and Stone, B.J. (1978) A Vibration Technique for Non-Destructively Assessing the Integrity of Structures. Journal of Mechanical Science and Technology, 20, 93-100.
http://dx.doi.org/10.1243/JMES_JOUR_1978_020_016_02 - 3. Gundundson, P. (1982) Eigen Frequency Changes of Structures Due to Cracks Noteches or Toehr Geometrical Changes. Journal of the Mechanics and Physics of Solids, 30, 339-353.
http://dx.doi.org/10.1016/0022-5096(82)90004-7 - 4. Kanai, H., Abe, M. and Kido, K. (1986) Detection and Discrimination of Flaws in Ball Bearings by Vibration Analysis. Journal of the Acoustical Society of Japan (E), 7, 121-131.
http://dx.doi.org/10.1250/ast.7.121 - 5. Villarroel, G.Z. and Agren, A. (2003) A New Approach to Diagnostics of the Combustion Process in Diesel Engines Using Vibration Measurements. Part I: Reconstruction of Cylinder Pressure Form Vibration Measurements. The International Journal of Acoustics and Vibration, 8, 68-76.
- 6. Gelman, L., Jenkin, P., Sanderson, M., Thompson, C. and Crocker, M.J. (2004) A New Generalized Approach for Feature Representation in Vibroacoustical Fault Diagnosis. The International Journal of Acoustics and Vibration, 9, 13-16.
- 7. Bonnardot, F., Randall, R.B. and Antoni, J. (2004) Enhanced Unsupervised Noise Cancellation Using Angular Resampling for Planetary Bearing Fault Diagnosis. The International Journal of Acoustics and Vibration, 9, 51-60.
- 8. Shnha, J.K. and Rao, A.R. (2005) Vibration Diagnosis of Failure of Mechanical Coupling between Motor and Pump Rotors. The International Journal of Acoustics and Vibration, 10, 89-92.
- 9. Gelman, L., Jenkin, P., Petrunin, I. and Crocker, M.J. (2006) Vibroacoustical Damping Diagnostics: Complex Frequency Response Function versus Its Magnitude. The International Journal of Acoustics and Vibration, 11, 120-124.
- 10. Ikuta, A., Orimoto, H. and Ogawa, H. (2011) Detection of Failure of Machine by Using the Higher Order Correlation Information between Sound and Vibration. The Journal of the Institute of Electrical Engineers of Japan, 131, 1600-1607.
http://dx.doi.org/10.1541/ieejeiss.131.1600 - 11. Ohota, M. and Ikuta. A. (1983) A Basic Theory of Statistical Generalization and Its Experiment on the Multi-Variate State for Environmental Noise—A Unification on the Variate of Probability Fluctuation Characteristics and Digital or Analogue Type Level Observations. The Journal of the Acoustical Society of Japan, 39, 592-603.