iBusiness
Vol. 4 No. 2 (2012) , Article ID: 19139 , 5 pages DOI:10.4236/ib.2012.42011
Empirical Study on the Distribution and Growth Trend of Biotechnology Patents in China
![]()
1School of Management and Economics, University of Electronic Science and Technology of China, Chengdu, China; 2Institute of Electronic Science and Technology, University of Electronic Science and Technology of China, Chengdu, China.
Email: shizg@uestc.edu.cn
Received December 28th, 2011; revised February 22nd, 2012; accepted March 3rd, 2012
Keywords: Biotechnology Patent; Biotechnology Industry; Spatial Distribution; Simulation Model; Overdetermined Equation; Matlab
ABSTRACT
Since 1980s, China has made great performance at economic growth, and greatly improved its innovation level. As one of the most important aspect of emerging technology industry, biotechnology industry has also gotten great development. And, as the most important representation index of innovation activity, number and growth of biotechnology patents are also significant. Using OECD’s standard of biotechnology patents as the method to collect the data of biotechnology patents, this paper got detailed data of biotechnology patents in China, including spatial distribution data across 31 provinces, autonomous regions, municipality directly under the central government, and time series data from 1985 to 2010. And further, this paper constructed quintic overdetermined equation of one variable to simulate the trend of patent number varying with the time from 1985 to 2010, made use of Matlab Software and took the solution of simulation model. After F-test, it is believed that the simulation model is reliable. Based on this model, scientific estimation about the distribution of biotechnology patents in China from 2011 to 2015 is presented.
1. Introduction
Since 1980s, world economy structure is undergoing a new round of major adjustment. High technology industries, such as biotechnology industry, rise quickly, which radiates and drives the development of the whole economy. Life science and biological technology is currently one of the most active fields among the innovations of science and technology, biological economy, led by life science and biotechnology, will cause profound changes to the global economic structure and great adjustment to the interest pattern. This entire situation makes global economy, science and technology development pattern undergo a profound and significant change. The overall trend of world economy growth has had a profound and important influence on the international protection of intellectual property rights. Economic competition between countries has already been translated into competition of patents. For developed countries, patent strategy is one part of its global strategy to monopolize the global market. More and more countries and enterprises realize that intellectual property is the most important strategic resource for improving their core competition capabilities [1].
As a member of WTO, China has its crucial task to develop high-tech industries in order to meet the challenge of globalization. As for biotechnology industry, China has also got great development since 1980s. By 2010, China’s biotechnology industry value has reached 500 billion RMB Yuan. In the field of high technology of China, biotechnology is the most possible field which can achieve leaping over. National Long-term Science and Technology Development Plan of China has incorporated biotechnology in and regarded it as the strategic focus during the next 15 years. In June 5, 2008, the Sate Council promulgated “Outline of the national intellectual property strategy”, decided to put intellectual property strategy into effect. Based on this situation, it is significant to find the rule of time series change and the spatial distribution across 31 provinces, autonomous regions, municipality directly under the central government in China, and supply some advices for government decisions by studying on the trend of patents quantities in China from the middle age of 1980s till now.
2. Definition of Biotechnology and Biotechnology Patent Classification
2.1. Definition of Biotechnology
In 2002, the OECD developed both a single definition of biotechnology and a list-based definition of different biotechnology techniques, the list-based definition of biotechnology was revised in 2005. The OECD recommends that statistical agencies provide both of these definitions to survey respondents when collecting data on biotechnology activities.
The single definition defines biotechnology as: “The application of science and technology to living organisms, as well as parts, products and models thereof, to alter living or non-living materials for the production of knowledge, goods and services [2]”.
The single definition got beyond all modern biotechnology but also many traditional or borderline activities. For this reason, the OECD recommends that the single definition always be accompanied by the list-based definition, which operationalizes the definition for measurement purposes.
The list of biotechnology techniques functions as an interpretative guideline to the single definition. The list is indicative rather than exhaustive and is expected to change over time as data collection and biotechnology activities evolve. In 2008, OECD member countries decided to begin work on revising and updating the listbased definition.
OECD list-based definition of biotechnology techniques [2].
DNA/RNA: Genomics, pharmacogenomics, gene probes, genetic engineering, DNA/RNA sequencing/synthesis/amplification, gene expression profiling, and use of antisense technology.
Proteins and other molecules: Sequencing/synthesis/ engineering of proteins and peptides (including large molecule hormones); improved delivery methods for large molecule drugs; proteomics, protein isolation and purification, signaling, identification of cell receptors.
Cell and tissue culture and engineering: Cell/tissue culture, tissue engineering (including tissue scaffolds and biomedical engineering), cellular fusion, vaccine/immune stimulants, embryo manipulation.
Process biotechnology techniques: Fermentation using bioeactors, bioprocessing, bioleaching, biopulping, biobleaching, biodesulphurisation, biotemediation, biofiltration and phytoremediation.
Gene and RNA vectors: Gene therapy, viral vectors.
Bioinformatics: Construction of databases on genomes, protein sequences; modeling complex biological processes, including systems biology.
Nanobiotechnology: Applies the tools and processes of nano/microfabrication to build devices for studying biosystems and applications in drug delivery, diagnostics etc.
2.2. Biotechnology Patent Classification
Patent index is one of an important element among a series of index which is used to measure biological activity, because it can reflect some information which the other indices can not reflect. Patents are important in all technical fields, as for the new and special fields such as biotechnology, patents may be even more important. In the field of biotechnology, patents are widely used to protect the invention; therefore, we can use the patent statistics to find some transitional process of biotechnology activities. Moreover, the patent for biotechnology establishments is very important, because a lot of enterprises have no other activities but for R & D, therefore, these enterprises do not directly utilize their invention, but sell them, or franchise to other enterprises. In this way, it is very important for legal protection.
From biotechnology patent indicators, the OECD members’ biotechnology activity level can be seen. However, in order to use patent information to get accurate understanding for biotechnology activity, it is very important to develop a powerful definition for biotechnology patents. In recent years, OECD has adopted various methods to carry out test work for developing biotechnology patent operable definition. Recently, a description type definition of biotechnology patents formed. This definition got beyond modern biotechnology (genetic engineering), while filtering out the non biotechnology patent. Patent classification experts extracted a form independently from the International Patent Classification (IPC) code; the basic conclusion is that this new plan will include biotechnology patents in the vast majority of proportion. At the fourth special session of biological statistics (2003), the biotechnology of refining the definition has been adopted.
Biotechnology patents is defined as follows, the code for International Patent Classification (IPC) in one of the following codes of the patent: A01H1/00, A01H4/00, A61K38/00, A61K39/00, A61K48/00, C02F3/34, C07G- 11/00, C07G13/00, C07G15/00, C07K4/00, C07K14/00, C07K16/00, C07K17/00, C07K19/00, C12M, C12N, C12P, C12Q, C12S, G01N27/327, G01N33/53*, G01N33/54*, G01N33/55*, G01N33/57*, G01N33/68, G01N33/74, G0- 1N33/76, G01N33/78, G01N33/88 and G01N33/92. Add: *Code also includes the lower level code. For example, the code in G01N33/53, the next level code, namely G01N33/532 also included [3,4].
3. Spatial and Technological Distribution of Biotechnology Patents in China
3.1. Technological Distribution
Using OECD’s standard of biotechnology patents as the method to collect the data of biotechnology patents, this paper searched different types of patents which apply and were authorized in China, including invention patens and utility model patents, we got detailed data of biotechnology patents in China, as shown in Tables 1 and 2, which represents the spatial and technological distribution respectively.
From Table 1, we can see, most of the biotechnology patents in China focus on the following technological fields, C12M (Apparatus for enzymology or microbiology), C12N (Micro-organisms or enzymes; compositions thereof), C12P (Fermentation or enzyme-using processes to synthesise a desired chemical compound or composition or to separate optical isomers from a racemic mixture), and C12Q (Measuring or testing processes involving enzymes or micro-organisms; compositions or test papers therefor; processes of preparing such compositions; condition-responsive control in microbiological or enzymological processes). These four technological fields patents account for 81.36% percent of total patents.
3.2. Spatial Distribution
From the aspect of spatial distribution, this paper searched biotechnology patents from the website of State Intellectual Property Office (SIPO), and got the patents applied in 31 provinces of China, the total number is 37,106, the distribution is shown at Table 2.
The histogram is shown in Figure 1.
Biotechnology patents are highly concentrated in a few provinces. Shanghai and Beijing account for 35.92% percent of total biotechnology patents in 31 provinces, autonomous regions, and municipality directly under the central government in China from 1985 to 2010. Shanghai, Beijing, Jiangsu, Guangdong, Zhejiang and Shandong account for 66.06% percent of total biotechnology patents. We can see the distribution of biotechnology patents is extremely unbalanced. The above six provinces and municipality directly under the central government are the most developed locations in China, and their innovation level are also high.
4. Trend of Biotechnology Patents in China
4.1. Data Source and Model Design
From the website of State Intellectual Property Office (SIPO), we can find the whole sum of patents of China
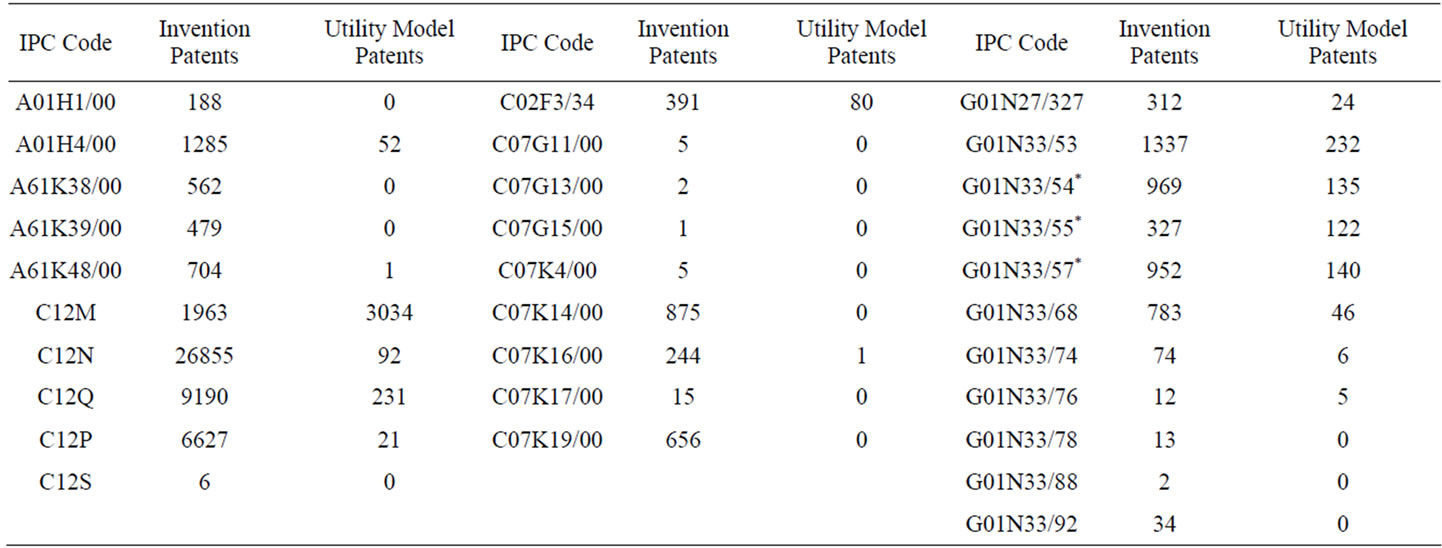
Table 1. Technological distribution of biotechnology patents in China.

Table 2. Spatial distribution of biotechnology patents across 31 provinces of China.
from 1985 to 2010, including invention patent and utility model patent, as shown in Table 3. In this paper, according to the patents number of each year, a simulation model of overdetermined equation group is constructed to describe the distribution and developmental trends of patents from 1985 to 2010. To verify the fitting degree of the simulation model, statistics test methods such as F test are used to verify the fitting degree. The whole solving process is underdone by Matlab software.
According to the data shown in Table 3, a trend curve of the number of patents (observed value) varying with the time (year) is drawn. Assume that there has one parallel curve intersect with the trend curve, k points are obtained. Regarding time (year)  as independent variable, number of patents
  as dependent variable, k overdetermined equation of one variable is constructed,

Figure 1. Histogram of spatial distribution for biotechnology patents in China.
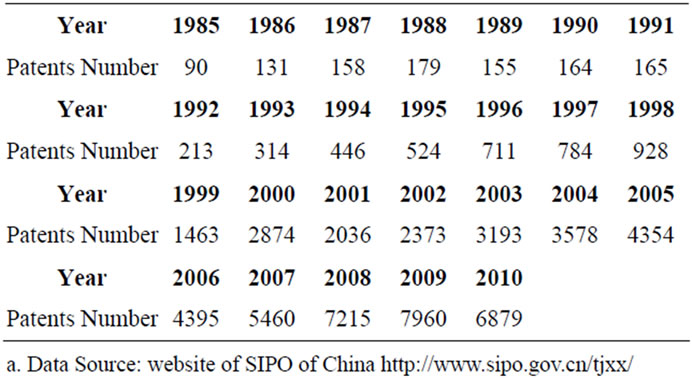
Table 3. Data of biotechnology patens of China from 1985 to 2010.
[5,6], as shown in Equation (1).
 (1)
(1)
In which,  ,
, 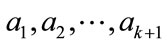 are constants.
In matrix forms, Equation (1) can be written as follows:
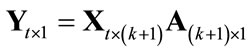 (2)
(2)
In which,  ,
,  ,
,
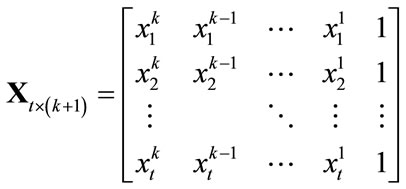 (3)
(3)
Take the year number shown in Table 1 into  of Equation (2), the data of patents into Equation (3), k overdetermined equation of one variable about parameter
  is gotten. Under this condition, parameter
  of Equation (2) has a least square solution
 , thus the equation
  has a minimum solution [7] which could be expressed as:
 (4)
(4)
Make use of Equation (1), and appoint , a quintic polynomial is utilized to process fitting. The total amount of patents is
 , time number is
 , and then the total amount of patents varying with the time can be expressed as:
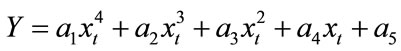 (5)
(5)
Take the data “whole Sum of Patents” shown in Table 1 into (5), and dissolve the overdetermined equation group constructed by (5), solutions of parameters are: a1 = –0.0549, a2 = 3.2026, a3 = –42.6734, a4 = 212.2423, a5 = –149.8777. The comparison figure between simulation curve and real curve is shown in Figure 2.
4.2. Forecast Data
From the above description, it is believed that the fitting degree between the simulated and real curve is good. The simulation model can be used to forecast the data of coming years. The forecast patents data of 2011, 2012, 2013, 2014 and 2015 are shown in Table 4.
From Table 4, it can be seen that the growth rate of
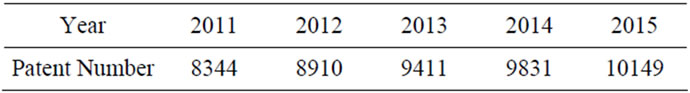
Table 4. The forecast data of the coming years.
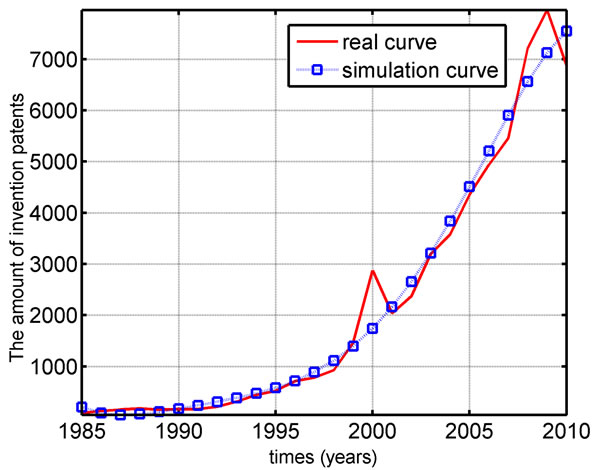
Figure 2. The comparison between simulation curve and real curve of biotechnolohy patents.
patents keeps about 30% in the coming years, and the growth rate of invention patents is slower than those of other two kinds of patents.
4.3. Test Method and Result
In order to test the reliability of the simulation model, Ftest method is used as below.
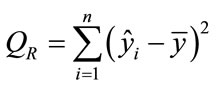
Total sum of squares of deviations:
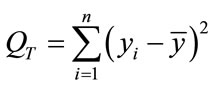 (6)
(6)
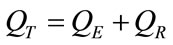
Equation (9) described the total dispersion degree of the observe value  for dependable variable
 . Decompounds
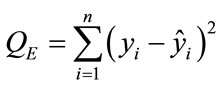
  to two parts, that is, square sum of residuals (
 ) and sum of squares of deviations in regression (
 ).
).
 (7)
(7)
In which
 ;
; 
test statistics:
 (8)
(8)
As for the given significance , test whether
  is bigger than
 .
.
To test Equation (5), n = 26, k = 6, QT = 1.5559e+008, QR = 1.5191e+008, QE = 3.6856e+006, 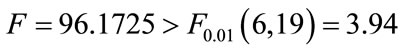
From the test result, we can conclude that Equation (5) reached the significance level.
5. Conclusion
Firstly, the most of the biotechnology patents in China focus on the following IPC codes, C12M, C12N, C12P, and C12Q. These four technological fields’ patents account for 81.36% percent of total patents. Secondly, the spatial distribution of biotechnology patents in China is extremely unbalanced, several comparatively developed locations, including Shanghai, Beijing, Jiangsu, Guangdong, Zhejiang and Shandong, account for 66.06% percent of total biotechnology patents. Thirdly, the trend of biotechnology patents number varying with time from 1985 to 2010 in China can be explained by quintic overdetermined equation of one variable. The fitting degree is well. Under the F-test, the significance level of the simulation model is also good. From the simulation model, we can get the forecast data about the several coming years. It is helpful for decision support. And finally, the simulation curve is steep, especially after 2000, it shows that self-innovation strategy of China has taken great effect in the decades.
REFERENCES
- Y. J. Zhang, “Document Overview on Chinese Patent Strategy Research from 2000 ~ 2009,” Science and Technology Management Research, No. 2, 2011, pp. 174-182.
- B. van Beuzekom and A. Arundel, “OECD Biotechnology Statistics 2009,” Organization for Economic Co-Operation and Development, Paris, 2009. http://www.oecd.org/LongAbstract/0,3425,en_2649_34451_42833899_119656_1_1_1,00.html
- M. Schaaper, “The Estimating Method of Biotechnology Industries in OECD Countries,” Science and Technology Management Research, No. 6, 2004, pp. 4-6.
- B. van Beuzekom and A. Arundel, “OECD Biotechnology Statistics 2006,” Organization for Economic Co-Operation and Development, Paris, 2006. http://www.oecd.org/dataoecd/51/59/36760212.pdf
- Z. Q. Ge and J. Yang, “The Experimental Study on the Patent Application of Universities and Colleges in China,” Journal of UESTC of China, Vol. 35, No. 2, 2006, pp. 285-286.
- Z. Q. Ge, B. Zhang and T. Jin, “An Empirical Study on the Relationship between Input of R & D and Patent in China,” Proceedings of 2004 International Conference on Management Science and Engineering, Orient Academic Forum Beijing-Sidney, 15-25 September 2004, pp. 118-120.
- B. J. Li and H. Y. Liu, “A Solving Method of Overdetermined Systems,” Journal of Shenyang University of Technology, Vol. 24, No. 1, 2002, pp. 76-77.