iBusiness
Vol.2 No.1(2010), Article ID:1435,18 pages DOI:10.4236/ib.2010.21001
Immigrant Entrepreneurs: The Face of the New Nashville
![]()
Director Office of International Business Programs, College of Business, Tennessee State University, Nashville, USA.
Email: GHULL@Tnstate.edu
Received September 27th, 2009; revised November 12th, 2009; accepted December 16th, 2009.
Keywords: Immigrants, Refugees, Entrepreneurship, Entrepreneurs, Nashville, Small Businesses, Foreign-Born Business Owners, Hispanics.
ABSTRACT
This paper examines the remarkable growth of the foreign-born population in Middle Tennessee over the past couple of decades and the significant role that immigrant entrepreneurs are playing in the economic development of the region. The largest segment of the foreign-born is Hispanic, with Mexico accounting for the greatest percentage, and sizeable numbers of Kurds, Somalis, Sudanese, and Laotians. The Chinese and Indian communities are prominent in business. At the same time, the issue of illegal immigration is working its way to the top of the legislative agenda in the U.S. Congress, making it all the more important for us to document this phenomenon. Middle Tennessee, comprising the greater Nashville metropolitan area, is now home to thousands of new residents from around the world, earning it the sobriquet as one of the nation’s New Ellis Islands. Since the 1970s research has confirmed the important contribution that the small business sector is making to the U.S. economy, accounting for a large portion of job creation and innovation. Richard Herman and Robert Smith, in their recent book entitled Immigrant, Inc., make the case that immigrant entrepreneurs are driving the new American economy and will save the American worker. The paper draws upon research conducted by faculty and graduate students in the College of Business at Tennessee State University during 2008-2009. With funding from the Tennessee Board of Regents, a College of Business team conducted a series of focus groups, face to face interviews, and an extensive questionnaire in the fall of 2008 and spring of 2009. On three occasions the TSU team hosted public forums in which the results of the survey were shared with those participating in it as well as public officials responsible for economic and community development. Team members relied upon the intermediary services of immigrant chambers of commerce and other community organizations with ties to foreign-born business owners. In the course of the survey the Metro Nashville government conducted a referendum on a proposal to require an English Only amendment on public documents. The Mayor’s Office and Nashville Chamber of Commerce lobbied against the amendment, which was roundly defeated. But it was a coalition of immigrant groups that rallied against the amendment, bringing them together in a common cause that made the difference. There is reason to believe that a New Nashville is taking form and finding its voice.
1. The Small Business Sector and the Foreign-Born in the U.S.
1.1 The Small Business Sector in the U.S.
For several decades students of the American economy have been aware of the important role that small businesses play in terms of job creation and innovation. While Fortune 500 firms have been losing jobs, companies with fewer than 500 employees have come to account for a greater share of employment. Indeed the so-called “gazelles”, small businesses that grow at a sustained rate of 20% or more a year for five years, account for much of the innovation in the economy.
The SBA Office of Advocacy regularly produces a series of working papers on the U.S. small business sector. In the fall of 2008 the staff prepared a paper for presentation at a conference in which the U.S. presidential elections were the focus of attention. In the paper Chad Moutray, Chief Economist in the Office of Advocacy, provided an overview of challenges and opportunities for entrepreneurship in the U.S. economy. Drawing upon data from the U.S. Census Bureau’s Statistics of Business, Moutray laid out reasons why small businesses play a key role in the economy. In the first instance, they provide much of the net new job growth; between 2004 and 2005, 83% of all the new jobs in the U.S. were in businesses with fewer than 20 employees. “High-impact firms” (those that experience doubling of sales and employment over a four-year period) accounted for almost all of the private sector employment and revenue growth in the economy.
Moutray outlined five challenges that small business owners were likely to face in coming years.
Strengthening the Overall Economy. The nation is in the grip of an economic downturn; since December 2007, 760,000 non-farm jobs had been lost and the unemployment rate stood at 6.1%. Small businesses in particular have struggled to weather the storm. To get the economy moving again small businesses will have to play a key role through innovation and employment. Construction, an industry overwhelmingly dominated by small businesses, has been particularly hard hit with the loss of 558,000 jobs since January 2007.
Taxes and regulation. Small businesses frequently cite tax and regulatory policies as a major concern. They face disproportionately higher compliance costs per employee than their larger counterparts when complying with federal regulations. A number of tax changes are wet to take place in the coming years that may be more palatable to small businesses. On the regulatory front, it is anticipated that there will be an influx of new regulations at the federal level on issues ranging from homeland security to finance.
Cost and availability of health insurance. Health insurance premiums have risen sharply in the past decade, forcing many small business owners to make changes to the coverage they offer their workers, including sharing the costs with them or choosing not to offer health coverage at all. Of the 46 million Americans who do not have health insurance, many of them work for small businesses. Finding ways to control the cost of providing health insurance to employees and increasing coverage will therefore likely remain a priority.
Attracting and retaining a quality workforce. Small businesses must compete for labor with their larger counterparts. Firms that are able to offer benefits have a greater probability of retaining good employees than those who don’t. Demographic trends in the future are likely to exacerbate the challenges for small businesses in terms of employee recruitment and retention. With a growing number of employees retiring, small businesses will see a mass exodus of “institutional knowledge” that will be hard to replace in certain fields. This will also lead to labor shortages in some industries, especially in technology and health occupations.
Global competition. Not the least of challenges small businesses will face is globalization. Higher costs in the U.S. for taxes and regulatory compliance and energy expenditures have caused many firms to outsource abroad, thereby competing on price while focusing domestic production efforts in other areas. Even smaller businesses are being obliged to consider competing on a global scale. For some, advances in technology have allowed them to thrive in the global marketplace.
In sum, small businesses in the U.S. inject vitality and a competitive spirit into the economy that is not readily available from large businesses. They play a vital role in innovation, regional economic development, and the pursuit of new markets. They are responsible for half of the gross domestic product, employ over half of the private workforce, and generate the majority of new jobs. Furthermore, self-employment serves as an opportunity for many to better themselves by taking risks and generating new businesses.
1.2 Profile of the Foreign-Born in the U.S.
The Pew Research Center estimated that a record 12.7 million Mexican immigrants were living in the United States by 2008, a 17-fold increase since 1970. Mexicans now account for one-third of all immigrants living in this country. The second-largest nationality group of immigrants, Filipinos, account for just 5% of all immigrants in the U.S. [1].
More than half (55%) of the Mexican immigrants in the U.S. are unauthorized. Overall, Mexicans comprise about six-in-ten (59%) of the estimated 11.9 million unauthorized immigrants in the U.S. No other country in the world has as many total immigrants from all countries as the U.S. has immigrants from Mexico alone. Russia hosts the second largest number of immigrants, with 12 million foreign born, many of whom are natives of countries in the former Soviet Union.
Large-scale settlement in the U.S. by Mexicans began in earnest in the 1970s. By 1980, Mexico had the largest foreign-born population here with 2.2 million, or more than twice the second-place country (Germany at 850, 000). The number of Mexicans immigrants to the U.S. doubled from 1980 to 1990 and more than doubled from 1990 to 2000. While the growth rate of the Mexican immigrant population has slowed considerably since 2006, the total number reached a record 12.7 million in 2008, or almost 17 times the number in 1970. Mexicans make up the largest number of undocumented immigrants in the U.S. (7.0 million, or 59%) as well as the largest number of legal immigrants (5.7 million, or 21%).
The current Mexican share of all foreign born living in the U.S.—roughly one third—is the highest concentration of immigrants to the U.S. from a single country since the late 19th century. But it is not unprecedented. Irish immigrants represented a third or more of the immigrant population from 1850 to 1870. Germans were 26% to 30% of the foreign-born population from 1850 to 1900.
The ACS data for 2007 shows that among the foreign-born those from India, Australia, South Africa and the Philippines have the highest median household incomes. Residents born in India have the highest: $91,195. The foreign-born from Somalia and the Dominican Republic had some of the lowest median household incomes. Median household income is $50,740 for the total population, $46,881 for the foreign-born population and $51,249 for the native population. U.S. residents born in Somalia have the youngest median age (26.8). Nationally, the median age for the total U.S. population is 36.7. The total foreign-born population has a median age of 40.2 and the total native population has a median age of 35.8.
Some 81 percent of the foreign-born age 16 and over from Nigeria and Kenya are in the labor force, compared with only about 65 percent of the general U.S. population in this age group and 67 percent of the foreign-born population. U.S. residents born in India have the highest percentage of civilian-employed people working in management, professional and related occupations (69 percent). These occupations employ about 36 percent of the native civilian-employed U.S. population and 27 percent of the foreign-born. The foreign-born from Liberia and Haiti have the highest percentage of civilian-employed people working in service occupations (at 40 percent and 39 percent respectively, the differences are not statistically significant).
1.3 Contribution of Immigrant Business Owners to the U.S. Economy
Research conducted by Prof. Robert Fairlie under contract with the Small Business Administration [2] provides the most up-to-date summary of data available on the contribution of immigrant business owners to the U.S. economy. Fairlie draws upon three datasets: the Census 2000, 5 percent PUMS Sample, the Current Population Survey (CPS 1996-2007), and the Characteristics of Business Owners (CBO 1992). He presents several key findings from his study:
Immigrants are nearly 30% more likely to start a business than are non-immigrants; they represent 16.7% of all new business owners in the U.S.;
Immigrant business owners make significant contributions to business income, generating $67 billion of the $577 billion in U.S. business income, as estimated from the 2000 Census data. They account for one-quarter of all business income in California and nearly one-fifth of business income in New York, Florida, and New Jersey.
Immigrant business ownership is concentrated in a few states. Nearly 30% of all business owners in California are immigrants compared with roughly 12.5% of the population of U.S. business owners. In New York, New Jersey, Florida and Hawaii foreign-born business owners account for more than 20% of the total.
In California, immigrants are 34% of the new business owners each month, while 30% of all new business owners in New York Florida, and Texas are immigrants.
Immigrants own 11.2% of businesses with $100,000 or more in sales and 10.8% of business with employees.
The contribution of immigrant businesses differs across sectors of the economy. They own a large share of businesses in the arts, entertainment, and recreation as well as services and transportation.
Although business owners from Mexico constitute the largest share of immigrant business owners, total immigrant business ownership, formation, and income originate with immigrant owners from around the world.
Drawing upon 2000 Census data in his discussion of business ownership, Fairlie points out that the immigrant share of all business owners compares favorably to the immigrant share of the work force. Immigrants constitute 12.2% of the U.S. work force, suggesting a higher business ownership rate than the U.S.-born rate. In fact, 9.7% of immigrants own a business, compared with 9.5% of the U.S.-born work force. The source countries of immigrant business owners in the U.S. are quite diverse. The largest contributing country is Mexico, with 255,300 business owners representing 2.22% of all business owners in the U.S. Korean immigrant owners make up the second largest share of immigrant owners (78%) followed by Indian, Chinese, and Vietnamese.
Using education as a proxy variable for skill level, Fairlie concludes that immigrant business owners make up the largest share of the least educated business owners; slightly more that 28% of all business owners with less than a high school degree are immigrants. However, the largest educational group among immigrants is college graduates who constitute 31% of the all immigrant business owners and 11.9% of all business owners with a college degree. Similar to the analysis by skill level, Fairlie notes that immigrant business owners make significant contributions to the U.S. economy in several industries. More than one-fifth of all businesses in the arts, entertainment, and recreation industry are owned by immigrants, double the portion of immigrant contribution to all industries. Immigrant-owned businesses also contribute substantially to other services (17.6%), transportation (16.9%), wholesale trade (15.9) and retail trade (15.5%). Geographically, immigrant businesses are heavily concentrated in four states: California, New York, Florida, and Texas. Immigrant contributions to business ownership in all these states are considerably higher than the national average of 12.5%.
Looking at business formation, Fairlie seeks to capture the dynamics of business creation among immigrants. To do so, he estimates the number of new immigrant business owners in the U.S. and makes comparisons to the total number of new business owners. Using data from the CPS (1996-2007), Fairlie notes that 81,000 immigrants started businesses each month, representing 16.7% of all new businesses in the U.S. for this period. This is higher than the share of all business owners or of the work force. Immigrants are found to be creating businesses at a faster rate than non-immigrants. The largest number of new businesses is created by immigrants from Mexico, who account for 4.8% of all business starts in the U.S. Business formation is distributed broadly across many other immigrant groups.
How much do immigrant-owned businesses contribute to total business income in the U.S.? How much value do they create in the economy? Fairlie points out that this is a difficult question to answer because one must rely on the data from the 2000 Census and the 1992 Characteristic of Business Owners (CBO). According to the 2000 Census data, the total business income for immigrants was $67 billion, representing 11.6% of all business income in the U.S. which was $577 billion. The immigrant representation of total business income is lower than the representation of the total number of business owners, suggesting that immigrant-owned businesses have lower average incomes. Average Immigrant-owned business income was $46,614, compared with $50,643 for non-immigrants. Business income generally increases with the age of the owner and is also related to level of education.
Immigrants from Mexico provide the largest contribution to total U.S. business income, at 1.2%. Korean and Indian immigrants make relatively large contributions to total business income, but overall contributions are spread across a wide range of immigrant groups. Not surprisingly, most business income for both immigrants and the overall economy is produced by the most educated business owners. Among immigrants, the total business income of college graduate business owners represents 52% of all immigrant-owned business income, roughly the same as for all business owners.
On a subject of particular importance—employment generation—the Fairlie study provides very little information. Again, drawing upon the 1992 CBO data, he reports that immigrant-owned firms constitute 8.9% of all firms with no employees, whereas immigrants own 10.8% of all firms with some employees. Fully 77.8% of all immigrant-owned firms were reported as having no paid employees and 15% had fewer than five employees. Only 0.1% of immigrant firms employed more than 100 employees. It is fair to conclude that the overwhelming majority of immigrant businesses belong in the small business sector.
In their new book, Immigrant, Inc., authors Richard Herman and Robert Smith argue that immigrants constitute a culture of entrepreneurship. The authors describe a culture of hard work, education, thrift and innovation as well as a thirst for adventure that is characteristic of immigrant business owners. They note that immigrant entrepreneurs are twice as likely as native-born Americans to start a business. They established more than half of the technology companies in Silicon Valley and a fourth of those nation-wide. They file patents at twice the rate of American-born. Immigrant entrepreneurs are more likely to earn an advanced college degree than are American-born. And, as residents of the Cleveland area, the authors point out that immigrant talent is beginning to be viewed by some “rust belt” cities as a catalyst for economic revival. Relying less on a barrage of statistics than images, Herman and Smith paint portraits of foreign-born entrepreneurs from around the world who have enjoyed remarkable successful. A leitmotif of Immigrant, Inc. is the reminder that America is indeed a nation of immigrants who have provided the leavening for entrepreneurial achievement.
2. Nashville: A New Ellis Island
2.1 Center for Immigration Studies—New Ellis Islands—2001
In 2001 the Center for Immigration Studies undertook a study of trends in immigration in the U.S. in which they described the development of “new Ellis Islands” [3]. The authors noted that an estimated 1.3 million legal and illegal immigrants now settle in the country each year. In the past immigrant settlement was mostly confined to relatively few states, with California, New York, and Florida accounting for more than half of the nation’s foreign-born population. While immigrants still tend to be concentrated in a few states, the Center of Immigration Studies study revealed that there is growing evidence that immigrants are increasingly settling in areas that until recently were largely unaffected by immigration. Although Camarota and Keeley were not able to avail themselves of 2000 Census data, they attempted to identify new areas of immigrant settlement based on analysis of immigrant arrival data provided by the Immigration and Naturalization Service (INS).
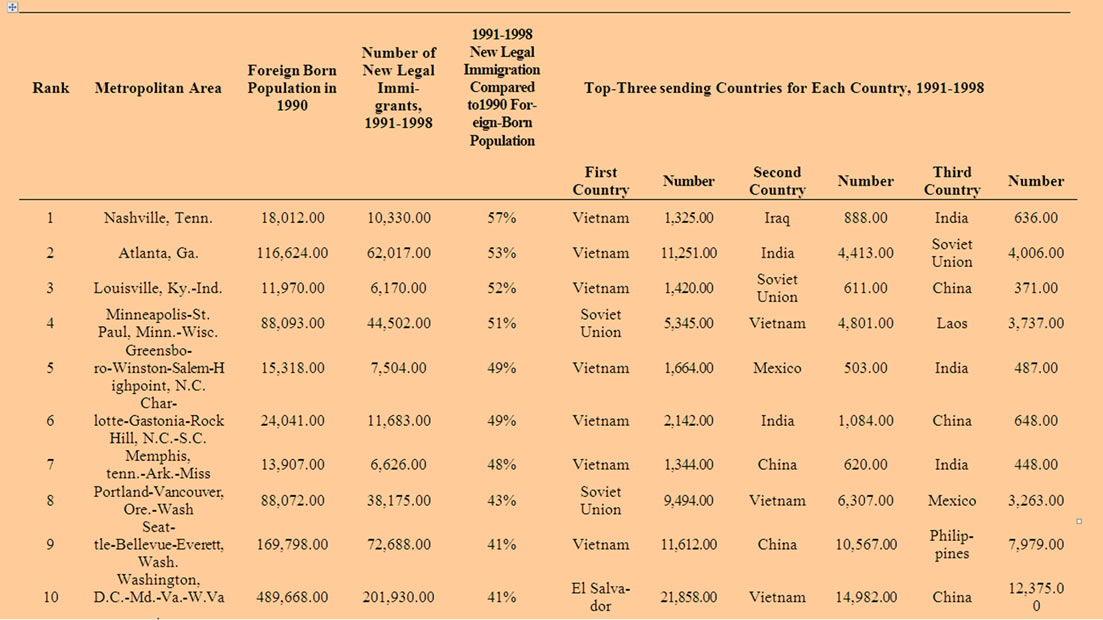
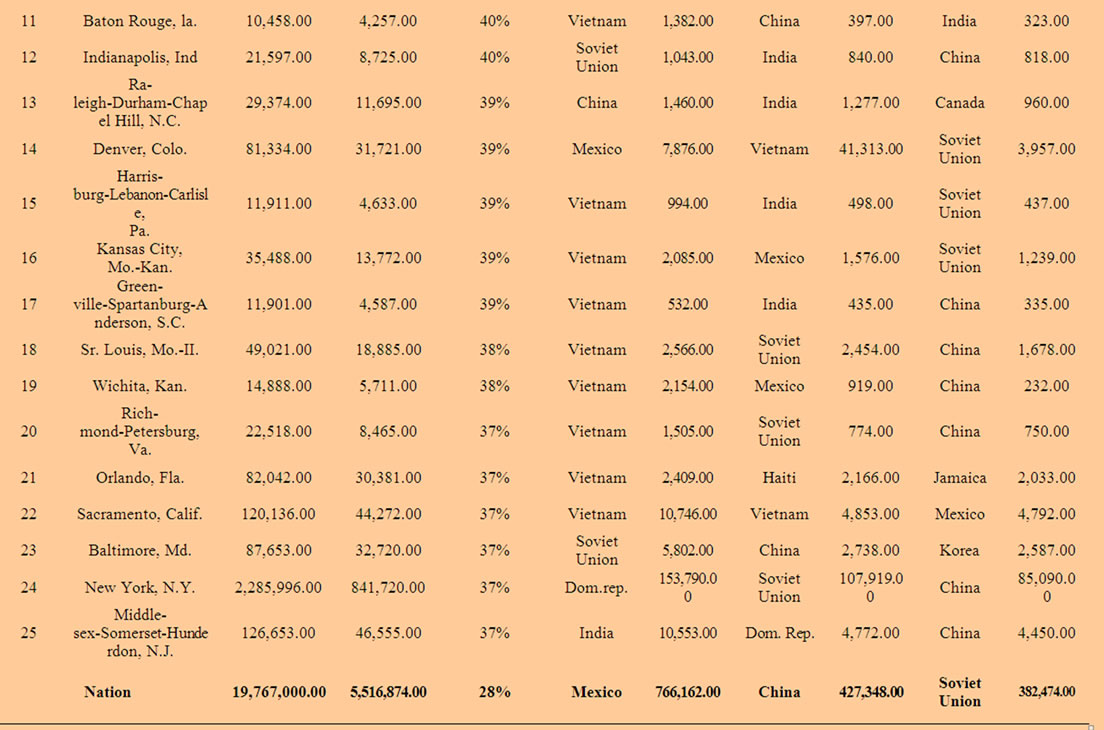
The Camarota and Keeley study compared the size of the foreign-born population in the 1990 Census with the number of new legal immigrants (those receiving green cards) who arrived from abroad between 1991 and 1998, as determined by the INS. Excluding counties with very small immigrant populations, those counties in which the number of new legal immigrants (1991-1998) was equal in size to at least 50 percent of the existing foreign-born population in 1990 were designated as “New Ellis Islands”. Some of the key findings from the study were:
One out of 14 counties in the United States—223 of the 3,141 that comprise the U.S.—met the criteria of a New Ellis Island. While these counties can be found throughout the United States, the new areas of immigrant settlement were mainly in the South with 131, and the Midwest, with 75 counties.
The state with the most counties identified as New Ellis Islands was Georgia, with 25, followed by Minnesota and Kentucky with 18 counties each. Virginia had 13 such counties, while Tennessee and North Carolina had 12 each.
The new areas of immigrant settlement tended to be associated with either immigration from Mexico or India or with refugee resettlement. Mexico was the leading sending country in 82 counties (37 percent) that qualified as New Ellis Islands. It was followed by India, the top-sending country in 35 counties (16 percent). Refugee-sending countries (primarily Vietnam and the former Soviet Union) were the leading sending countries in 50 counties (22 percent).
Nashville ranked first in the number of new immigrants (1991-1998) relative to its foreign-born population in 1990 in the nation’s 100 largest metropolitan areas. Atlanta was second and Louisville third.
Table 1 (Metro Areas Ranked by Size) shows the top 25 MSAs ranked by the number of new immigrants (1991-1998) relative to the size of their 1990 foreignborn populations. The top city of new immigration was Nashville, followed by Atlanta and Louisville. Many of the cities were to be found in the South. Of the 25 metropolitan areas in the list, 13 were in the South. Analysis of the top sending countries showed that in most of these cities, refugee-sending countries lead the list. Vietnam or the former Soviet Union was the leading sending countries in 20 of the 25 metro areas. There is also significant diversity in legal immigration in most of these areas. In only three of the cities did the top sending country account for 25 percent or more of legal immigration. There were a number of major metropolitan areas that were experiencing significant immigration that until recently had been largely unaffected by immigration.
2.2 Vanderbilt Institute for Public Policy Studies: Immigrant Community Assessment 2003
In 2003 the Metropolitan Government of NashvilleDavidson County awarded a contract to the Vanderbilt Institute for Public Policy Studies (VIPPS) to conduct an Immigrant Community Assessment [4]. The study was to gauge the adjustment of immigrants in the Nashville community and to assess the level of services available to them. The research project was designed to accomplish five assessment goals identified by the Metropolitan Government. These included an understanding of the changing demographics and economic behaviors of the immigrant population, an analysis of available resources to the communities and methods of linking them to existing programs, and an assessment of how well immigrants were being integrated into Nashville. The study included a list of recommendations associated with each of seven themes intended to maximize mutual understanding between native and foreign-born residents. The VIPPS team consisted of researchers in various disciplines from several local institutions.
The assessment focused on themes for strengthening Nashville’s public and private social services. Those services discussed by the immigrants with greatest frequency included education (adult and children), employment, health, housing and safety. The ethnic groups that participated in the focus group sessions included Arabic, Hispanic, Kurdish, Laotian, Somali, and Vietnamese. Each expressed needs unique to its community. Among the themes explored in the assessment was an increase in the availability of the curriculum of English-language instruction, the development of community-base social service agencies in areas where immigrants and refugees reside, and an increase in the accessibility of employment, housing, and service provided. A final recommendation was to establish an on-going countrywide organization dedicated to immigrant and refugee affairs. It is important to note that the VIPPS assessment did not pay particular attention to immigrant businesses or their concerns.
2.3 Building the New American Community—2003
Nashville was one of three American cities selected to participate in an experiment in public-private partnerships of immigrant and refugee integration primarily, funded by the U.S. Office of Refugee Resettlement. The project, known as Building the New American Community, sought to identify challenges to the integration of immigrants into the larger population [5]. Under project auspices, the Urban Institute prepared a demographic profile of the foreign-born population which included data on immigrant population growth, diversity, settlement patterns, English language ability, poverty, and citizenship trends. The profile of the Nashville Economic Market consisted of the Nashville Metropolitan Statistical Area (Cheatham, Davidson, Robertson, Rutherford, Sumner, Williamson, and Wilson) plus Maury and Montgomery Counties. Data for the paper were derived from the 2000 U.S. Census as well as the U.S. Immigration and Naturalization Service (INS) Statistical Yearbook.
Although the share of the Nashville Economic Market’s foreign-born population (5%) was less than half the national average of 11%, nevertheless the rate of immigration growth in the region grew rapidly. Between 1990 and 2000 the growth was 203%, four times the national average. For same period, the rate of growth for the state of Tennessee was 169%, placing it sixth in the nation in the rate of immigrant population growth. Even so, only 3% of the state’s population in 2000 was foreign-born. Latin Americans constituted the largest single geographic group among the foreign-born at 40%, although there were significant representations from other regions (Asia and Middle East (32%), Europe (16%) and Africa (6). Mexico was by far the largest country of origin of immigrants in the Nashville area with 27%, followed by Germany, Korea, Laos, Canada, India, and Iraq. The African significant portion of the Latin American immigrants
*Analysis limited to 100 largest MSAs. Figures for China include Hong Kong and Taiwan.
Table 1. Metro areas ranked by relative size of 1991-1998 new legal immigration to 1990 foreign-born population population (8%) was more than double the national average; the largest African groups were from Nigeria, Egypt, Ethiopia, and East Africa.
The 2003 Urban Institute paper noted the large discrepancy between the Census data and the INS admissions data; the latter includes only records for legal immigrants admitted in a given year. According to the Census data for the period from 1990 to 1998, 49% were born in Latin or North America, nearly three times the percentage indicated by the INS admissions data (legal immigrants). This was in sharp contrast to the other regions of the world. The conclusion to be drawn is that a significant portion of the Latin American immigrants were undocumented, whereas immigrants from the other regions were mostly legal.
The heaviest concentrations of the foreign-born population were to be found in the Davidson County (Nashville) neighborhoods of Glenview and Mercy Oaks (along Nolensville Road) where they comprised 25 to 34% of the total population. This was five times the average of 5% in the total economic market area. In addition, concentrations of Latin Americans were to be found in Ft. Campbell, Springfield, Gallatin, Columbia, and Murfreesboro. Asians were clustered in Ft. Campbell, Clarksville, Brentwood, and Murfreesboro.
Within the Nashville Economic Market some 31% of the immigrants were naturalized citizens, slightly lower than the national average of 40%. The lower rate may be explained by the fact that a large portion of the immigrants arrived after 1995. Of these, Asians (including Middle Easterners) comprised the largest group (41%), followed by Latin Americans (25%), Europeans (23%) and Africans (7%). Latin Americans had the lowest naturalization rate (19%) in the Nashville area and also lagged behind the national rate (30%). Fully 70% of Latin American immigrants are new arrivals. Furthermore, the INS data revealed that many were undocumented and therefore ineligible for citizenship.
2.4 Carnegie Reporter—Nashville: The Global Interior—2005
The Carnegie Reporter devoted a lengthy story to immigration in Nashville [6], noting that a city with a predominantly white population known for its country music, rhinestone cowboys and fried chicken and biscuits had suddenly morphed into a new Ellis Island! The article described Nashville as typical of the new, nontraditional settling grounds where foreign-born newcomers find an abundance of jobs, housing, lower prices and, sometimes, friendlier receptions. In the light of an unprecedented influx of foreign-born individuals and families, the city assembled businesses, government, religious and community organizations to grapple with its new role as a global destination. This made the city and region a national leader in superlatives: Tennessee was the first state to issue drivers’ licenses for documented and undocumented immigrants. The city housed one of five U.S. polling stations in America for Iraqi expatriate voters during the January 2005 Iraqi elections.
All of this provoked an anti-immigrant backlash and coalitions were formed to control the growth of undocumented immigrants. Nashville became part of a new American frontier sometimes labeled the “global interior” that runs from Minnesota to Texas where immigrants and refugees have moved in unprecedented numbers since 1990. Nontraditional communities have also become a haven for Iranians and Iraqis after the Persian Gulf War and terrorist attacks, Somalis and Sudanese evading political turmoil, Russian Jews seeking religious tolerance and Bosnians escaping ethnic cleansing. Tennessee’s foreign-born population grew by 169 percent between 1990 and 2000, and the state ranked sixth in the nation in the rate of its foreign-born population’s growth. It is the nation’s fourth fastest growing state in Hispanic population. Within Tennessee, most of the newcomer population flocked to Nashville in Davidson County and seven other adjacent outlying counties of middle Tennessee. By 2005 one-in-seven of Nashville’s 570,000 residents were foreign-born.
Nashville’s foreign-born population grew even more rapidly than the rest of Tennessee, almost four times as fast as the national average. And this rate was likely much higher because large numbers of undocumented immigrants are not counted by the census. Unlike previous generations, today’s immigrants and refugees simultaneously maintain cultural, political, economic and social ties to two or more societies. And one of their greatest challenges is integrating not only with the American culture, but also with the multiple cultures of other newcomers.
One of the first groups in Nashville to perceive the influx of immigrants and refugees were local businessmen who readily employed the newcomers arriving in the city looking for jobs. During the 1990s, the metropolitan area added 260,000 jobs, mainly due to the establishment of Nissan, Saturn and Dell manufacturing plants. Employers were happy to tap into the abundant supply of immigrants and refugees—even if they didn’t speak English—to work in factories, on construction sites and in restaurants and stores. Nashville-based Gaylord Entertainment—which has expanded its legendary Grand Ole Opry to include an entertainment division and a chain of hotels and resorts, including the 2,884—room Opryland Hotel in Nashville—houses its foreign-born workers at smaller, off-site hotels and provides English-as-a-Second Language (ESL) classes. One large Nashville construction company reported that one-fourth of its employees were Hispanic. A meatpacking plant near Nashville reported that 40 percent of its 1,600 employees were from foreign countries and spoke 13 different languages.
But the immigrant workers also brought problems with them: poverty, illegal status and language barriers all became issues. Currently, eighteen percent of the foreign-born population in Nashville lives below the federal poverty level ($17,050 for a family of four in 2000), almost double the rate for the total city population. Almost half of the foreign-born population speaks limited English. Three-fourths are not citizens and, therefore, are civically isolated and politically disenfranchised. The public school superintendent has increased the number of ESL classes for a student body that speaks 80 different languages, but the increases cannot keep pace with the demand and the number of classes and teachers is lacking.
2.5 Tennessee’s Population
The U.S. Census Bureau’s American Community Survey
(ACS) estimated that in July 2007 Tennessee’s population had increased by an annual average of about 64,035 residents since 2000 (to 6,156,719 residents). Over that period net immigration was adding about 8,345 persons each year. During the same period there was a net annual average population gain of about 29,745 residents from net domestic migration (more native-born residents arriving than leaving). Net immigrant settlement accounted directly for more than one-eighth (13%) of the total population increase over this period, and that does not take into account the children born to the immigrants after their arrival in the United States.
The 2000 Census found 5,689,283 persons resident in Tennessee, an increase of 812,098 persons above the 1990 Census (16.7%). The amount of increase was the 12th highest in the country. The rate of increase was the 14th fastest increasing population in the country. The 2000 population was about 32,000 more persons than the Census Bureau had expected to find in the state when it issued its most recent state population projections in 1996. The significance of this is that the Census Bureau concluded that much of the shortfall in their population estimates during the 1990s was due to an underestimation of the illegal alien population. Between 1980 and 1990 Tennessee’s overall population increased by 6.2 percent (from 4,591,023 to 4,877,185 residents).
2.6 Tennessee’s Foreign-Born Population
The Federation for American Immigration Reform (FAIR) is a national, nonprofit, public-interest, membership organization of concerned citizens who share a common belief that the nation’s immigration policies must be reformed to serve the national interest. Founded in 1979, FAIR seeks to improve border security, stop illegal immigration, and promote immigration levels consistent with the national interest—more traditional rates of about 300,000 a year. The FAIR website quotes statistics from the U.S. Census Bureau, providing its own estimates of demographic trends. FAIR is generally critical of the Census Bureau’s tendency to under-count illegal immigrants (http://www.fairus.org).
FAIR estimates that the foreign-born population of Tennessee was about 248,820 residents in July 2007, a four percent share of the total population. The amount of change since the 2000 Census indicates an average annual rate of increase in the foreign-born population of about 12,305 people, which is nearly one-fifth (19.2%) of the state’s annual average population increase. Since 2000, the foreign-born population has increased by 56.5 percent compared to a 6.8 percent increase in the native-born population.
Immigration also contributes to population growth through the children born to immigrants in this country. Nationally the share of births to the foreign-born is about double their share of the population. An eight percent share of Tennessee’s current births is large enough to account for about 6,415 births a year. Combining the increase in the foreign-born population and estimated immigrant births suggests that immigration may account for adding about 18,715 persons to the state’s population annually, i.e., nearly three-tenths (29.2%) of the state’s overall population increase. The 2000 Census recorded 159,004 foreign-born residents in the state (Table 2 Summary of Tennessee Demographic Data). That was 2.8 percent of the state’s overall population and an increase of 169 percent above the 1990 foreign-born population of 59,114 residents. That more than doubling of the immigrant population was much higher than the 14.8 percent increase in the native-born population. The amount
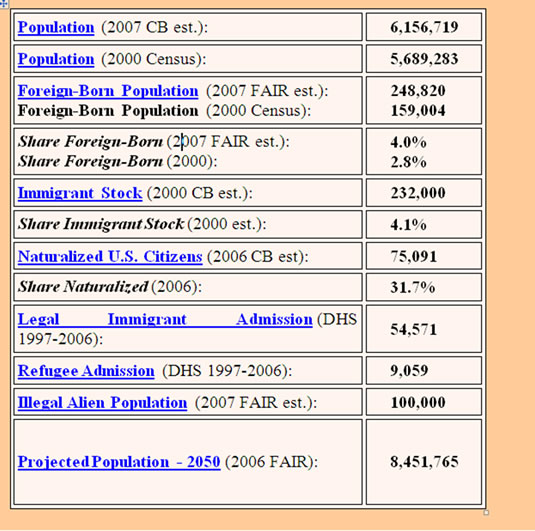
Table 2. Summary of Tennessee demographic data (and source)
Source: http://www.fairus.orgof increase was the 20th highest in the country. The rate of increase in the foreign-born population was the sixth highest in the country.
A comparison of the increase in the immigrant population from 1990 with the change in the overall population during the same period shows that immigrant settlement directly accounted for 12.3 percent of the state’s overall population increase over that decade. The share of the population increase due to immigration would be still higher if the children of the immigrants born here after their arrival were included with their immigrant parents in the calculation. The amount of the overall impact of immigration on population change (immigrants plus their children) is more likely to account for about 16 percent of the state’s population increase, based on the increase in the share of those who speak a language other than English at home in Tennessee.
The 2000 Census found that 57.7 percent of Tennessee’s foreign-born population had arrived in the state since 1990 Table 3 Speakers of Foreign Languages at home).
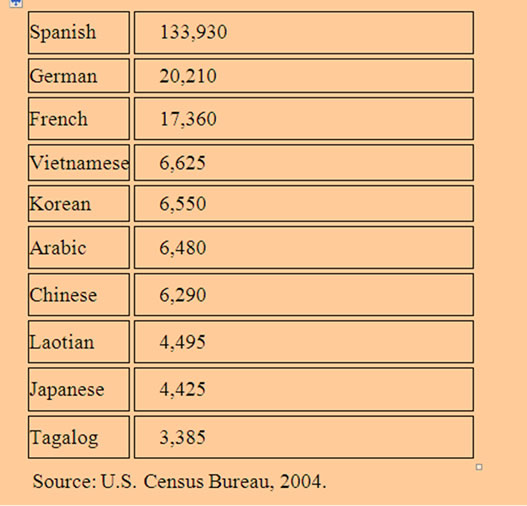
Table 3. Speakers of foreign languagesat home in Tennessee
This demonstrates the effects of the current mass immigration, and it is a much higher share than the national average (43.7%). An indicator of the change in the immigrant population may be seen in data on the share of the population that speaks a language other than English at home. Between 1990 and 2000 the share of non-English speakers at home in Tennessee increased from 2.9 percent to 4.8 percent. Less than half (42.2%) of those who said they spoke a language other than English at home in 2000 also said they spoke English less than very well.
The Census Bureau’s American Community Survey found that in 2006, the foreign born population was 236,516 residents, an increase of 56.7 percent since 2000. By comparison, the foreign-born population changed from 59,114 to 159,004 residents between 1990 and 2000, an increase of 169.0 percent.
Ten countries constituted approximately 56.4% of the foreign-born population in Tennessee in 2006,
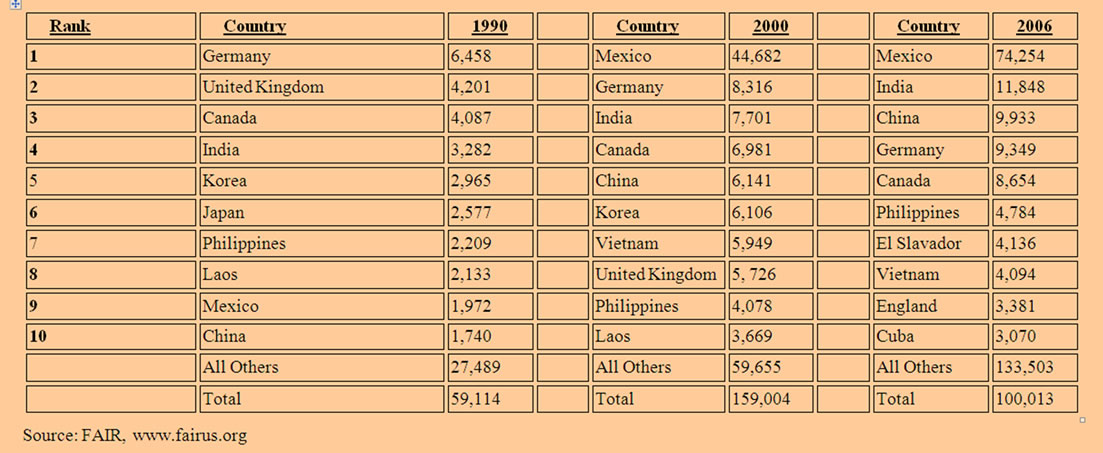
Table 4. Tennessee foreign-born change since 1990: top ten countries 1990-2006
(Table 4 Tennessee Foreign-Born Change 1990-2006). Of the total foreign-born population, Mexico alone accounted for nearly one third (31.9%). In 1990 the top five countries accounting for the foreign-born in Tennessee were Germany, the U.K., Canada, India, and Korea. Ten years later the top five countries were Mexico, Germany, India, Canada, and China.
2.7 Small Businesses in Tennessee
The small business sector in Tennessee mirrors its importance on the national level. According to the Small Business Administration’s Office of Advocacy, figures for 2006 indicate that Tennessee counted 100,607 small business employers (<500 employees), whereas large employers numbered only 2,952 (http://www.sba.gov/advo).
There were 436,143 businesses that had no employees. Thus, small businesses represented over 97% of the state’s employers and 45% of its private-sector employment. The health care and social assistance industry was Tennessee’s largest small business employer while manufacturing was the largest overall employer. Small businesses created 39.7% of the state’s net new jobs from 2004 to 2005. Figures from 2002 showed that there were 7,241 Asian-owned businesses and 4,301 Hispanic-owned businesses in Tennessee.
3. Recent Immigration Issues in Middle Tennessee
3.1 Office of Research and Education Accountability—2007
In 2007 the Office of Research and Education Accountability (OREA) in the Tennessee Comptroller of the Treasury undertook a study of immigration issues in the state [7]. The primary focus of the resulting OREA briefing paper was on the scope and degree of the impact of unauthorized aliens on the state public policy and services. The OREA study also sought to address the question of what the role of the state should be with regard to the immigrant population. The OREA report noted that state-specific data of unauthorized aliens was limited. OREA relied primarily on U.S. Census data, which estimates the number of unauthorized aliens based on a residual methodology taking figures for foreign born and subtracting counts for those with a legal status from the Department of Homeland Security.
Drawing upon data from the 2000 and 2005 U.S. Census American Community Survey, the OREA report observed that 45% of the 2005 foreign-born population in Tennessee was from Latin America, of which 29% was from Mexico. About 29% were from Asia and 13% from Europe. Seventy percent of the state’s foreign-born population resided in the metropolitan (MSA) counties. The Nashville MSA accounted for 36% while the Memphis MSA had 22%. Relying upon data from the Pew Research Center, the OREA study reported estimates of between 100,000 and 150,000 unauthorized aliens in Tennessee in 2005, representing only about two percent of the total population. Most of the unauthorized aliens have come from Mexico (56%) and another 22% from the rest of Latin America, mainly Central America.
The OREA briefing paper described some of the costs to state government from unauthorized aliens, but did not attempt to provide a specific estimate of the overall impact on the economy. However, it noted that unauthorized aliens are not eligible for most public benefits, with the exception of elementary and secondary education and emergency and public health care. In terms of higher education, unauthorized aliens may be admitted to public colleges and universities in the state but are not eligible for in-state tuition or financial aid. The OREA paper ventured only a couple of modest recommendations. Among them was the suggestion that state agencies such as the Department of Safety and Health continue to assist in providing the federal government with means of worker verification. This could make it easier to identify unauthorized aliens and exclude them from jobs and services as currently required by federal law.
American Community Survey figures for 2006 show a total of 60,854 foreign-born in Davidson County, of whom 45,076 were not U.S. citizens and only 15,778 were naturalized citizens (see table below). Of these, 35,874 entered the U.S. before 2000 and the remainder thereafter. The Latin American region accounted for 26,140 of the foreign-born population, whereas Asia accounted for 15,833 and Africa 11,769. Within the population five years and older, a substantial number of the total population, nearly 33,000 spoke Spanish at home.
4. Profiles of Selected Refugee and Immigrant Groups in Middle Tennessee
Nashville’s refugee population has grown in both size and diversity since the 2000 Census (Table 5).
Davidson County, Tennessee Selected Social Characteristics). State Department figures show that Nashville ranks 28th in the nation in refugee resettlement, with at least 3,100 placed here since 2002—about 1 percent of the national total. The Administration for Children and Families in the Office of Refugee Resettlement (ORR) in the U.S. Department of Health and Human Services (http: //www.acf.hhs.gov/programs/orr) manages refugee resettlement. ORR was established in the belief that newly arriving populations have inherent capabilities and thus provides those in need with critical resources to assist them in becoming integrated members of American society. ORR serves those persons outside the U.S. who are unable or unwilling to return to their country of origin because of persecution or a well-founded fear of persecution on account of race, religion, nationality, membership in a particular social group, or political opinion. Persons granted refugee status overseas by the U.S. Department of Homeland Security is brought to the U.S. for resettlement by the U.S. Department of State. Voluntary agencies assist with their resettlement and integration into the U.S. Refugees are eligible to receive ORR benefits and services from the first day they arrive in the U.S..
Newcomers are becoming so diverse that the former Somali Community Center was recently renamed the Center for Refugees and Immigrants of Tennessee since the Center caters to refugees from many countries. Catholic Charities Refugee Resettlement Program, a local affiliate of the United States Conference of Catholic Bishops’ Migration and Refugee Services, provides core
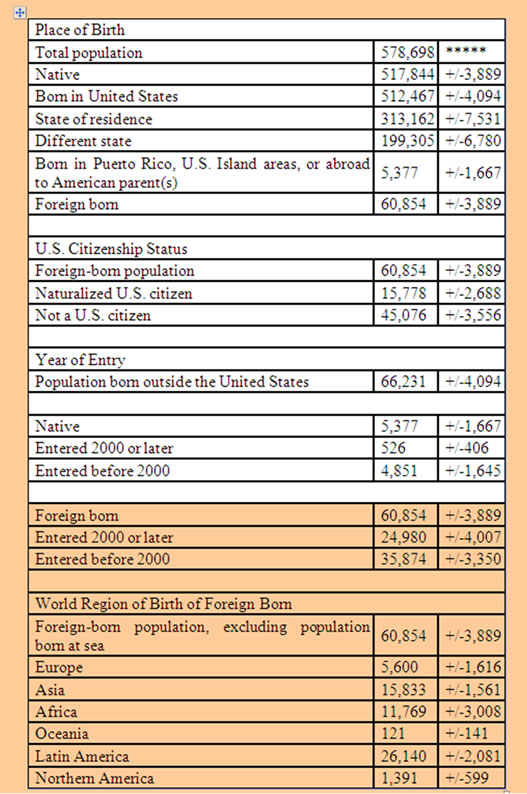
Table 5. Davidson county, Tennessee selected social characteristics data set: 2006 American community survey resettlement services to newly arrived refugee individuals and families (http://www.cctenn.org). Through its Reception and Placement Program refugees secure housing, food, clothing and other basic needs; assistance in accessing education, social services and health care; and employment services. Within 90 days, most refugees are on their way toward self-sufficiency. The city’s refugee services have provided refugees with English and citizenship classes and helped them find jobs. The Metro school system has guided their children to the International Newcomer Academy to learn simple aspects of American life, such as standing in line and using modern bathrooms.
Source: U.S. Census Bureau, 2006 American Community Survey (www.factfinder.census.gov)
Refugees fled the Khmer Rouge in Cambodia, the theocratic regime in Iran, political oppression in Africa, and the civil war in Iraq [8]. Refugees have arrived in the Nashville area from all over the globe, largely because U.S. government’s resettlement program decides where to send them. The Nashville area now has the largest Kurdish community in the U.S. (estimates vary from 8,000 to 12,000), primarily from Iraq. Somalis and Sudanese represent the next-largest groups, numbering more than 3,500 each. Refugees have suffered political persecution and hardship and are accorded resident status by the State Department. More recently refugees are coming from new places. For example, several of the 60,000 Bhutanese being admitted to the U.S. over religious tensions have landed in Nashville and more are expected. Myanmar, formerly known as Burma, is also the point of origin for new refugees.
4.1 Hispanics
By far the most important segment of the foreign-born population in Middle Tennessee is that comprised of Hispanics. There is considerably more data available on Hispanics than other groups, owing to the work of the Pew Hispanic Center which tracks Hispanic population trends throughout the U.S Founded in 2001, the Center is a nonpartisan research organization that seeks to improve understanding of the U.S. Hispanic population and to chronicle the growing impact of Latinos on the nation. The Center does not take positions on policy issues. It is a project of the Pew Research Center, a nonpartisan “fact tank” in Washington, DC, that provides information on the issues, attitudes and trends shaping America and the world. It is funded by the Pew Charitable Trusts, a public charity based in Philadelphia. The Center provides the following figures for the Hispanic population in Davison County/Nashville.
The Pew data recorded a veritable explosion in the Hispanic population in Davidson County from 4,775 in 1990 to 46,546 in 2007 (see table below). During the period from 1990 to 2000 the Hispanic growth rate was 446% while from 2000 to 2007 it was 78%. The Hispanics represented 5% of the county population in 2000, increasing to 8% in 2007. The Pew data, covering all 3,141 counties in the U.S., showed that Davidson County was among the highest in the country both in terms of absolute number of Hispanics and rate of growth (Table 6 Davidson County Hispanic Population 1990–2007), (www.pewhispanic.org).
The Hispanic community is also fortunate to have a strong non-profit organization dedicated to serving its population. Conexión Américas was founded in 2002 to address some of the most pressing challenges and opportunities created by recent demographic changes in the region as an increasing number of Latino families in search for a better quality of life. The name speaks to our desire to connect and build bridges that come between the Latino and the native-born communities. The founders of Conexión Américas—María Clara Mejía, José
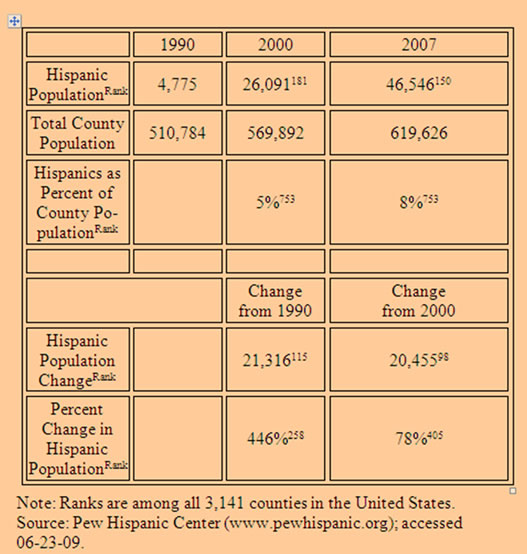
Table 6. Davidson county Hispanic population 1990–2007
González and Renata Soto—understood that void and its challenges. They teamed up with an existing small non-profit group, the Hispanic Family Resource Center (HFRC), that was exclusively dedicated to providing information-and-referral services on health-related matters. The merger allowed for the implementation of a holistic approach to help Latino families.
Since then, the original information-and-referral service of the HFRC has evolved into the Spanish Help Line for Middle Tennessee and Conexión Américas’ programs serve over 2,500 families per year. In addition, new programs in the social, civic and economic integration areas have been developed and implemented successfully. The organization’s funding base has been also greatly diversified. The need Conexión Américas is addressing in the Nashville community is best understood in the context of the demographic changes taking place in Nashville. The 2000 Census showed a 446 percent growth of the Hispanic population in Nashville from 1990. By 2000, public agencies and nonprofit organizations were dramatically challenged by this wave of newcomers. Although a few programs in large nonprofit organizations were addressing particular and isolated areas of these newcomers’ needs by 2000, no organization was fully focused on Latino families in a comprehensive way. Furthermore, no organization had full cultural competence to work effectively with our community’s newest neighbors coming from Mexico and other Latin American countries.
Today Conexión Américas is recognized as a leading Hispanic force in the Middle Tennessee region and in the entire state. In 2005, Conexión Américas was named the recipient of the Best Innovative Partnership Award from Neighbor Works America for its Puertas Abiertas homeownership program. In 2007, Conexión Américas received both the national Strengthening Families Award presented by the Annie E. Casey Foundation and the National Council of La Raza (NCLR) and the Bank of America Neighborhood Builder Award.
4.2 East Indians
Sarita Prabhu, a columnist for the Tennessean, has given voice to the Indian immigrant community for several years. She frequently writes about Nashville through the eyes of an Indian immigrant, having moved here some 14 years ago from India. Ms. Prabhu recently described how the first trickle of immigrants from India began arriving in the area 35 years; now they number more than 5,000 [9]. The first to arrive were mainly doctors who came with few restrictions during the Nixon era. Medicare had been established and there was a shortage of native-born doctors. The overwhelming majority of Indian immigrants from the very beginning were professionals— software engineers, doctors, hotel and restaurant managers and owners, and academics—and more recently real estate and life insurance agents as well as immigration lawyers.
Today there is a prominent presence of Indian faculty and students at Vanderbilt University and other local universities, especially in the sciences and engineering. The Indian immigrants are hardly a monolithic group. Rather they represent the diversity that is Indian society - Hindus, Muslims, Christians, Sikhs, and Jains—from all corners of rural and urban India. Elsewhere in this report it has been noted that immigrants to the U.S. born in India have the highest percentage with a bachelor’s degree (74 percent) of any other group. And they also have the highest median household income ($91,195) of any immigrant group.
As the Indian community grew in number and affluence, they began to establish their own institutions and cultural traditions. For example, a group of Hindus pooled their resources and established the Sri Ganesha Temple, part of the Hindu Cultural Center of Tennessee. The temple is now housed in a magnificent edifice in Bellevue. The temple complex, carved out of the hillside, houses the priests and their families and will soon include a school as well. The temple is open for service daily from 9:00 AM to 7:00 PM. Priests are available for special poojas (prayers) and occasions such as weddings and religious functions. The temple hosts frequent musical and theatrical presentations open to the public throughout the year.
A new monthly magazine known as JanDarpan, has come along to reflect on the Indian cultural scene. JanDarpan is one of the first publications of its type in the Nashville area, focusing primarily on the Indian community. Publisher Ravishankar Shetkar explains that the purpose of JanDarpan is to help businesses increase their revenuers and clientele though advertising in JanDarpan by providing information to its readers. JanDarpan also serves as an information bridge among various communities—not just the Indian community—through articles such topics as business, health, music, and current events. The editors are regularly adding more features each month, based on the feedback from readers. Contributions from readers are also encouraged. A recent article typical of JanDarpan’s coverage of the Nashville scene reported on a special designer show at Sri Ganesha Temple that featured precious and semi-precious jewelry from India. Another article reports on changes in U.S. visa regulations pertaining to non-immigrant (R-1) and immigrant religious worker (EB4) visas. And of course JanDarpan features an abundance of advertisements for Indian restaurants.
4.3 Somalis
Somali refugees from East Africa have poured into Middle Tennessee. The resettlement program is one part of a taxpayer-funded refugee aid program with a billion dollar budget. Immigrants are chosen from UN refugee camps. The selected refugees then undergo a few days of cultural orientation and are soon on their way to America. Although most of the refuges are repatriated to their home countries, the U.S. takes in more refugees than any other nation—with a cap of about 80,000 this year. The transition to life in the U.S. is not always a smooth one, however [10]. Most Somalis came as refugees to escape the chaos of their homeland, which is located in the Horn of Africa. Beginning in 2004, hundreds of them (estimates vary between 400 and 1,000) landed in Shelbyville, Tennessee, a town of about 17,000 population located about an hour’s drive from Nashville. At first glance, Shelbyville is your typical sleepy southern hamlet in middle Tennessee where the walking horse is king. Somalis in other cities were drawn to Shelbyville by the jobs offered at the local Tyson’s chicken processing plant. Previously the plant had come under fire from the Department of Justice in 2001 for hiring illegal Hispanic immigrants.
Somalis came to America under a legal humanitarian immigration program established by the 1980 Refugee Act, controlled by the UN High Commissioner for Refugees (UNHCR) and by the US State Department Bureau of Population, Refugees and Migration with a budget of over $1 billion. In 2007, there were an estimated 70,000 plus Somali legal immigrants in the US. Major centers of Somali refugees included, Minneapolis and Columbus, Ohio. This was facilitated in the 1990’s when the Clinton Administration, through the US Office of Refugee Resettlement, decided to vector Somalis and other humanitarian refugees away from major coastal cities and into the interior of the American heartland.
Major employers who require low skilled workers, like Tyson’s, took advantage of these changes. Tyson was prodded by Federal criminal cases brought against it by the US Department of Justice for hiring illegal Hispanic aliens. The hiring of legal Somali immigrants was facilitated by federal cash stipends and social assistance administered by state social services agencies with the contractual assistance of voluntary agencies like Catholic Charities, Lutheran Relief, Church World Services and others.
There have subsequently been reports of a culture clash between the locals and the highly visible Somalis who are totally isolated and with no interaction between them and the locals. The large influx of Somalis has only added to frustration of the locals with the plant and the government. Three major industries have been shut down in Shelbyville and 700 to 800 locals have lost their jobs and are trying to find any kind of work they can. As they see it, the U.S. government is shipping people from overseas to come in and take their jobs. The Tyson plant generated national controversy in the fall of 2008 when it dropped Labor Day as a paid holiday in favor of the Muslim holiday Eid al-Fitr.
Among the refugees from Somalia there was a minority group known as Bantu [11]. Beginning in May 2003, some 200 Somali Bantu were flown to 22 cities across the United States, the first wave of one of the U.S. government’s largest recent refugee resettlement efforts. Officials planned to resettle nearly 13,000 Bantu. Nashville was one of several cities that received the Bantu refugees. The Bantu in Somalia, an ethnic minority, were forcibly transported there from Mozambique, Malawi and Tanzania by Arab slave traders two centuries ago. In Somalia, they were often denied access to education and jobs. They were enslaved and persecuted for generations in Somalia until civil war scattered them to desolate and violent refugee camps in Kenya in the early 1990’s.
As refugees, the Bantu farmed, cooked, cleaned and labored in construction jobs in the refugee camp in Kenya. But most had never flipped a light switch, operated a stove, opened a bank account or flown in an airplane. There they began the long process of adapting to a new culture when the International Organization for Migration began familiarizing them with English, American culture and modern appliances while they waited in the camp in Kenya. Over the past decade, State Department officials have increasingly shifted their focus toward Africa as wars there have displaced millions of people. State Department statistics show that Africans made up 3 percent of the refugees resettled in the United States in 1990, but by 2001 that figure was nearly 30 percent.
4.4 Kurds
The first group of Kurds to arrive in the U.S. came following a failed revolution against the central government of Iraq in 1975. The Kurdish leader, Mustaafa Barzani, went into exile with many of his followers to the U.S. where he died in 1979. In 1992 another wave of Kurds was accepted into the U.S. as refugees after living in refugees camps in Turkey for four years. They had fled their homeland in Iraq after the Iraqi government’s genocidal campaign of 1987 and 1988 in which thousands of Kurds were killed. The lucky ones escaped across the border into Turkey. The third group of Kurdish immigrants came in 1996 when Iraq troops crossed into the Kurdish controlled area to recapture it. Many of the thousands of Kurds who fled then were professionals and college graduates who came to the U.S. as asylees and refugees. They settled throughout the U.S., but especially in the Nashville area. Today there is no official statistics of the Kurdish population in the U.S., although the estimate is around 40,000, the majority of them from Iraq. Others have come from Iran, Turkey, and Syria. The Kurdish Yellow Pages estimates that 10,000 Kurds reside in the Nashville area.
Business Week recently (June 29, 2009) devoted a cover article to the U.S. housing market, profiling eight cities including Nashville, known as Music City USA. Some of the cities have suffered from the economic downturn while others appear to be keeping their heads above water. In the Nashville area immigrant homebuyers are reported to be having a positive impact on the market, where the median home price declined only slightly from $159,490 in 2007 to $153,000 in 2008. For example, the city’s Kurdish immigrants are helping stabilize the local economy. As a group, Kurds increased their homeownership rate from 46.5% in 1995 to 53% in 2008, according to the Pew Hispanic Center.
The immigrant population has been a stabilizing force in Nashville, where mosques and markets occupy a stretch of Nolensville Road south of downtown. Already, housing is showing signs of life: home sales topped 1,300 in April 2009, up from 850 in January. Toxic mortgages, so common in recent years, have not been an issue for Nashville’s Kurds since they are forbidden by their Muslim faith to pay interest on loans. Many potential buyers in the community have turned to Habitat for Humanity, the housing charity offering interest-free loans that require borrowers to pay only the principal. In Nashville, Habitat built Providence Park, a subdivision with 138 homes, more than a third of them occupied by Kurds.
Business Week interviewed Bayan Barwari and her husband, Deldar Muhammad who pay just $385 a month for their house. Not all Nashville residents have put out the welcome mat. Some locals had opposed the construction of Providence Park, predicting that the low-income home buyers would drag down home prices. But the immigrants have had the opposite effect: Overall property values in Providence Park have increased, boosting Nashville’s tax coffers by $230,000 a year. Nashville Mayor Karl Dean says: “The cities that are going to do well are cities that are attracting new people and reinventing themselves.”
The Kurdish community is very homogeneous and well organized. The religious and cultural center of Kurdish life is the Salahadeen Center of Nashville, a non-profit, tax exempt, faith-based organization founded in 1998 to serve the Muslim and specifically Kurdish communities. It is located just off Nolensville Road in the heart of the Kurdish business sector. The business community is reflected in the second edition of Kurdish Yellow Pages (2008) which provides an alphabetical listing of Kurdish businesses and advertisements.
4.5 Bhutanese
Bhutanese refugees began arriving in the United States in March 2008, the first wave of what the United Nations describes as one of the world’s largest resettlement efforts. The refugees are ethnic Hindu Nepalis who were forced into exile, according to human rights groups. The U.S. offered to resettle 60,000 of the estimated 107,000 refugees living in seven U.N. camps in southeastern Nepal—their home for the past 17 years. Six other nations have offered to resettle 10,000 each (CNN, March 25, 2008). Over the summer of 2008, a contingent of the Bhutanese became the most recent wave of refugees resettled in Middle Tennessee [12]. Seventy-two of them were brought to Nashville by Catholic Charities, the first of what could become several thousand.
Wedged between China and India, Bhutan is a Buddhist kingdom about half the size of the U.S. state of Indiana. It is considered one of the world’s most isolated countries. The government strictly regulates foreign influences, including tourism, to preserve the country’s Buddhist culture. According to Human Rights Watch, Bhutan stripped the Nepalis of their Bhutan citizenship and forced them into exile in the early 1990s, allegedly in an attempt to ensure a homogenous Buddhist culture. Some of the Nepalis took up arms and joined with Maoist rebels. The refugees claimed they were forced to leave Bhutan by security forces, but Bhutan disputed whether all were truly refugees. Several rounds of talks between Nepal and Bhutan failed to resolve the issue.
The United States’ resettlement plan has divided the refugee community, as members disagree over whether it is best to resettle in the United States or hang onto hopes of returning to Bhutan. Bhutan became the world’s newest democracy in 2008 when an election ended more than 100 years of royal rule in the South Asian nation. Officials in Bhutan declared the first elections in the Himalayan kingdom a resounding success.
4.6 Nigerians
Nigeria is by far the most populous nation in Africa and is blessed (cursed?) with an abundance of oil reserves. The country is multi-ethnic and multi-religious, with the northern half populated primarily by Muslims and the southern half by Christians. Nigerians are known throughout Africa for their business acumen. In the Nashville area Nigerians seem to have carved out in niche for themselves in the home health sector [13]. For example, Alternative Care is an Antioch, TN-based firm that provides 24-hour care for elderly persons. The company prepares meals, see that the patients take their prescribed medicine, and plan outings. And Alternative Care is just one of several local Nigerian-owned businesses providing nursing and residential care for the elderly and mentally challenged adults. Health care operations do not require a lot of start-up capital. Some full-service firms arrange for a home for the patient. The costs of care and other living expenses are paid for by the state, the patient’s relatives or by Social Security. Other providers simply send in workers to lend personal assistance in the home. Home health care involves providing nurses for medical care in the home, programs that are highly regulated.
5. Immigrant Entrepreneurs: Face of the New Nashville
5.1 The Primary Research Conducted by TSU Faculty and Graduate Students
Despite the burgeoning growth of the immigrant community in Middle Tennessee and the importance of immigrant entrepreneurship to the local economy, there has heretofore been little systematic study of the nature of foreign-owned businesses. There is a distinct lack of information regarding the patterns of entrepreneurship of the various immigrant groups in Nashville and the constraints faced by each group in creating, operating, growing and planning for the succession of their businesses. The research described here was a first step towards the collection and analysis of primary data on this subject.
The Tennessee State University College of Business team that surveyed immigrant entrepreneurs in Middle Tennessee began operations in the summer of 2008 solicited the active participation and support from the immigrant-based chambers of commerce and other community organizations that represented foreign-born business constituencies. At the time there were five chambers (two Hispanic, one Chinese, one Asian, and soon after an African chamber). The team began by researching relevant literature on the minority enterprises and immigrant communities and establishing a database. In the fall invitations went out to two groups of ten business owners to participate in a focus group. The issues raised in these sessions were used to inform the eventual design of a questionnaire. A public forum was held, bringing university and community partners together to explain and discuss the nature of the study.
The next phase of the project involved conducting face-to-face interviews with 32 individual entrepreneurs, selected along region-of-origin of immigrant groups within the area as well as business types. Ten of those interviewed were Hispanic, of whom seven were originally from Mexico; six were from the Middle East; eleven were from Asia; two from Africa, and two from Europe. Nine of them were restaurant owners; eight were in services such as beauty salons and clothing stores, two were in trade; two newspaper and magazine; three in trade and distribution; and six were in technology and computer services. While not a statistical representation of business types, this was a fair representation of common businesses in the area.
5.2 Profile of Immigrant Entrepreneurs Interviewed
A draft survey instrument was refined several times through a series of four trials and a final version emerged by January 2009. Survey responses were obtained from 114 respondents, collected both in person and online. The results of this survey are summarized in charts and graphs in the Appendix. One of the most important purposes of the survey was to ascertain the concerns and needs of immigrant entrepreneurs. The following list emerged from the survey:
Ø English lessons, focused on business needs
Ø Assistance in financing and business planning
Ø Assistance with tax records preparation
Ø On-call assistance; services at unconventional times
Ø Human resource training, skill development, supervisory skills
Ø Networks for material sources, legal assistance, accessing sources of funding
Ø Services in local immigrant communities From the questions posed to the entrepreneurs themselves the following profiles emerged. The two main reasons for their having migrated to the U.S. which they listed were the unfavorable economic conditions and political instability in their country of origin. A majority of the respondents indicated that they bought the business they now manage, as opposed to creating it themselves. Those who started the business themselves began alone and not with partners. Most of them are in fact sole proprietorships, some are partnerships, and a few are incorporated. None indicted that they were franchisees. Nearly all of the respondents began their business primarily with personal savings, quite a few of them using personal credit cards. Most of them also indicated that they also relied upon family and friends for financing. No more than ten percent of them, however, had received bank financing.
As for their products or services, most respondents said that they had to adapt quite a lot to the American taste. We were interested to learn the extent to which the immigrant entrepreneurs managed to do business with the government, either as contractors or sub-contractors. Only seventeen percent said that they had done business with the government, mainly because they were unfamiliar with government agencies and contracting. However, most of the respondents felt that there was no government bias against foreign-born businesses. Immigrant entrepreneurs rely heavily upon personal, social and business networks for the success of their business as well as hard work and reliable employees.
5.3 Distribution of Businesses by Region of Origin, Type of Business and Location in Nashville Area
A final phase of research focused on the distribution of businesses by region of origin or language grouping. The Office of the Davidson County Clerk maintains a database of all businesses that operate within its jurisdiction. That database includes several data fields: name of the business, type of business, name of the owner, and mailing address (including zip code). The list is updated monthly and is available to the public for a fee. We purchased the database with a view toward trying to determine which of the businesses might be run by foreign-born owners. The list we examined contained a total of 39,226 businesses, all of them in the service sector. Manufacturers are not obliged to have the same business license.
Admittedly, this was a very unscientific process! The first question was what criteria to use. How could we be at all certain that a business owner is in fact foreign-born? Basically, this would be an exercise in guesswork. We identified six categories, based on the family name of the owner. These were somewhat arbitrary, but provided a means of getting a handle on the extent of diversity among businesses in the Nashville area. The categories we identified were as follows:
Ø Hispanic: language group consisting primarily of persons from Latin America
Ø Muslim: religious group, identified primarily by Muslim names, mainly Middle Eastern
Ø Indian: geographic group of the Indian subcontinent including Pakistan, Bangladesh
Ø African: geographic group, often overlapping with Muslim names
Ø Asian: geographic group, consisting mainly of Chinese, Koreans, Japanese and Thais
Ø European: geographic group covering Eastern and Western Europe and Turkey Granted, there is much room for error in such an exercise. There is no proof that many of businesses identified were really owned by the foreign-born. There are numerous Garcias on both sides of the Rio Grande! And a person with a Muslim name could be from many parts of the world, including Indonesia (with the largest Muslim population in the world) as well as North or West Africa. The vast majority of names on the Davidson County business tax list of course have names of European origin (native born, assumed not to be foreign-born). So most of those we identified for the European category were of Eastern European origin with mostly Slavic names.
Therefore, the best we could hope for was a ballpark estimate, until a more scientific methodology is devised. By the very nature of the database (licensed businesses), businesses in the informal sector (unlicensed) are excluded. We are thus probably missing quite a sizeable segment of immigrant-run operations. Nor were we able to obtain such important information as the size of the business, the date of establishment, or number of employees.
Besides names of owners, we were interested in two other data points: type of business and location within the Nashville area. The objective here is to be able to map out region of origin with zip code and business type. Of the 39,226 businesses in the Davidson County Business Tax Database we identified a total of 4588 as possibly being foreign-born, or roughly 12% of the total. Not surprisingly, the largest category of foreign-born businesses was Hispanic (1428) followed closely by Muslim (1104), Asian (684), African (630), Indian (377), and European (365). When we look at the distribution of registered businesses by type of business we see a significant variance among the six groups. For example, by far the largest concentration of African businesses are under the heading of taxi drivers, accounting for nearly half of all those in this category (630). Furthermore, they account for roughly half of all businesses listed in the Business Tax Database as taxi drivers.
When we examined the types of businesses owned in each of the six categories there were certain patterns that emerged. Unfortunately, the coding of businesses types by the County Clerk’s office left something to be desired, since a very sizeable proportion of businesses in all categories were coded 99, which simply means “undefined”. The prevalence of this code applied across all of our categories. Several business types were also preceded by the term “miscellaneous”. Both African and Muslim businesses are coded highest on Taxicabs. In fact, together they account for the vast majority of taxi drivers in the Nashville area. The Indian, Hispanic, European and Asian categories all score either highest or second highest on Eating Places. (Only Indians are coded as Liquor Store owners). The next most popular type of business among Africans, Asians, and Hispanics is Services to Buildings, followed closely by Muslims and Europeans. Although Indians are not listed at all in this business type, they were very prominent in Hotels, Motels, and Tourist Courts. All are engaged in Special Trade Contracting, and all except Hispanics are engaged in General Building Contracting businesses. All groups except Indians are in Services to Buildings. Hispanics tend to specialize in Painting & Paper Hanging, Masonry Stonework, and Carpentry while none of the other groups are coded in these businesses.
Not surprisingly, all categories of business owners are listed as owners of Grocery Stores and all are coded for Retail Stores. The Used Car Business is a common denominator among the Africans, Indians, Muslims and Europeans, but not the Asians and Hispanics. However, Hispanics, Europeans and Africans are engaged in General Auto Repair. Beauty Shops show up regularly among Asians, Europeans, and Hispanics, but not Indians, Africans, and Muslims. All groups are engaged in Other Business Services, but only Europeans and African are in Management Consulting and Public Relations.
As for location within the Nashville area, we found heavy concentrations of nearly all six groups of foreign-born entrepreneurs in the southeastern part of the city along the Nolensville Pike corridor (zip codes 37211, 37217, 37013). This also coincides with the distribution of the general population of these groups.
6. What Does the Future Hold for Immigrant Businesses?
6.1 Immigrants Leaving the U.S.
As the debate over H-1B workers and skilled immigrants intensifies, it is becoming clear that the U.S. is no longer the only land of opportunity. If the immigrants who have fueled innovation and economic growth are no longer wanted in the U.S, they now have options elsewhere. Immigrants are returning home in greater numbers. New research shows they are returning to enjoy a better quality of life, better career prospects, and the comfort of being close to family and friends. A research team composed of scholars at Duke, UC Berkeley and Harvard conducted a survey funded by the Kauffman Foundation through the professional networking site LinkedIn [14]. They located 1,203 Indian and Chinese immigrants who had worked or received education in the U.S. and had returned to their home countries.
The study concluded that a crisis is brewing because of a burgeoning immigration backlog. At the end of 2006, more than 1 million skilled professionals (engineers, scientists, doctors, researchers) and their families were in line for a yearly allotment of only 120,000 permanent resident visas. The waiting time for some people ran longer than a decade. In the meantime, these workers were trapped in “immigration limbo”. If they changed jobs or even took a promotion, they risked being pushed to the back of the permanent residency queue. Given these circumstance, skilled foreign workers may very well get fed up and return home to countries like India and China where the economies are booming. This issue looms large as the debate over immigration policy gains steam.
Meanwhile, Richard Herman who lives in Cleveland, Ohio, is on a crusade to promote immigrants as the vanguard of a new American economy [15]. Herman says that the rust belt—traditionally tied to the Old Economy—progressively depopulating, under-educated, with massive job loss, and not too keen on start-ups—is beginning to see that new partnerships are needed to compete in the global, knowledge-based, New Economy. According to Herman, global connections such as those ushered in by immigrants will be the key to the rust belt’s revitalization and new era of job-creation, start-ups, new industries and neighborhood renewal. Herman reports on business and civic leaders in the region from Cleveland to Detroit pursuing an immigration stimulus. He argues that world-class universities in the region are leading the way in innovating biomedical, polymer, liquid crystal, energy, advanced manufacturing and other technology frontiers. Perhaps high-speed rail could accelerate the regional collaboration already percolating between these cities and their institutions.
Herman suggests that one important way of promoting the Tech Triangle anchored by Detroit, Cleveland, Pittsburgh and Columbus would be to enact a new federal immigration policy that grants immigration incentives to companies, foreign talent, and investors that locate in economically distressed metro areas—what the Metropolitan Chambers of Commerce coalition is calling “High Skill Immigration Zones”. Finalized in February, 2009, this immigration policy proposal, crafted by the Greater Cleveland Partnership, and adopted by 30 Metropolitan Chambers of Commerce from Chicago to Pittsburgh, proposes that immigration law reform include the creation of “High Skill Immigration Zones” (HSI Zones) in struggling metro areas. The HSI Zone proposal would facilitate significant international talent attraction, integration and retention, in order to accelerate the development of emerging industries such as renewable energy technology, biomedical and nanotechnology as well as other emerging sectors. The HSI Zone would allow companies to locate in these regions to take advantage of relaxed visa restrictions in hiring high-skilled workers. For example instead of opening up an R&D facility in Vancouver due to U.S. immigration barriers to talent, Bill Gates could open up the same facility in Cleveland or Detroit. Foreign talent would be less likely to return back home to India or China due to 5 to 10 year waits for their green card; there could be an elimination of green card quotas for workers in HSI Zones.
Foreign investors, investing $500,000 to $1,000,000 and creating 10 new jobs under the existing Foreign Investor Green Card program, would have greater opportunities to invest in HSI Zones. International Students seeking to study in HSI Zones would receive expedited visas from U.S. embassies. Foreign nurses with proper licensure would be permitted to access a revived H1A non-immigrant nursing visa for hospitals and health care facilities in the HSI Zones. International Welcome Centers would be established in HSI Zones to facilitate community and employer engagement with immigrants. The region’s universities already attract some of the most brilliant minds in the world—only to see them depart from the region or the U.S. due to not feeling welcomed, visa restrictions, barriers to job advancement, and insufficient entrepreneurial infrastructure and support system. Similarly, foreign direct investors could be better recruited and welcomed to the region in order to provide muchneeded capital for rebuilding the economy.
While Middle Tennessee is not thought of as a “rust belt”, immigrant entrepreneurs are helping to re-make the economic landscape of the region. As a New Ellis Island, the Nashville area continues to attract immigrant and refugees from all over the world. Their entrepreneurial energy is being clearly felt and for the most part appreciated.
REFERENCES
- Pew Research Center, “Mexican Immigrants in the United States, 2008,” Fact Sheet, 15 April 2009. http://www. pewhispanic.org.
- Office of Advocacy, “Small Business Administration,” 23 June 2009. http:// www.sba.gov/advo.
- C. Echegaray, “Local refugee population grows in size, diversity,” Tennessean, 3 February 2009.
- D. B. Cornfield, et al., “Final report of the immigrant community assessment, prepared under contract #14830 for metropolitan government of nashville and davidson county,” Tennessee, 13 August 2003.
- K. Lotspeich, F. Michael, J. Ost, and D. Perez-Lopez, “A profile of the foreign-born for the building the new American community project funded by the office of refugee settlement administration for children and families in the U.S. department of Health & Human services,” 2003.
- A. Farris, “New immigrants in new places: America’s growing ‘Global Interior’,” Carnegie Reporter, Fall 2005.
- S. Mattson, “Immigration issues in Tennessee: Office of Research & Education Accountability (OREA), Tennessee comptroller of the treasury,” 2007. http:// www. Comptroller.state.tn/orea/reports.
- C. Echegaray, “Local refugee population grows in size, diversity,” Tennessean, 3 February 2009.
- S. Prabhu, “Indian immigrants now flourish here in the mid-state,” Tennessean, 11 August 2008.
- E. Stakelbeck, “Somali Muslims changing small Tennessee town,” 27 March 2007. http:// www. familysecuritymatters.org.
- R. L. Swarns, “U.S. a place of miracles for Somali refugees,” New York Times, 20 July 2003. http:// www. nytimes.com.
- C. Echegaray, “Newest refugees hail from Bhutan,” Tennessean, 1 January 2009.
- G. Ward, “Nigerians find niche in home health sector,”Tennessean, 22 March 2009.
- V. Wadhwa, “Why skilled immigrants are leaving the U.S.,” 2009. http:// www.yahoo.com/news.
- R. T. Herman and R. L. Smith, “Immigrant, Inc.: Why immigrant entrepreneurs are driving the new economy and how they will save the American worker,” Hoboken, N.J.: John Wiley & Sons, Inc., 2009.