Journal of Geographic Information System
Vol.5 No.1(2013), Article ID:27919,12 pages DOI:10.4236/jgis.2013.51001
A Rough Set and GIS Based Approach for Selecting Suitable Shelters during an Evacuation Process
Department of Information Systems, Mansoura University, Mansoura, Egypt
Email: sara.shaker2008@yahoo.com
Received November 19, 2012; revised December 20, 2012; accepted January 21, 2013
Keywords: Rough Set Theory; GIS; Shelter Selection; Evacuation Planning
ABSTRACT
Humanity suffers an ever-present threat of crises. In the event of a crisis, the population in affected areas will be in danger and will need to be evacuated to a safer in order to protect their lives. One of the difficulties in emergency management is quickly and accurately selecting suitably safe areas of refuge. This paper aims to explain an evacuation shelter selection process that uses rough set theory and a geographical information system (GIS). The proposed approach uses rough set theory concepts to classify shelters and selects suitable shelters on the basis of three factors: distance, capacity, and the availability of life requirements. The preparation of data and reporting of results are performed via the GIS environment. The proposed approach was implemented using Masoura, Egypt, as a case study and the results of this implementation are presented.
1. Introduction
Urban areas are frequently subject to various crises. Whether natural or man-made, a crisis is an event that happens suddenly, surprises and threatens people, and affects the environment. In a crisis, such as an earthquake, fire, or explosion, decisions need to be made quickly and accurately to minimize loss of life and economic repercussions. To make such decisions, the situation must be managed through a crisis management plan. This allows for the mitigation of the effects of a crisis before, during, and after the event. A primary component of any crisis management plan is the evacuation plan.
Evacuation is an operation whereby all or part of a particular population is temporarily relocated to a safe location in an organized manner from a region that has been, or is about to be, struck by a disaster [1]. Many factors may affect an evacuation process, such as evacuee behavior, traffic control, safe area selection, and evacuation routes. This paper focuses on the process of selecting safe evacuation areas and the factors that affect selecting a safe location. A suitable area should be a safe, open, and large area where basic life requirements are available.
In recent years, many studies have attempted to solve and enhance the evacuation shelter selection process from a variety of perspectives. M. Saadatseresht et al. [2] proposed a multi-objective evolutionary algorithm, coupled with a geographical information system (GIS) to provide better visualization, to determine the distribution of evacuees into safe areas by selecting candidate safe areas, and to determine viable paths between city blocks and the candidate safe areas. This method selected an optimal safe area based on the shortest distance and the capacity of the safe area. J. Coutinho-Rodrigues et al. [3] identify six objective functions to find evacuation paths and location of shelters by a method that minimizes total travel distance, risk, time, and number of shelters. ChungHung Tasi et al. [4] studied the uncertainty of geographical data and proposed an integrated TS decision-making system that combined TS fuzzy models with GIS space analysis to investigate effective distribution of people to urban shelters during an emergency.
In this paper, a rough set approach coupled with a GIS is proposed for selecting the most suitable shelters during the evacuation process. Shelter selection schema is based on three criteria: distance between the incident point and a shelter, the capacity of the shelter, and the availability of basic life requirements in proximity to the shelter location. The shelter selection process is carried out by a set of rough set rules and the input data are prepared and the results are reported using the GIS environment.
The remainder of this paper is organized as follows. Section 2 provides a review of rough set theory literature. Section 3 presents an overall review of GISs. In Section 4, the shelter selection process framework is introduced and Section 5 details the implementation of the proposed methodology as demonstrated through a case study. Finally, in Section 6, a summary is provided and future work is briefly discussed.
2. Rough Set Theory
Rough set theory, introduced by Z. Pawlak [5], presents a mathematical approach for dealing with imperfect knowledge; its methodology is concerned with the classification and analysis of imprecise, uncertain, or incomplete information and knowledge, and is considered one of the first non-statistical approaches to data analysis. Imperfect knowledge has become a serious issue for computer scientists, and there are many approaches to understanding and manipulating imperfect knowledge. The most successful approach is based on the fuzzy set notion. The main advantage of rough set theory is that it does not need any preliminary or additional information about data, such as probability in statistics or grade of membership in the fuzzy set theory.
2.1. Indiscernibilty Relations
The starting point of rough set theory is the indiscernibility relation, which is generated by information about objects of interest. An indiscernibility relation is a relation between two or more objects, where all the values are identical in relation to a subset of considered attributes [6]. The indiscernibility relation is intended to express the fact that, due to a lack of knowledge, we are unable to discern some objects with the available information. For example, Table 1 shows that shelters (S1, S2, S4) are indiscernible with respect to the attribute Capacity as they have the same value for that attribute. Shelters (S5, S6) are indiscernible with respect to the attributes Capacity and Requirements.
2.2. Information Table versus Decision Table
An information table is required to represent data that will be utilized by rough set theory; an information table consists of rows representing objects and columns representing attributes relating to the objects.
Table 1. Example of a decision table.
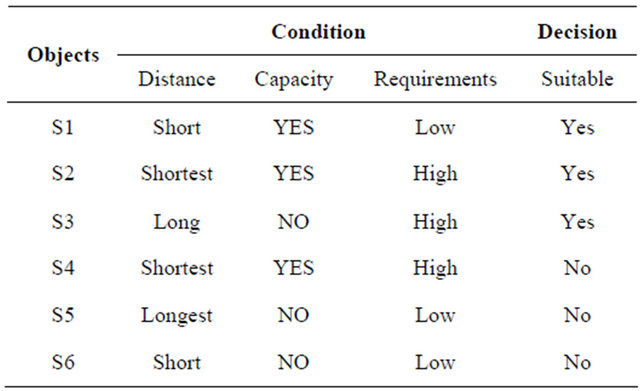
Decision tables, a type of information table, contain two types of attributes; condition attributes and decision attributes. A decision table specifies what decisions should be undertaken when certain conditions are satisfied. They are useful tools in decision-making problems, such as determining suitable evacuation shelters. Table 1 shows an example of a decision table.
As shown in Table 1, rows represent shelters (objects), the columns Distance, Capacity, and Requirements represent condition attributes, and the column Suitable represents the decision attribute. Each row of a decision table determines a decision rule specifying the decision (action) that must be made when the conditions indicated by condition attributes are satisfied [6]. For example, in Table 1, the conditions (Distance, Short), (Capacity, YES), and (Requirements, Low) determine the decision (Suitable, Yes).
2.3. Simplification of Decision Table
Simplification of a decision table involves reducing the number of condition attributes by removing unnecessary conditions while allowing the same decision to be reached.
3. Geographical Information Systems
The data involved in the evacuation shelter selection process has obvious geographical features, and the best way to deal with such features is with a GIS. A GIS captures, stores, checks, integrates, analyzes, displays, and allows manipulation of data that are spatially referenced to the earth [7]. These data can be further analyzed using models to build computer systems for geographic research and decision-making services [8]. Additionally, a GIS is attractive because it is both intuitive and cognitive. It combines a powerful visualization environment with a strong analytic and modeling framework that is rooted in the science of geography [9].
In this paper, a GIS is used as a platform to prepare and display the data required for the shelter selection process. The primary tasks performed by the GIS are: creating two layers to store city road and shelter attributes, displaying the incident location, creating the evacuation zone area (a buffer around the incident point defining the danger zone), determining road routes from the incident location to all shelters, computing the distance of each route, and displaying the most suitable shelter location on a map.
4. Shelter Selection Process Framework
Evacuation is a process by which threatened people are transferred from a dangerous place to a safe shelter location to protect their lives. Selecting suitable shelter is a complicated process that associates several factors, which may depend on the type of crisis. This paper proposes a method for selecting evacuation shelters independent of crisis type. Such an approach could, generally, be applied to any crisis evacuation plan.
The Guidelines for Hurricane Evacuation Shelter Selection (ARC 4496) [10], provided by the American Red Cross and the Home Community World institute, provides primary guidelines for hurricane evacuation shelter selection. In our case study we did not consider the crisis type; therefore, we followed only the ARC 4496 guidelines that relate generally to selecting an evacuation shelter, such as location and capacity. We did not consider conditions specific to hurricanes, such as wind speed, rainfall, flooding, and hurricane force, etc.
The guidelines for selecting evacuation shelters applied in this paper are:
• No evacuation shelter should be located in the evacuation zone (ARC 4496).
• Evacuation shelters should be in open areas. If the affected city does not have adequate open areas, then schools can be used as evacuation shelters.
• Shelter space requirements should be determined using 40 square feet per shelter resident. Shelter space requirements may be reduced using no less than 20 square feet per person (ARC 4496).
• The shelter location should have basic life requirements or can have basic requirements delivered easily.
The idea behind the approach is to classify all shelters in the city under study. Each shelter is classified according to a set of rough set rules, and each class has a degree of suitability. Then, under certain conditions, the most suitable shelter is chosen from one of the classes. A flowchart of the proposed framework is presented in Figure 1. The following subsections provide a detailed description of the methodology.
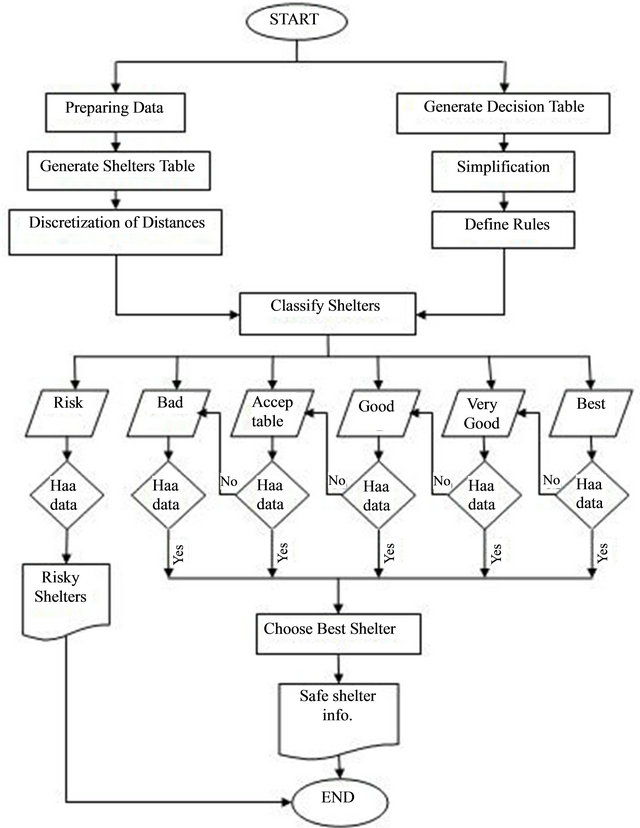
Figure 1. Framework for evacuation shelter selection process.
4.1. Preparing Required Data
The first step of our methodology is the preparation of the required data. This preparation includes creating a database to store road information and safe locations that can be used as shelters, determining the incident point where the crisis occurs, defining the evacuation area, and calculating the distance from the incident location to each shelter. All these preparations are carried out by the GIS.
4.2. Generate Shelters Table
The shelters table should contain information about areas in the city that can be used as shelters. This information will be used to define the classification process. The table consists of three basic attributes: Distance, Enough_Capacity, and Requirements.
The Distance attribute contains the value that represents the distance from the incident location to each shelter.
The capacity of each evacuation shelter is computed according to ARC 4496 guidelines, which state that shelter space requirements should be determined using 40 square feet per person (shelter resident). A Check_Capacity method has been developed to check the capacity of a shelter against the number of displaced people within the incident location and assigns the result to the capacity attribute in the table. The Enough_Capacity attribute contains a value of “YES” or “NO”; the value is “YES” if the shelter’s Capacity will accommodate the number of displaced people and “NO” if the shelter’s Capacity will not.
The Requirements attribute contains a value that represents whether or not this shelter has basic life requirements, such as electricity, food, water, medicine, etc. If these requirements are available and are in good condition, then the attribute value is “High”. If these requirements are available but are in poor condition or are difficult to use, the attribute value is “Low”. If these requirements are not available, then the attribute value is “Not Available”.
4.3. Discretization Process
Because distance values are continuous values, we need a method to convert these values to discrete values so they may become useful in the classification process. Discretization techniques can be used to reduce the number of values for a given continuous attribute by dividing the range of the attribute into intervals. Interval labels can then be used to replace actual data values [11]. There are a number of discretization methods available, such as Boolean reasoning, equal-frequency binning, entropybased, naïve-Bayes, etc.
According to Z. Marzuki and F. Ahmad (2007) [12], these methods were developed for specific problems or domains; therefore, using these methods in other domains may be inappropriate or cause serious problems that affect the accuracy of the results. Regardless of how each method works, the basic idea is to define a cut point to split the continuous values and to define a stopping criterion for the discretization process.
Unfortunately, these discretization techniques are not appropriate in our case because, according to ARC 4496 guidelines, no evacuation shelter should be located in the evacuation zone. Therefore, we need to consider the difference in distance between each shelter and the evacuation zone and consider a cut point to compare the difference. In order to overcome this problem, we developed a simple discretization method called DiscreteDistances. The algorithm starts by checking if there is a distance value in the distance list that is less than or equal to the evacuation zone value. If present, the shelter is located inside the evacuation zone and is in a dangerous area. In this case the discretization algorithm assigns the interval label “Risk” to the distance.
If this is not the case, the algorithm computes the difference between each distance in the distance list and the evacuation zone value and compares this difference value to the predetermined cut points in order to assign the distance to one of the defined intervals (“Shortest”, “Short”, “Long”, “Longest”).
4.4. Generate the Decision Table
Parallel with the data preparation, a decision table is generated using all possible scenarios for a shelter’s status. This forms the basis of the classification process. The table consists of two types of attributes; the condition attributes, Discrete_Distance, Capacity, and Requirements_Status, and a decision attribute that represents a shelter’s degree of suitability. An expert opinion is required to determine the right decision for each scenario.
4.5. Simplification
Each row in the decision table represents a decision that should be made under the corresponding conditions. In some cases, the same decision can be reached by fewer conditions. The simplification of the decision table is a very important step whereby the table is reduced in a manner that allows the same decision to be reached using fewer conditions. This type of simplification eliminates the need to check unnecessary conditions. The table simplification method [13] used herein consists of the following steps:
1) Computation of reducts of condition attributes. This is equivalent to the elimination of columns from the decision table.
2) Elimination of duplicate rows.
3) Elimination of superfluous attribute values.
4.6. Define Decision Rules and Perform Classification
In this step, a set of decision rules are defined based on the simplified decision table. Each row in the simplified decision table represents a decision rule. The advantage of defining rules in advance is that these rules are reusable; the rules can be applied to multiple evacuation shelter selection problems under equal conditions.
Subsequently, the defined rules function as the basis for the Classify method. The Classify method interprets the set of rules as implications called “if … then” rules and generates six classes (Risk, Best, Very Good, Good, Acceptable, Bad). It then assigns each shelter in the Shelters table to one of the classes according to the defined rules.
The Risk class contains a set of shelters that are not suitable for the evacuation process. All other classes contain shelters suitable for the evacuation process; however, their degrees of suitablity differ. In other words, shelters in the Best class are the most suitable shelter and the degree of suitability decreases from Best to Bad.
4.7. Choosing the Most Suitable Shelter
The last step of the approach is selecting the most suitable shelter from the classes, Best, Very Good, Good, Acceptable, and Bad. The Suitable_Shelter method was developed to achieve this. First, the Best class is checked for data (shelters). If data exists in the Best class, the Suitable_Shelter method chooses the entry with the minimum distance. If no data is present in the Best class, the next class (Very Good) is checked, and so on, until it reaches the Bad class. If the selected shelter does not have enough capacity, then a shelter with the next minimum distance is selected.
5. Implementation and Analysis Results
To test our approach, we applied our methodology to a case study using Mansoura, Egypt. Mansoura is the capital city of Al-Daqhlia province and lies on the east bank of the Damietta branch of the Nile, in the Delta region. It is located approximately 120 km northeast of Cairo, the capital of Egypt. Mansoura covers 327.62 square kilometers and has a population of 992,605, according to 2011 provincial statistics. Figure 2 shows a satellite image of Mansoura.
According to the Mansoura Crises Management Unit’s shelter selection plan, Mansoura has only four shelters to house displaced people in the event of a crisis, and a
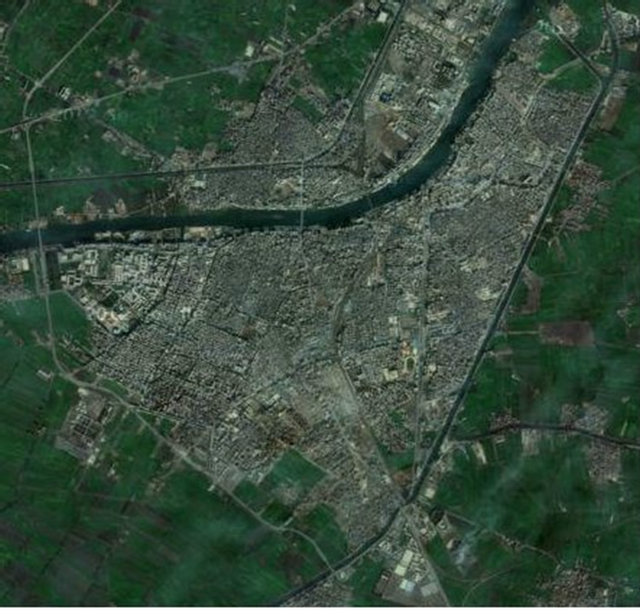
Figure 2. Satellite image of mansoura.
shelter is selected depending on its proximity to the incident. This means that the decision depends solely on the distance factor. These four shelters are: Mansoura Sports Club, Omaal Club (workers’ club), Al Saha Al Shaabia (the popular arena), and Al Magzr Al Aalie (the automated slaughterhouse).
Our methodology was applied to Mansoura to increase the number of shelters and to determine the most suitable evacuation shelter(s). Due to a lack of actual data regarding a real crisis, we simulated a crisis and applied our approach to this virtual scenario.
We used ArcInfo 9.3 as the GIS software to manage the geographical aspects of the case study.
5.1. Preparing Map Data
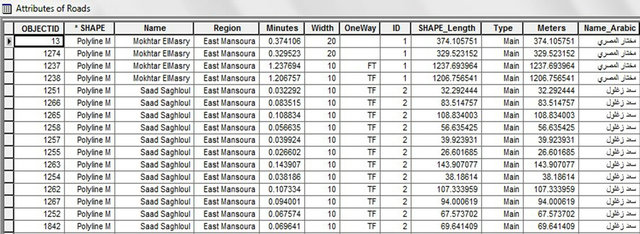
The first step in preparing the data is to create and build the GIS database, known as a Geo-database. Two feature classes were created, Roads and Safety Places. Figures 3(a) and (b) show snapshots of a portion of the attribute feature classes.
The Roads feature class stores data on all roads in the city. It has a Minutes attribute, which stores travel time for each road assuming a vehicle speed of 60 km/h.
The Safety Places feature class stores the shelter location and other shelter-specific data. Because of the small number of open green areas in Mansoura, we included schools as shelters. Thus, we had 32 shelters; 5 parks and 27 schools. The Area attribute stores the shelter’s area in square meters, and the Capacity attribute computes and stores the capacity of each shelter. The capacity is calculate by dividing the Area by 3.716 square meters (40 square feet), according to ARC 4496 requirements for evacuation shelter selection. Figure 4 presents the final view of the digitized map, including the locations of shelters.
 (a)
(a)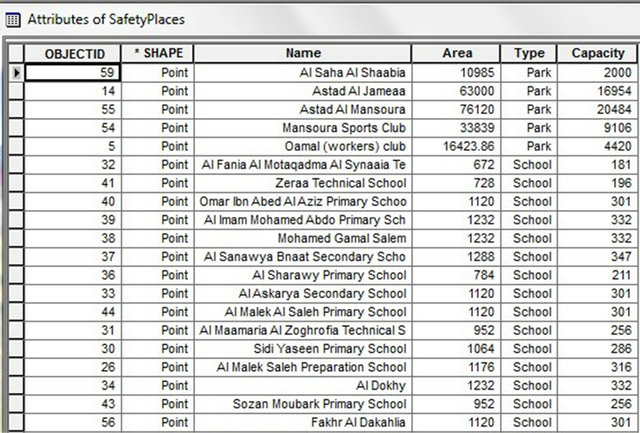 (b)
(b)
Figure 3. (a) Roads feature class; (b) Safety Places feature class.
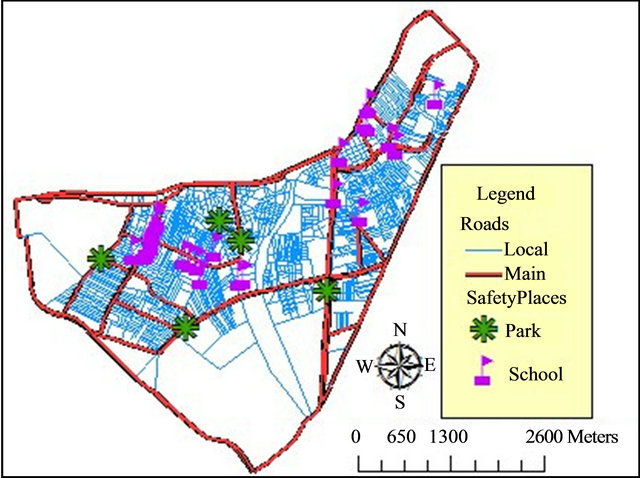
Figure 4. Digitized map of Mansoura with shelter locations.
5.2. Preparing Incident Data
To simulate an evacuation shelter selection process, we first need to position the incident. For network analysis, we use the ArcInfo 9.3 Network Analyst extension. As shown in Figure 5, the incident point is displayed as a small blue square and is located in Mashaal Square in east Mansoura.
According to the Al Dakahlia Emergency Management Unit’s expert, computing an evacuation zone area depends on the type of incident and other related factors. For our simulated case study, the evacuation zone area was set to 500 meters.
The next step is determining routes and their distances from the incident point to each shelter in the city using the network analyst tool. This information is then transferred to the discretization algorithm. The routes from the incident point to all shelters are illustrated in Figure 6.
5.3. Generating Shelters Table
As mentioned in Section 4.2, the Shelters table should contain information about safe areas in the city that can be used as shelters. This information will be used for the classification process. Figure 7 shows a sample of the Shelters table. The Distance attribute contains the continuous values that express the distances, obtained from the network analyst tool, from the incident point to each of the shelters. The Check_Capacity method is used to determine the value of the Enough_Capacity attribute by comparing the capacity of each shelter against the number of displaced people. Finally, a value indicating to what extent basic life requirements are available at the shelter is placed in the Requirements attribute; “H” for high, “L” for low, and “N” for not available. Fortunately, the study showed that all evacuation shelters in the area have basic life requirements; this meant that there were no “N” va-
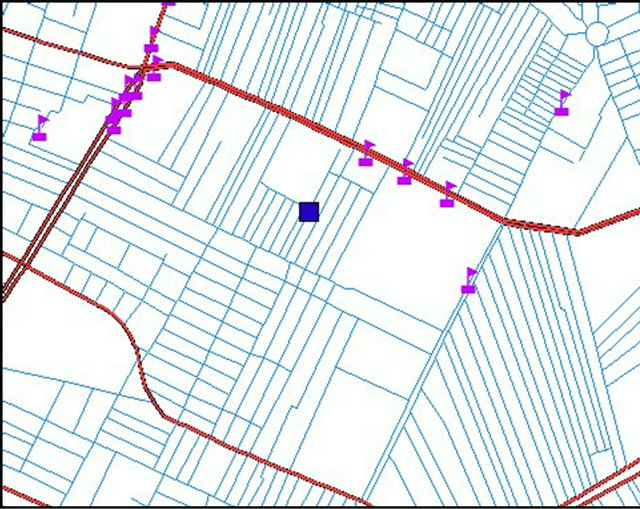
Figure 5. Location of the incident point.
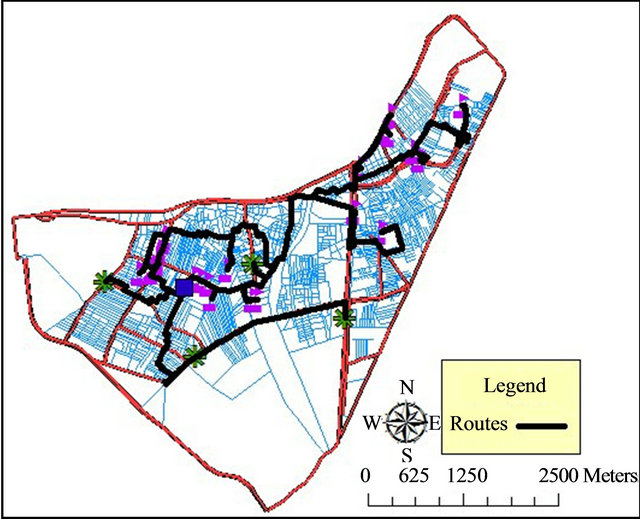
Figure 6. Routes from incident point to all shelters.
lues. However, values for the Requirements attribute did range from high to low.
5.4. Discretization Process
The discretization process was used to reduce the number of values for a given continuous attribute by dividing the range of the attribute into intervals. Here, we use our DiscreteDistances method to assign each value from continuous distance values to the appropriate interval from the intervals Risk, Shortest, Short, Long, or Longest. Figure 8 shows a sample of the discretization results; the Name column represents the shelter name, the Distance column represents the real distance value, and the Distance_Quant column represents the corresponding interval for that value.
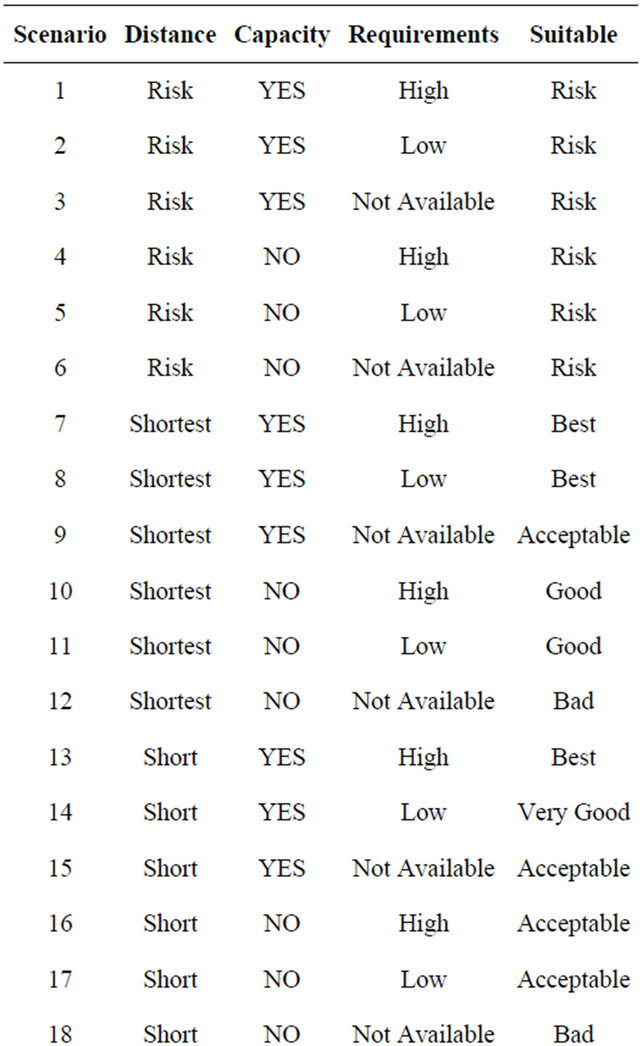
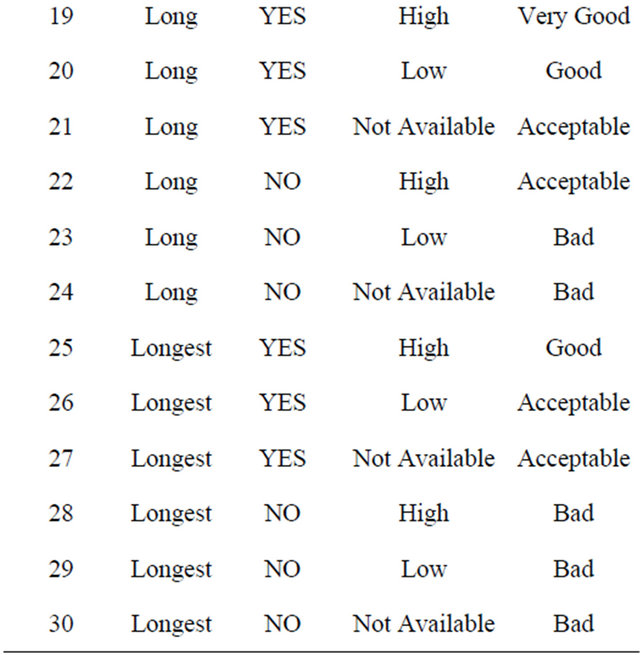
5.5. Generation of the Decision Table and Simplification
The decision table specifies what decisions should be
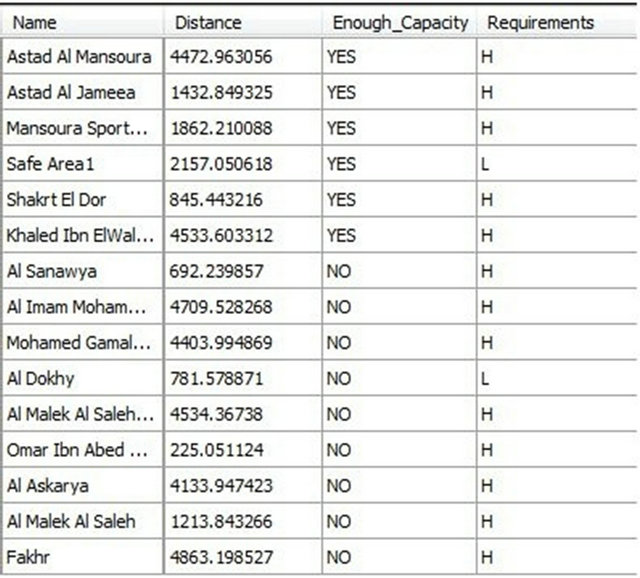
Figure 7. Sample of shelter table.
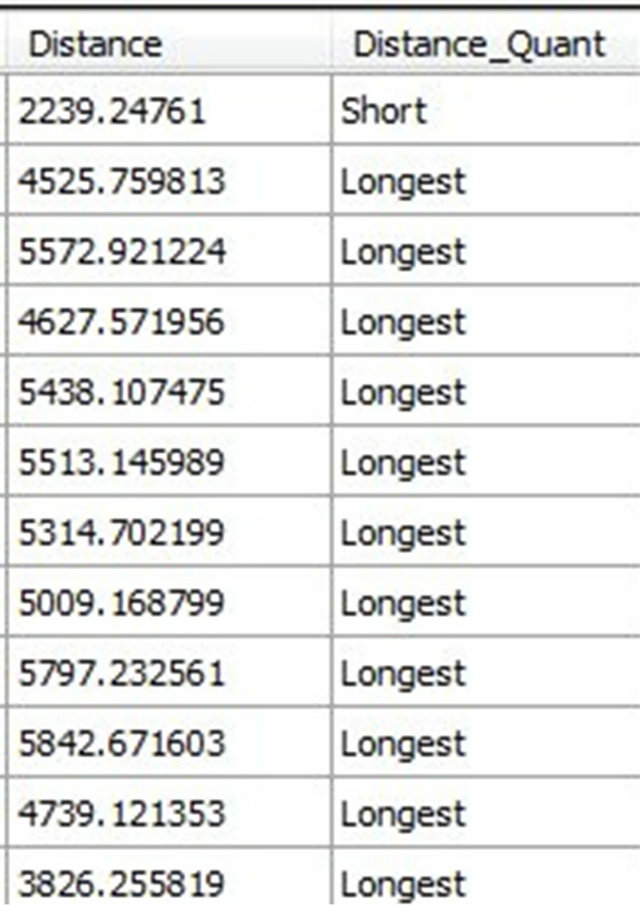
Figure 8. Sample of output from the discretization process.
made when certain conditions are satisfied. In this step, a decision table is created using three conditional attributes (Distance, Capacity, and Requirements), and one decision attribute (Suitable) to indicate the shelter’s degree of suitability. We must then fill the decision table with all possible scenarios for the condition attributes and attempt to capture expert knowledge by consulting expert opinion. In our case study, the Mansoura Crises Management Unit provided expert knowledge for each scenario in the decision table. Table 2 in Appendix A shows the decision table.
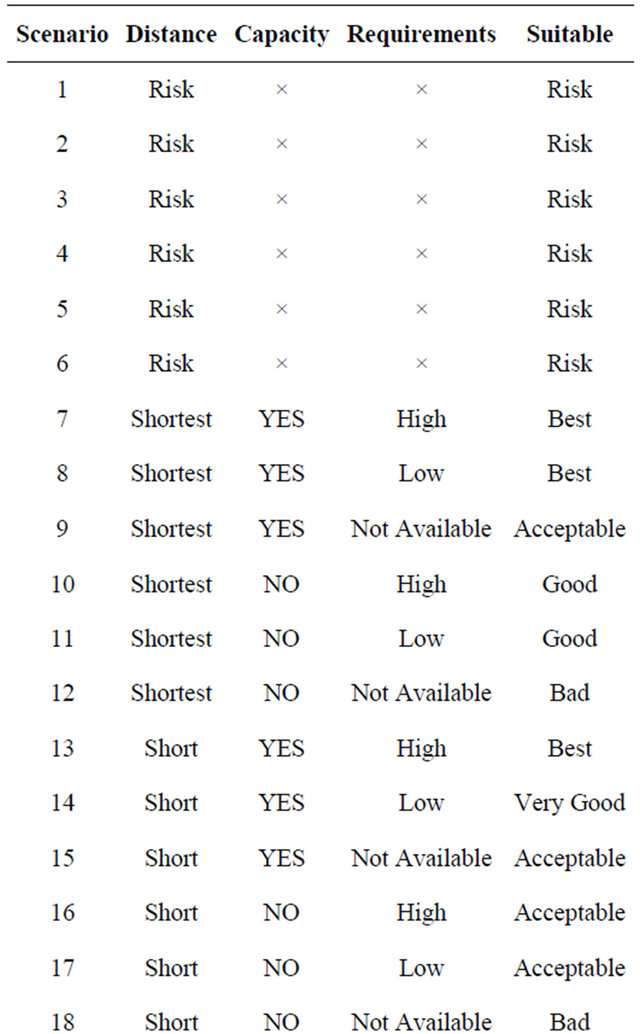
The simplification of decision tables is a very important step; the process reduces the number of conditions so that the same decision can be reached by fewer conditions. As mentioned in Section 4.5, the approach used for table simplification consists of three steps. The following shows the result of each step:
1) The computation of reducts of condition attributes. This is equivalent to eliminating columns from the decision table:
• By removing Distance we found that the table became inconsistent; therefore, so the Distance attribute is indispensable to the decision table.
• By removing Capacity we found that the table became inconsistent; therefore, the Capacity attribute is indispensable to the decision table.
• By removing Requirements we found that the table became inconsistent; therefore, the Requirements attribute is indispensable to the decision table.
The above implies that (Distance, Capacity, Requirements) are relative reducts for this decision table.
2) The elimination of duplicate rows. Since no columns were eliminated, and by examination of the decision table, we found no duplicate rows to eliminate.
3) The elimination of superfluous attribute values. Table 3 in Appendix B shows the decision table after eliminating superfluous values.
5.6. Classification and Choosing the Most Suitable Shelter
From Table 3 we can derive the rules that define the shelter classification process. The 23 rules generated from the simplified decision table are presented in Appendix C.
The classification process begins using the Classify method to apply the 23 rules, defined by the simplified decision table, to the Shelters table such that each shelter in the Shelters table is assigned one of the six predefined classes (Risk, Best, Very Good, Good, Acceptable, Bad).
Afterthe six classes are generated, the Suitable_Shelter method checks each class and determines shelters with the minumum distance and adequate capacity. Figure 9 shows the results of the classification process combined with identification of the most suitable shelter. For our incident case study, Shakrt El Dor School from the Best class was determined to be the most suitable shelter.
5.7. Displaying the Results
To display implementation results, we use the ArcInfo 9.3 Network Analyst tool. This tool displays the route and driving directions from the incident place to the selected shelter. Figure 10 shows the displayed route and driving directions; the bold black line represents the
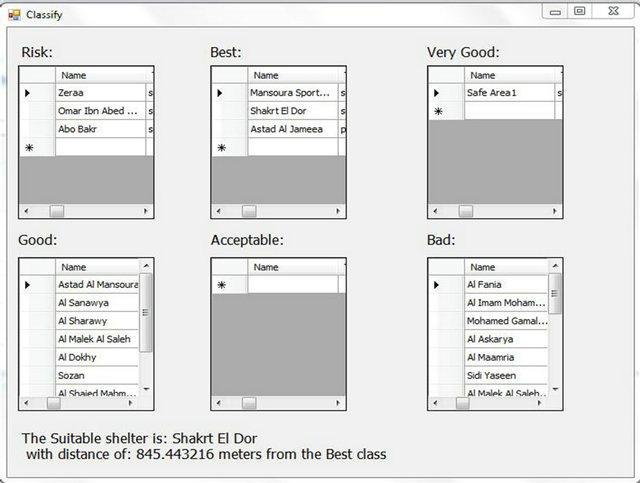
Figure 9. Classification results identifying the most suitable shelter.
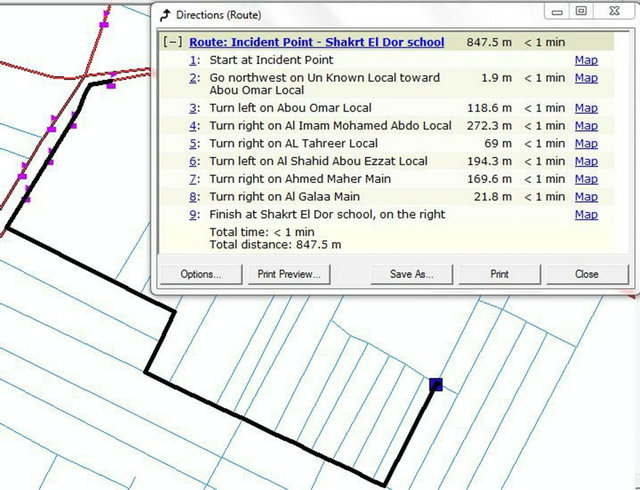
Figure 10. Driving directions to the selected shelter.
route from the incident point to the identified shelter, Shakrt El Dor School.
5.8. Comparison
To measure the effectiveness of our approach, we compared it to the current plan that the Mansoura Emergency Unit uses for selecting shelters. The Mansoura Emergency Unit’s plan has only 4 shelters and selects shelters based on their proximity to the incident. In our approach, we increased the number of shelters to 32, and the suitable shelter was identified using three factors: distance, capacity, and availability of basic life requirements through a set of rough set rules.
The Mansoura Emergency Unit’s shelter selection approach identified the Mansoura Sports Club, which has a route distance from the incident point of 2490 meters. Assuming a vehicle speed of 60 km/h, the travel time to this shelter would be approximately 2 minutes and 49 seconds. On the other hand, our proposed approach selected Shakrt El Dor School as the most suitable shelter. The route distance to this shelter is 847.5 meters; reaching this shelter would take approximately 51 seconds at 60 km/h. From this, we postulate that our proposed approach for selecting the most suitable shelter in the event of a crisis is more effective than the currently used approach.
As shown in Figure 11, the olive line represents route generated by the Mansoura Emergency Unit’s shelter selection approach, and the black line represents the route generated by our method.
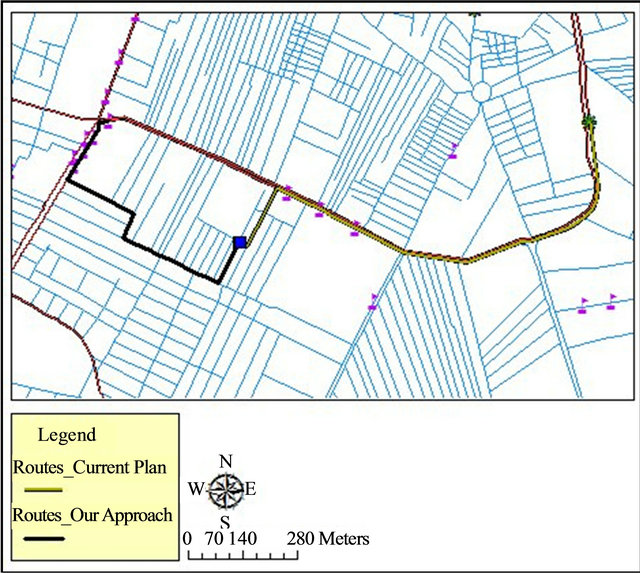
Figure 11. Comparison between shelters selected by the proposed and currently employed approaches.
6. Conclusion and Future Work
This paper proposes a rough set and GIS based approach to select suitable shelters during an evacuation process. The approach uses a GIS to prepare data for roads, shelter locations, and distances from the incident point to each shelter location. A decision table is generated using all possible scenarios from the three criteria attributes (Distance, Capacity, Requirements). The simplification method is performed on the decision table to reduce the number of conditions, and a set of rough set rules are defined from the simplified decision table. Subsequently, the shelter classification process is performed according to the predefined rules, and six classes are generated from this classification process. The shelter with the shortest distance and adequate capacity is identified as the most suitable. Finally, the results are displayed in the GIS environment.
The proposed approach was tested using Mansoura, Egypt as a case study, and a comparison of our proposed approach and the currently used plan was conducted. The comparison shows that our proposed approach is more effective than the currently used plan; it increases the number of shelters in the city and selects the shelter with the minimum distance and adequate capacity.
Further research needs to be done to consider how traffic control strategies and evacuee behavior may impact the evacuation shelter selection process.
7. Acknowledgements
The authors would like to thank people works in Mansoura Emergency Unit for providing us with helpful information about the current plan that the Mansoura Emergency Unit uses for selecting shelters. We would also like to thanks Enago (www.enago.com) for the English language review.
REFERENCES
- Brampton Flower City, “The City of Brampton Emergency Evacuation Plan,” 2011. http://www.Brampton.ca/EN/RESIDENTS/Pages/Welcome.aspx
- M. Saadatseresht, A. Mansourian and M. Taleai, “Evacuation Planning Using Multiobjective Evolutionary Optimization Approach,” European Journal of Operation Research, Vol. 198, No. 1, 2008, pp. 305-314. doi:10.1016/j.ejor.2008.07.032
- J. Coutinho-Rodrigues, L. Tralhão and L. Alcada-Almeida, “Solving a Location-Routing Problem with a Multiobjective Approach: The Design of Urban Evacuation Plans,” Journal of Transport Geography, Vol. 22, 2012, pp. 206-218. doi:10.1016/j.jtrangeo.2012.01.006
- C. Tasi, W. Wang, C. Chen, H. Chen and M. Len, “The Construction of Decision Model for Tourism Disaster Evacuation Based on GIS and Fuzzy Theory,” World Academy of Science, Engineering and Technology, Vol. 54, 2009, pp. 82-85.
- Z. Pawlak, “Rough Sets,” International Journal of Computer and Information Sciences, Vol. 11, No. 5, 1982, pp. 341-356.
- J. Ponce and A. Karahoca, “Data Mining and Knowledge Discovery in Real Life Applications,” I-Tech, Vienna, 2009.
- Department of the Environment, “Handling Geographic Information,” HMSO, London, 1987.
- C. S. Peng, L. X. Jun and Z. C. Hu, “Introduction to Geographic Information Systems,” Science Press, Marrickville, 1999.
- F. Q. Tang and X. Zhang, “A GIS-Based 3D Simulation for Occupant Evacuation in a Building,” Tsinghua Science and Technology, Vol. 13, No. S1, 2008, pp. 85-64.
- American Red Cross, “ARC 4496—Guidelines for Hurricane,” 2012. http://www.redcross.org
- S. Chakrabarti, et al., “Data Mining: Know It All,” Morgan Kaufmann publishing, Burlington, 2009.
- Z. Marzuki and F. Ahmad, “Data Mining Discretization Methods and Performances,” Proceedings of the International Conference on Electrical Engineering and Informatics, Institute Teknologi Bandung, Bandung, 17-19 June 2007, pp. 535-537.
- Z. Pawlak, “Rough Sets Theoretical Aspects of Reasoning about Data,” Kluwer Academic Publishers, Dordrecht, 1991.
Appendix A
Table 2. Decision table.
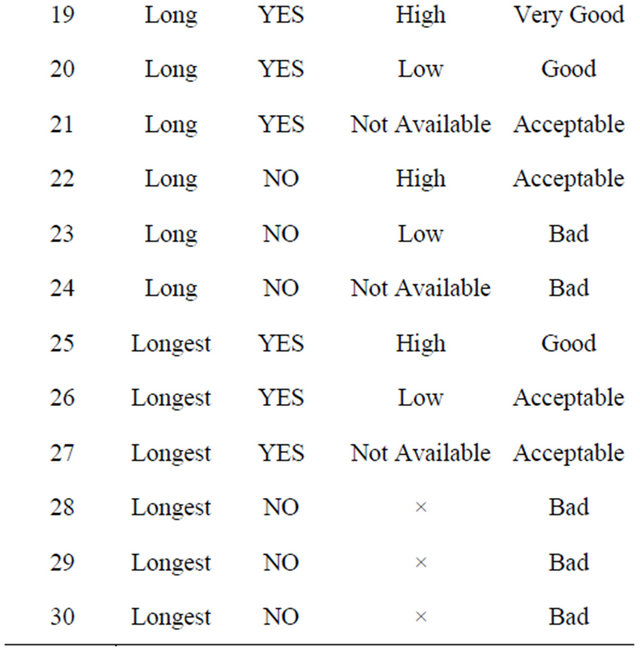
Appendix B
Table 3. Simplified decision table.
Appendix C
Rough Set Generated Rules
Rule 1: (Distance, Risk) Þ (Shelter, Risk)
Rule 2: (Distance, Shortest) ˄ (Capacity, Yes) ˄ (Requirements, High) Þ (Shelter, Best)
Rule 3: (Distance, Shortest) ˄ (Capacity, Yes) ˄ (Requirements, Low) Þ (Shelter, Best)
Rule 4: (Distance, Shortest) ˄ (Capacity, Yes) ˄ (Requirements, Not Available) Þ (Shelter, Acceptable)
Rule 5: (Distance, Shortest) ˄ (Capacity, No) ˄ (Requirements, High) Þ (Shelter, Good)
Rule 6: (Distance, Shortest) ˄ (Capacity, No) ˄ (Requirements, Low) Þ (Shelter, Good)
Rule 7: (Distance, Shortest) ˄ (Capacity, No) ˄ (Requirements, Not Available) Þ (Shelter, Bad)
Rule 8: (Distance, Short) ˄ (Capacity, Yes) ˄ (Requirements, High) Þ (Shelter, Best)
Rule 9: (Distance, Short) ˄ (Capacity, Yes) ˄ (Requirements, Low) Þ (Shelter, Very Good)
Rule 10: (Distance, Short) ˄ (Capacity, Yes) ˄ (Requirements, Not Available) Þ (Shelter, Acceptable)
Rule 11: (Distance, Short) ˄ (Capacity, No) ˄ (Requirements, High) Þ (Shelter, Acceptable)
Rule 12: (Distance, Short) ˄ (Capacity, No) ˄ (Requirements, Low) Þ (Shelter, Acceptable)
Rule 13: (Distance, Short) ˄ (Capacity, No) ˄ (Requirements, Not Available) Þ (Shelter, Bad)
Rule 14: (Distance, Long) ˄ (Capacity, Yes) ˄ (Requirements, High) Þ (Shelter, Very Good)
Rule 15: (Distance, Long) ˄ (Capacity, Yes) ˄ (Requirements, Low) Þ (Shelter, Good)
Rule 16: (Distance, Long) ˄ (Capacity, Yes) ˄ (Requirements, Not Available) Þ (Shelter, Acceptable)
Rule 17: (Distance, Long) ˄ (Capacity, No) ˄ (Requirements, High) Þ (Shelter, Acceptable)
Rule 18: (Distance, Long) ˄ (Capacity, No) ˄ (Requirements, Low) Þ (Shelter, Bad)
Rule 19: (Distance, Long) ˄ (Capacity, No) ˄ (Requirements, Not Available) Þ (Shelter, Bad)
Rule 20: (Distance, Longest) ˄ (Capacity, Yes) ˄ (Requirements, High) Þ (Shelter, Good)
Rule 21: (Distance, Longest) ˄ (Capacity, Yes) ˄ (Requirements, Low) Þ (Shelter, Acceptable)
Rule 22: (Distance, Longest) ˄ (Capacity, Yes) ˄ (Requirements, Not Available) Þ (Shelter, Acceptable)
Rule 23: (Distance, Longest) ˄ (Capacity, No) Þ (Shelter, Bad)