Natural Science
Vol.4 No.8A(2012), Article ID:21661,6 pages DOI:10.4236/ns.2012.428079
Does the sun trigger earthquakes?
![]()
Department of Geophysics, National University of Colombia, Bogotá, Colombia; cavargasj@unal.edu.co, edkastle@unal.edu.co
Received 20 June 2012; revised 21 July 2012; accepted 10 August 2012
Keywords: Solar Cycles; Earthquakes; Geomagnetism; Earthquake Prediction
ABSTRACT
Tavares and Azevedo [1] showed in their article, that there existed a correlation between the solar cycles and the earthquake activity. In their study they used both ancient records, as well as recent seismicity between 1950 and 2010. According to them, a possible link between solar activity and earthquake occurrence is the magnetic field of the earth, that is being changed in shape corresponding to the solar cycles and thus exerts a pressure on the earth’s crust. This study tries to test their results by means of correlation and cointegration, not only using recent solar and earthquake data, but also taking measurements of the Earth’s magnetic field strength into account. The results presented in this work show no clear connection between the seismicity and the 11-year solar cycles. The data rather indicates an anti-periodicity. It is not excluded, that a few strong CME events can influence the triggering of earthquake events, however, this effect is presumably small and plays only a minor roll in the faulting process.
1. INTRODUCTION
The issue of a link between the solar activity and the occurrence of earthquakes is still not quite understood. There are several theories, e.g. Tavares and Azevedo [1] propose that a change in shape of the magnetosphere of the Earth could cause variable pressure in the crust, triggering earthquakes. Other theories are, that space weather could be responsible for changes in the angular velocity of the Earth [2], or that induced magnetic currents might cause heat and thus lower the friction in faults [2,3]. Solar activity seems to correlate quite well with atmospheric data, so that it’s been theorized that air pressure, wind and water level are the link between earthquakes and solar events [4,5].
This work concentrates more on the actual relationship between earthquakes and solar activity and treats the effects causing the correlation only in the aspect of geomagnetic field strength variations. The approx. 11-year solar cycles, represented by the amount of Sunspots are correlated with the magnetic field strength on three different places (Colombia, Germany and Alaska), so to see, if the field shows the same long-term periodicity. Furthermore different types of earthquake data are used to check the results from Tavares and Azevedo [1].
2. DATA
All data mentioned in this section are available as daily and yearly means of the respective values.
2.1. Solar Activity
The International Sunspot Number, provided by the SIDC in Belgium [6] with worldwide contributing observatories, represents a good indicator for the solar activity. The cycles shown in Figure 1 of approximately 11 years can easily be recognized. During the solar maxima, the number of CMEs (Coronal Mass Ejections) increases. Those CMEs consist mainly of Electrons and Protons, but also heavier elements, originating in solar spots [7,8].

Figure 1. Above: Daily mean of the observed number of Sunspots showing the solar cycles between 1950 and 2010. Below: Spectral analysis shows a clear peak at an approx. 11 year period in the solar cycles.
Some of these ejections are directed towards the earth, called magnetic storms that cause e.g. the Northern Lights but also drastically compress the magnetosphere on the day-side of the earth and stretch it on the nightside [9].
2.2. Earthquake Occurrence
Regarding the seismic activity, the worldwide ANSS catalogue [10], the Centennial catalogue, as well as regional data are used to create a representative earthquake index. The data is restricted to events with a maximum depth of 40 km, assuming the postulated effect from the magnetic field to be limited to crustal depths. Furthermore only earthquakes of magnitude 5 and larger are used for the test statistics.
The worldwide ANSS catalogue is created by merging the master earthquake catalogues from contributing ANSS member institutions and then removing duplicate events, or non-unique solutions for the same event. For the study period the catalogue contains 39,343 events with the mentioned characteristics.
For comparison concerning large events also the Centennial earthquake catalogue, which is regarded complete down to magnitude 6.5 between the 1930’s and today, is used [11]. The mentioned catalogue is a composition of different contributing catalogues giving a picture of worldwide significant earthquake events (Figure 2). There are 2081 earthquake registrations with magnitude greater 6.5 in the period of interest.
As Tavares and Azevedo [1] report regionally different effects and for better comparison with the magnetic field strength, the events (from the ANSS catalogue) around the 3 observatories (see following section) are separately taken into consideration. The regions can roughly be described as, Northern South America, Central Europe and Alaska.
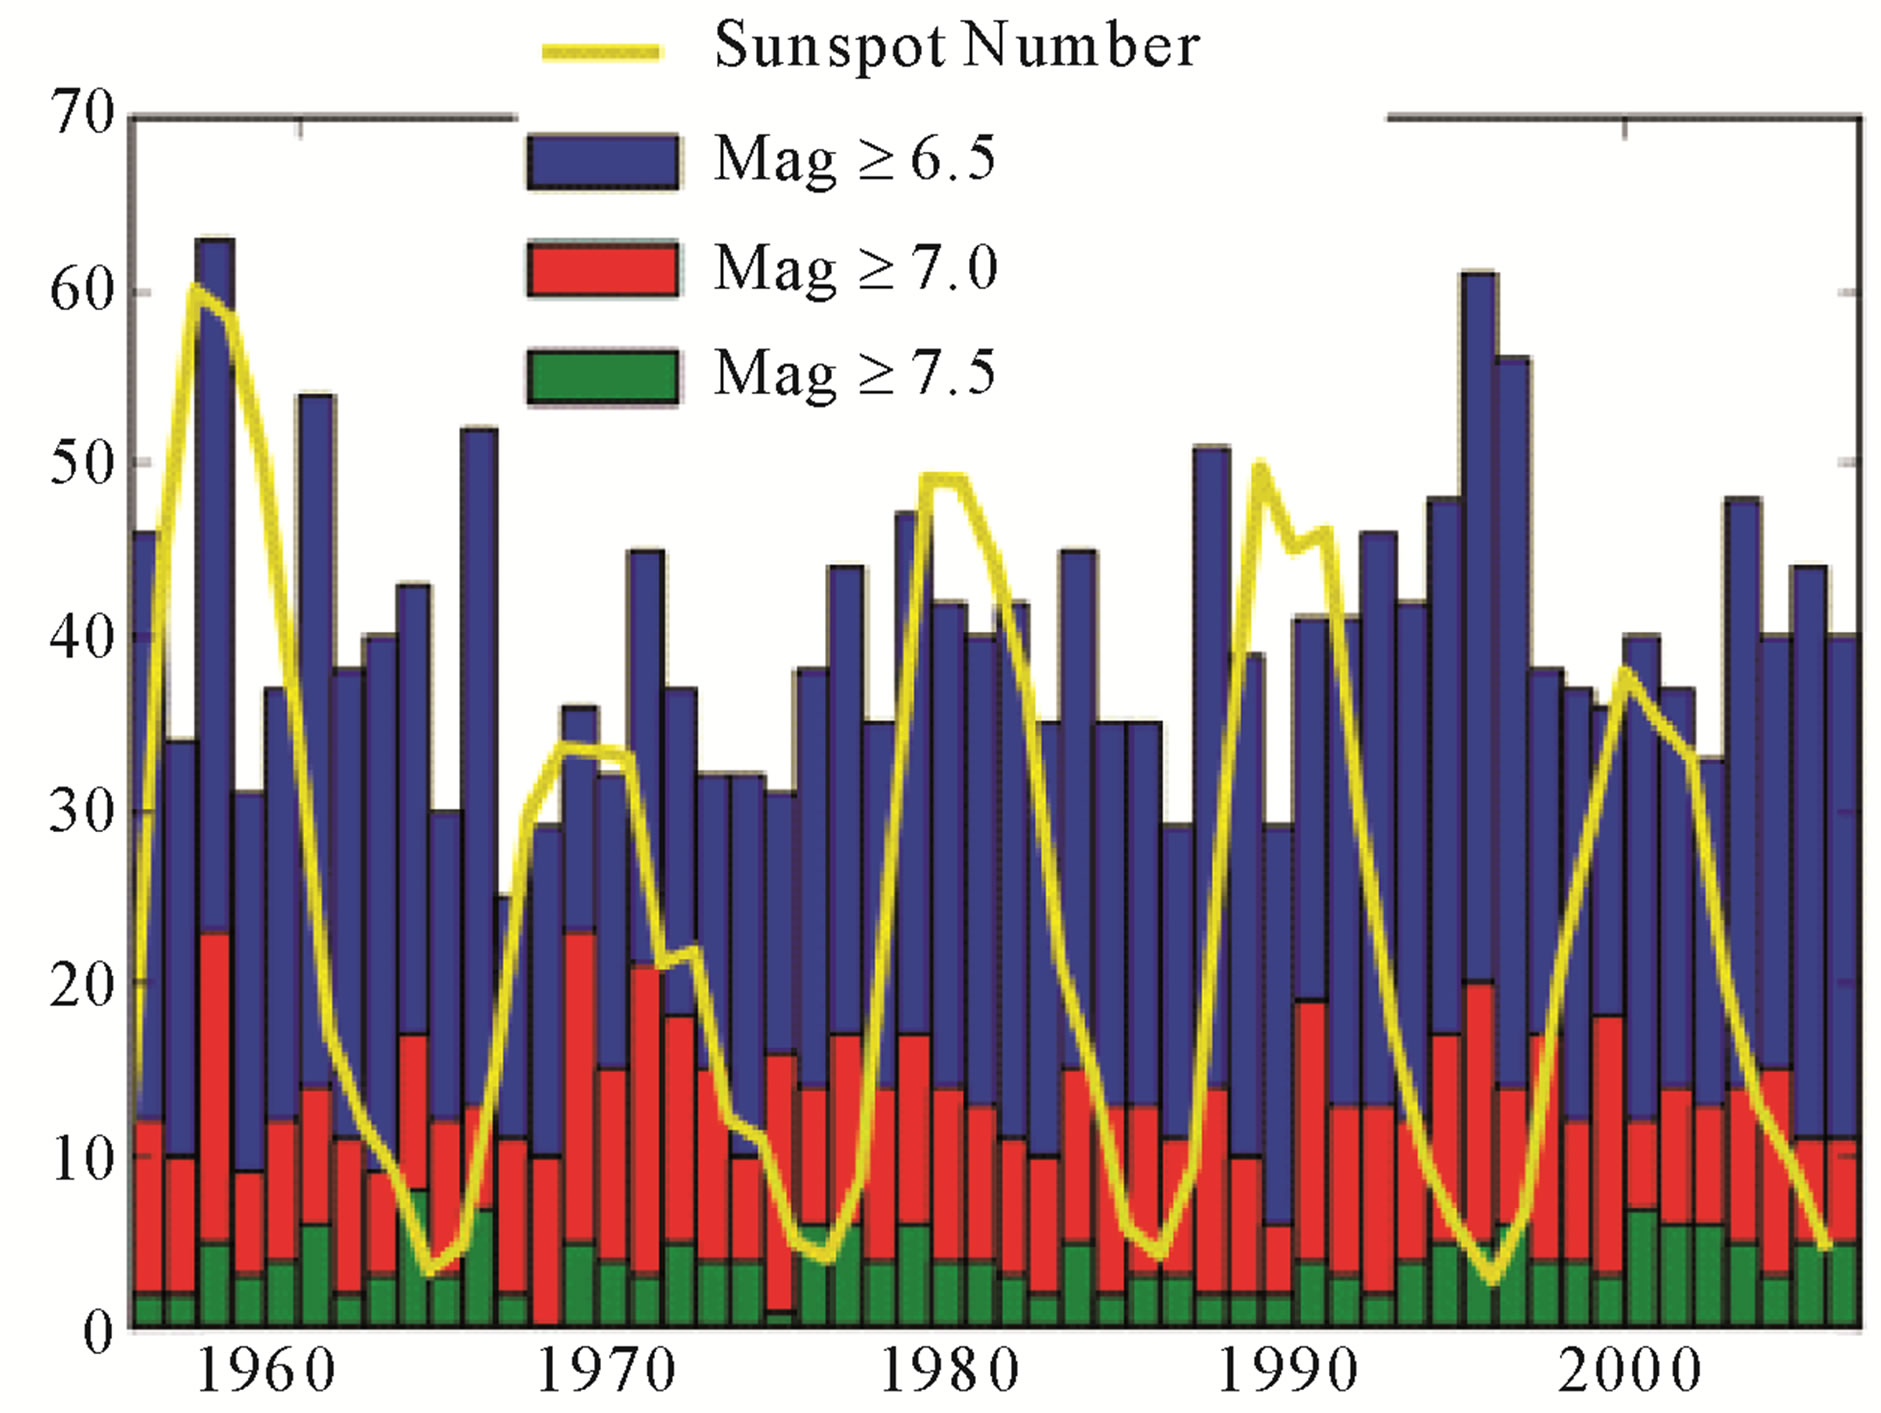
Figure 2. Comparison of the Centennial Earthquake Catalogue data with the sunspot number.
2.3. Magnetic Field Strength
Finally, in the attempt to prove Tavares and Azevedo [1] thesis, total field strength values obtained from the geomagnetic observatories in Fúquene (Colombia), Niemegk (Germany) and College (Fairbanks, Alaska, USA) are used. The Observatories represent not only different latitudes (Figure 3), but also different tectonic regimes. Alaska and Northern South America are mostly characterized by subduction earthquakes, whereas Central Europe represents in large parts stable continent with increasing activity towards the Mediterranean.
Especially the data from Fúquene at the beginning of the observation period (starting 1955) shows errors or missing values. In all three time series the data is revised and corrected for such flaws. However, as the goal of this study is to find the 11-year cycles of the solar activity, minor errors in the range of days in the appearance of the curves are not expected to influence the results.
3. METHODS
3.1. Cross-Correlation
The standard cross-correlation method is adopted to find patterns in the occurrence of Earthquakes that resemble the 11 year solar cycles. Thus, the results have to show significantly higher correlation coefficients than the null-hypothesis (cross-correlation of the Sunspot Index with a random time series). The standard numerical cross-correlation function of two vectors x and y of length N is given by:
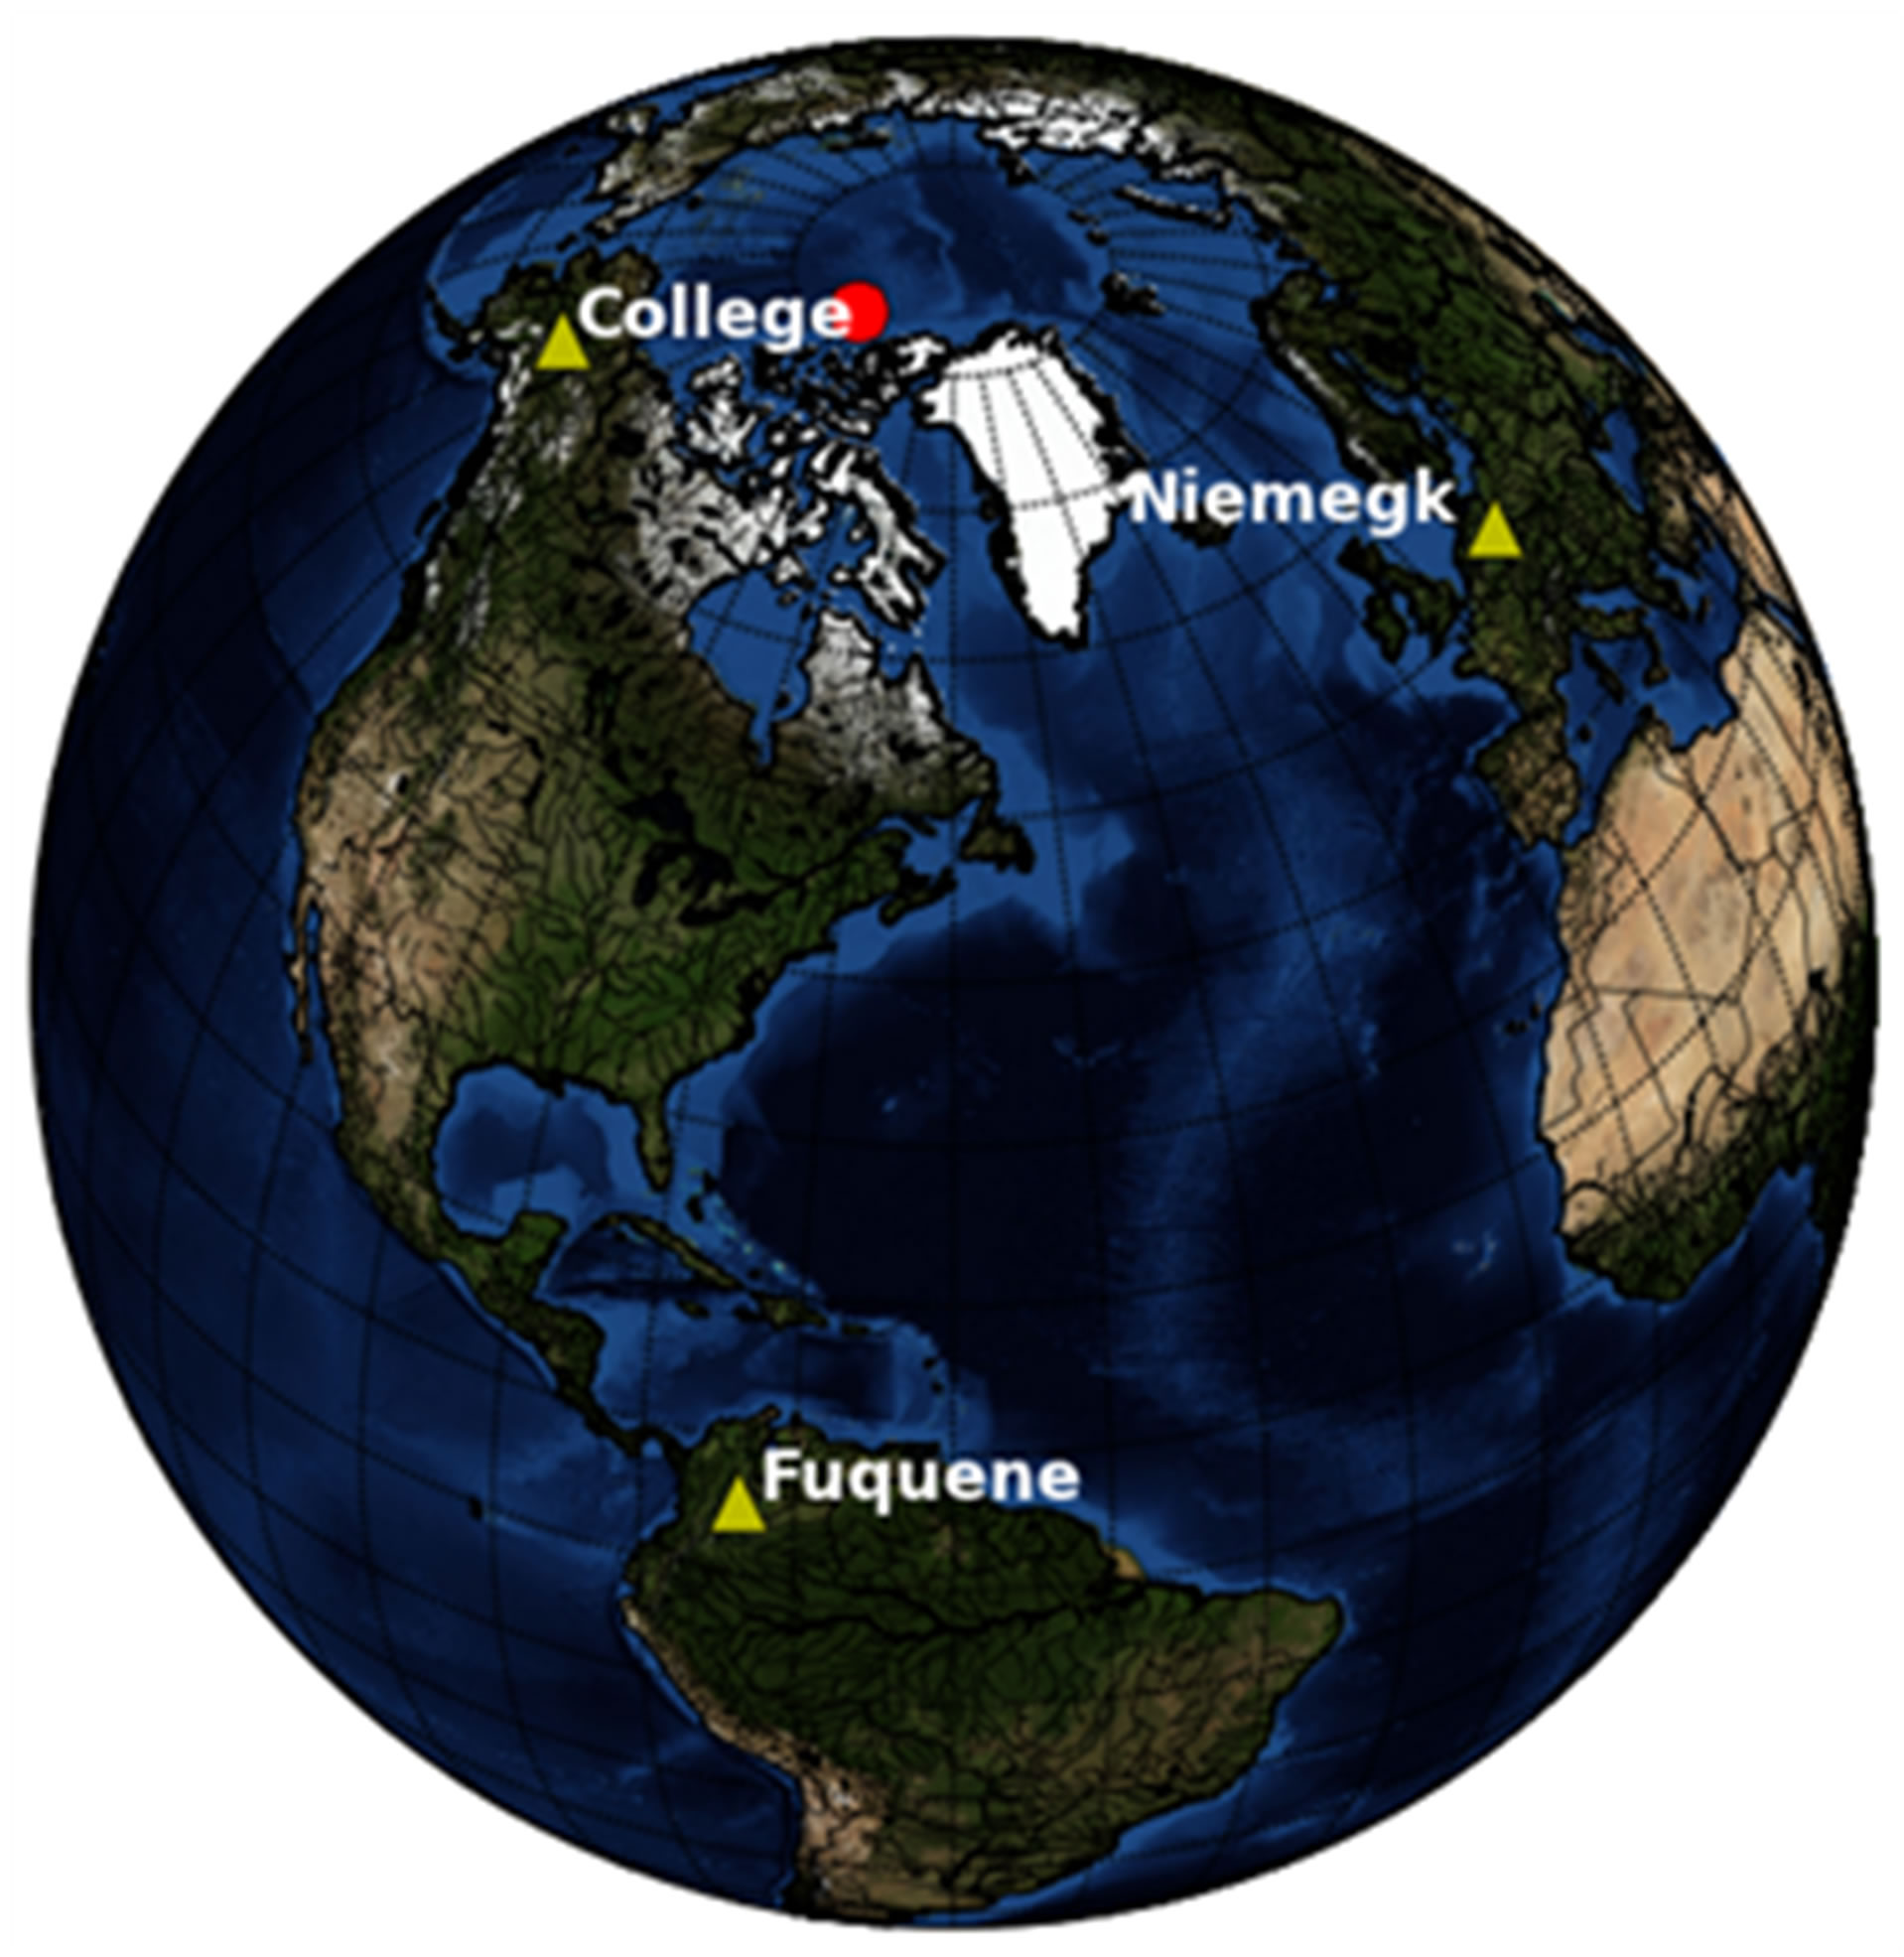
Figure 3. Overview map of the geomagnetic observatories. The red dot indicates the position of the geomagnetic North Pole.
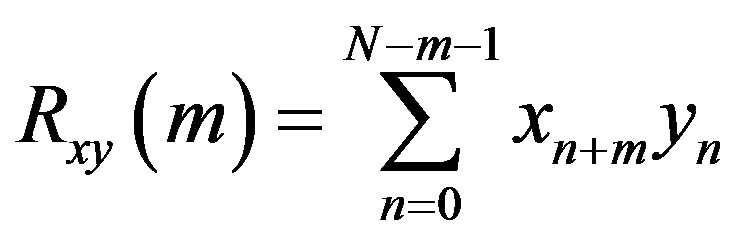 (1)
(1)
For comparison, the series x and y are normalized before using cross-correlation, so that their autocorrelations at zero lag (m = 0) is identically to 1.0. Moreover, possible trends were removed before applying the algorithm. The cross-correlation has also the characteristic of showing common periodicities in the correlated series, for example in the three magnetic field strength variations.
3.2. Cointegration
The cointegration method is a statistical method mostly used in economics to find dependencies in two or more time series. The basic concept can be expressed in the following manner (Definition from Sørensen [12]):
The two time series y t and x t are cointegrated if there exists a parameter α such that
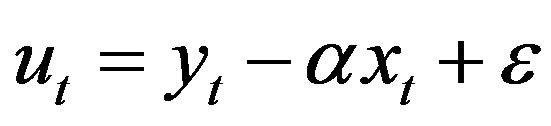 (2)
(2)
is a stationary process.
This definition applies to I(1) processes for  and
and , which means they are integrated of the order 1, thus becoming stationary after differentiation. One also says the process has a unit root, i.e.
 for a = 1 (3)
This is the equation of a random walk, so that at every time point the value of  depends on the value before and a random term. A standard unit root test would be e.g. testing the Null-Hypothesis of a = 1 (unit-root) versus a < 1 (stationary). For a = 1, the time series
  is nonstationary and will be drifting from its initial value with increasing standard deviation. The series
  and
and  are cointegrated if they are both following such a random walk, but having a common trend, i.e. they don’t drift away too far from each other, such that there is always a relationship between the variables as in Equation (2).
The cointegration relationship is also valid for processes of higher order I(p) and there are methods to test cointegration for more than two variables, for example the Engle-Granger Cointegration Test, used in this article [13]. The basic concept of this test is a regression on the following relation ( being the n-th time series of same length as
 ):
):
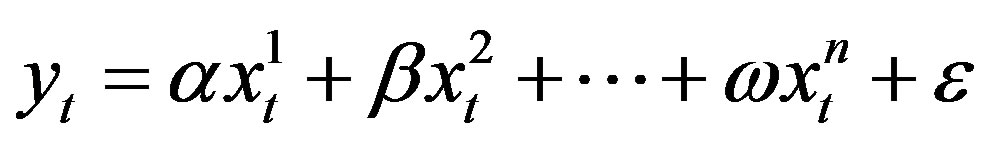 (4)
(4)
After calculating the regression, the residuals are tested for a unit-root.
The big advantage of cointegration testing is that normal regression for uncorrelated traces can, in the case of random walks, yield results showing a correlation between the time series where in fact there is none. This phenomenon is called spurious regression.
4. RESULTS
4.1. Cross-Correlation
Figure 4 shows the results of cross-correlation between the Sunspot Number and the Earthquake and Magnetic Field Strength Data, respectively. A graphical comparison of the Centennial Data is also given in Figure 2. The maximum time lag in Figure 4(a) is restricted to ±2 years, assuming that the effects from high solar activity should be found in that time window. For comparison also the mean-cross-correlation-coefficient between 500 random series and the Sunspot Index is shown as a limiting line.
It becomes quite clear, that none of the series used shows a significant positive correlation. However, it seems like there is a negative correlation especially pronounced for the worldwide ANSS catalogue, which plots

Figure 4. Maximum correlation coefficients for time lags ±2 (a) ±5 (b) years. Red: Sunspot Number and Magnetic Field Strength; Blue: Sunspot Number and Earthquake Data (≥x refers to Magnitudes from the Centennial Catalogue). Random Mean is the average correlation coefficient of 500 correlations between the Sunspot Number and a random series.
at exactly zero time lag with a coefficient of almost –0.4 (mean random + one standard deviation ≈ ±0.3). It is quite noticeable, that there seems to be stronger negative correlation. The picture changes only slightly when considering time lags of up to five years (Figure 4(b)). However, a time lag of five to six years means, as well as negative values, anti-cyclicality, i.e. more earthquakes in solar minimum phases. The maximum positive correlation coefficient can be found in the comparison of the Sunspot Number with the Earthquake Data from Central Europe, with a value slightly above 0.3 and a time lag of four years. A more detailed picture of this particular case is given in Figure 5(b).
Furthermore, common periodicity in the magnetic field strength data is found according to Figure 6. The most prominent feature is an approx. 20 year cycle that seems to be a stable feature of all three correlations.
Yet another approach is the comparison between the magnetic field strength and the regional earthquake data.
 (b)
(b)
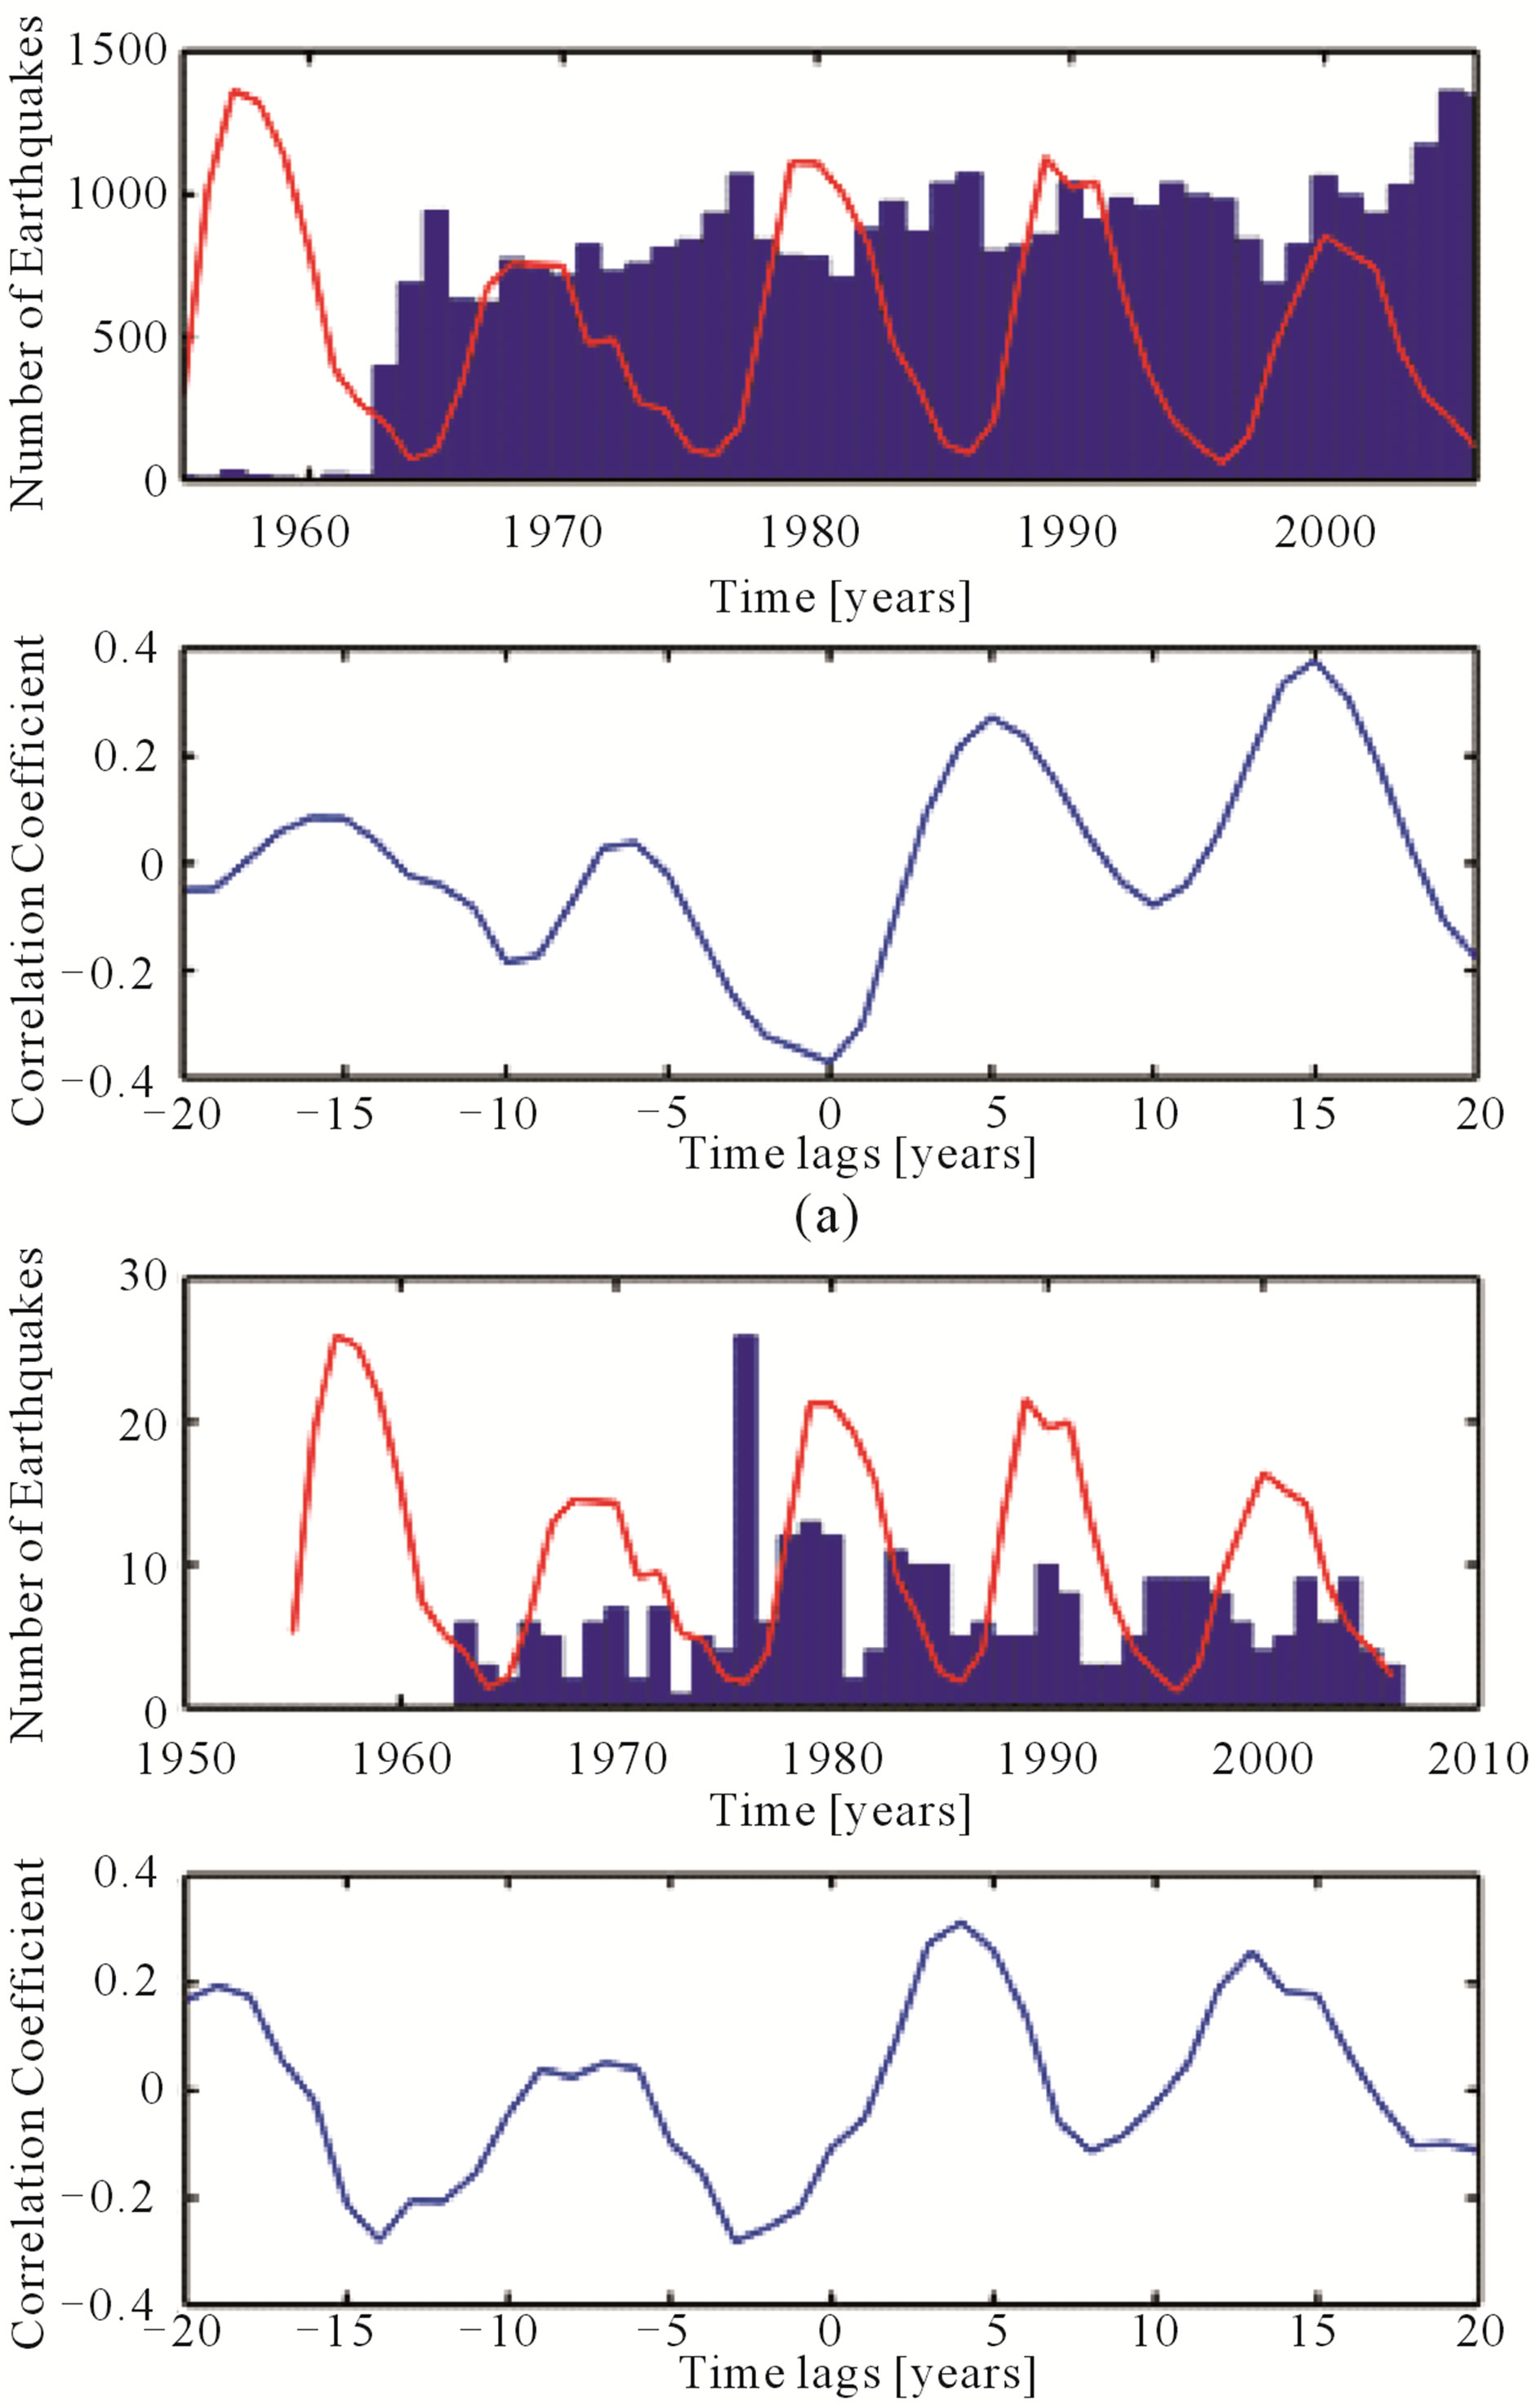
Figure 5. (a) Worldwide earthquake occurrence from ANSS catalogue ((b) for Central Europe) and Sunspot Number (red line). The correlation coefficients for up to 20 years time lag are given below.
It shows the highest correlation for the case of Niemegk and Central Europe. The correlation coefficient is about 0.4, whereas correlation with a random earthquake profile plus one standard deviation is about 0.3. However, Figure 7 shows that the correlation almost exactly resembles the input values of field strength at Niemegk. This also means that there is equally high correlation not only for zero, but also for about 18 years time lag, which is difficult to explain.
4.2. Cointegration
As mentioned in Section 3.2, in order to adopt the cointegration method it is important, that the analysed time series have a unit root. Intuitively one already suspects the geomagnetic records to meet the criteria for
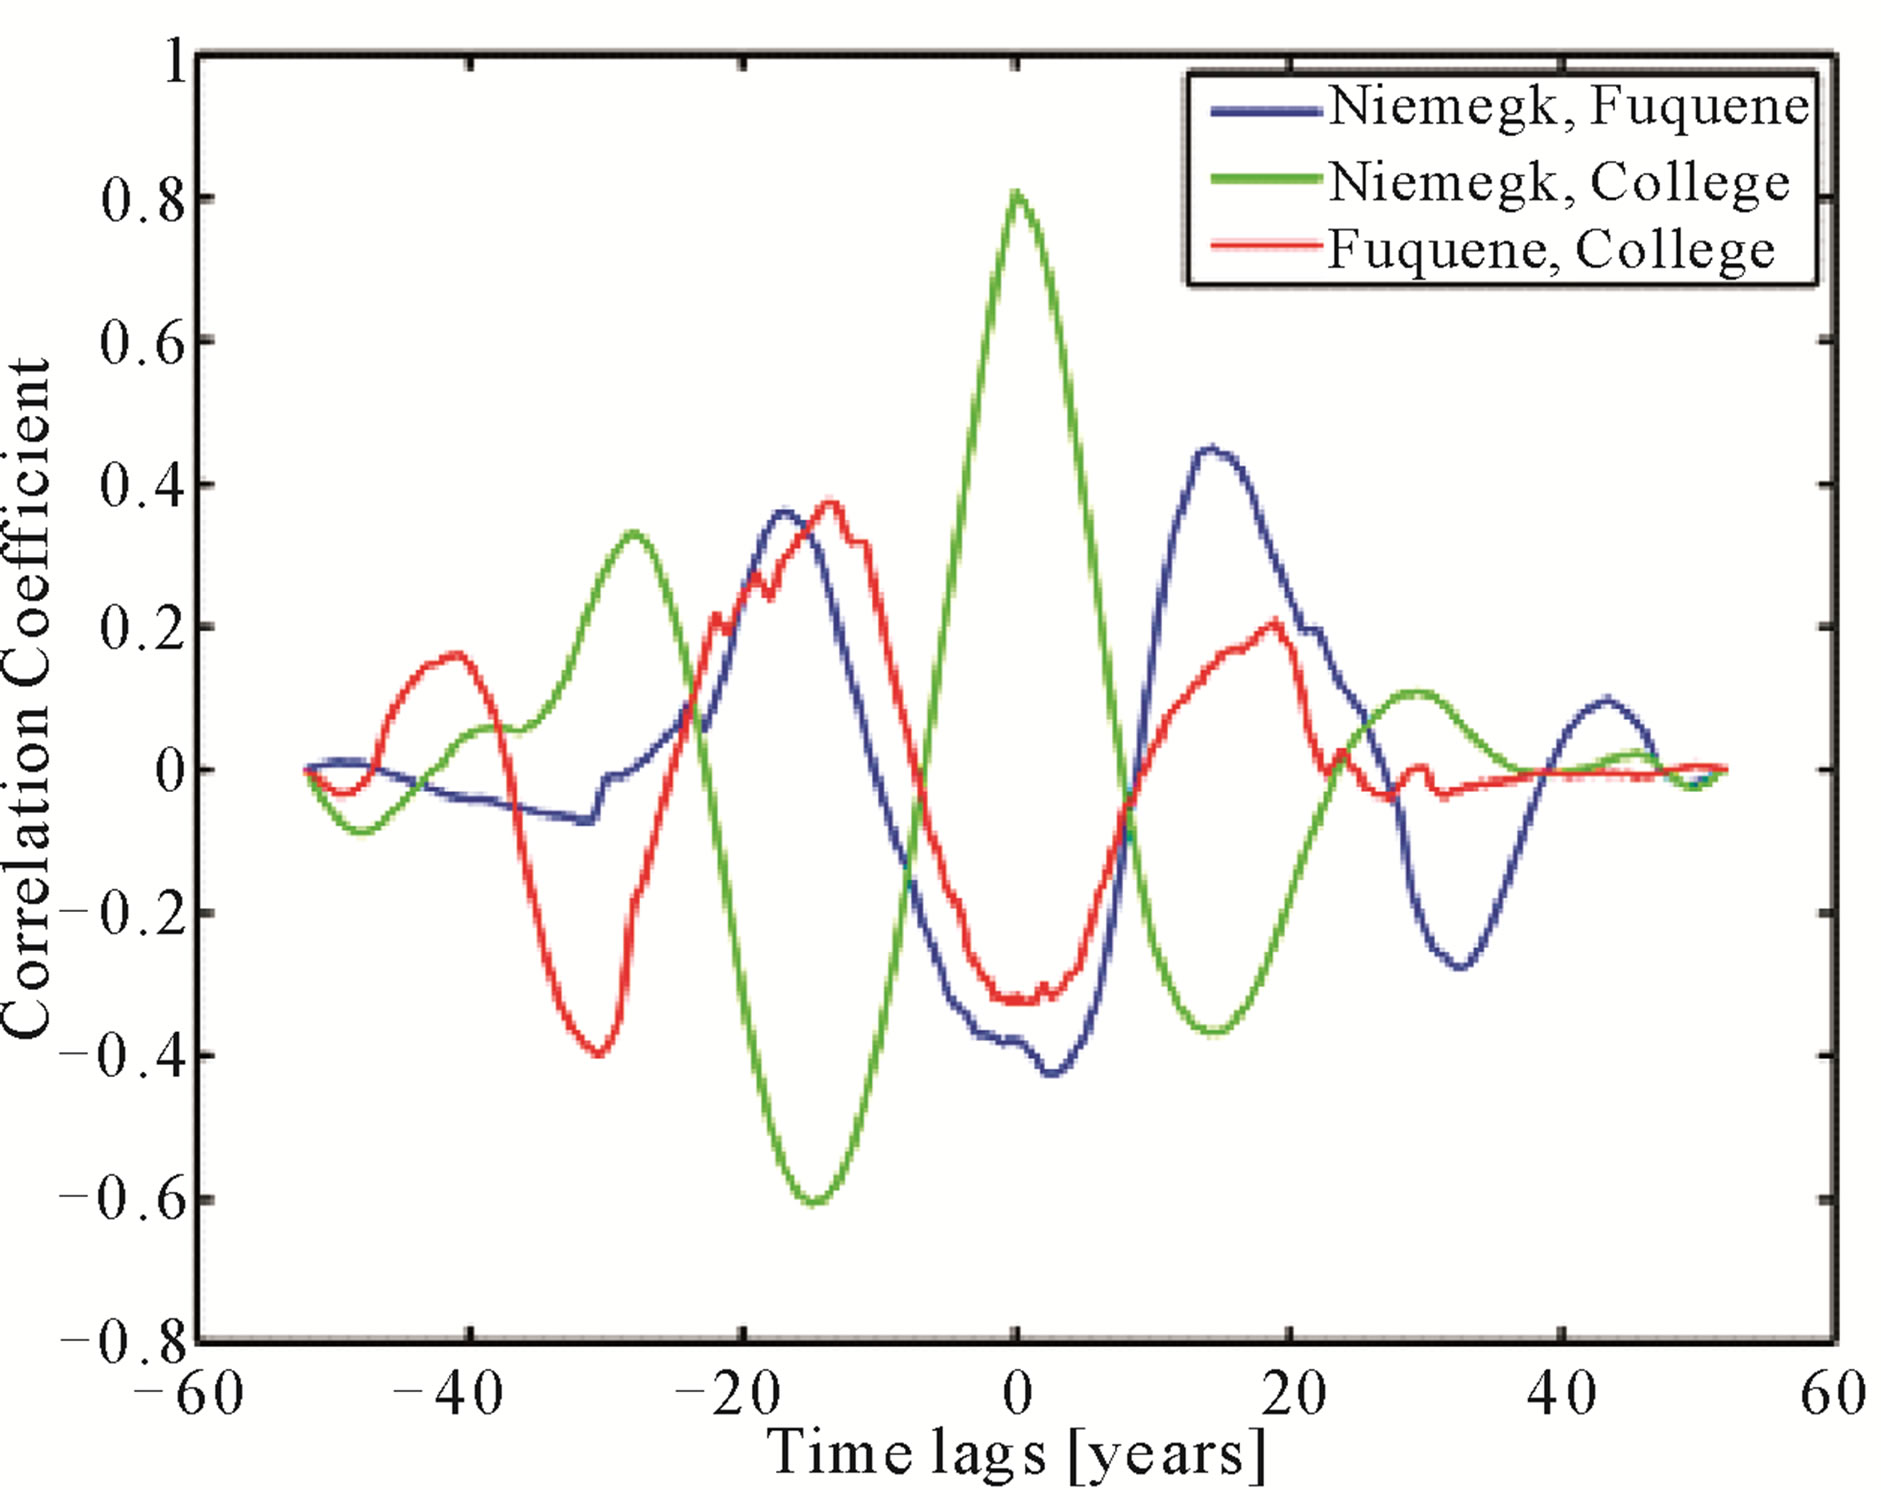
Figure 6. Correlation of the magnetic field strength recorded at Fúquene (Colombia), Niemegk (Germany) and the College Observatory (Alaska).
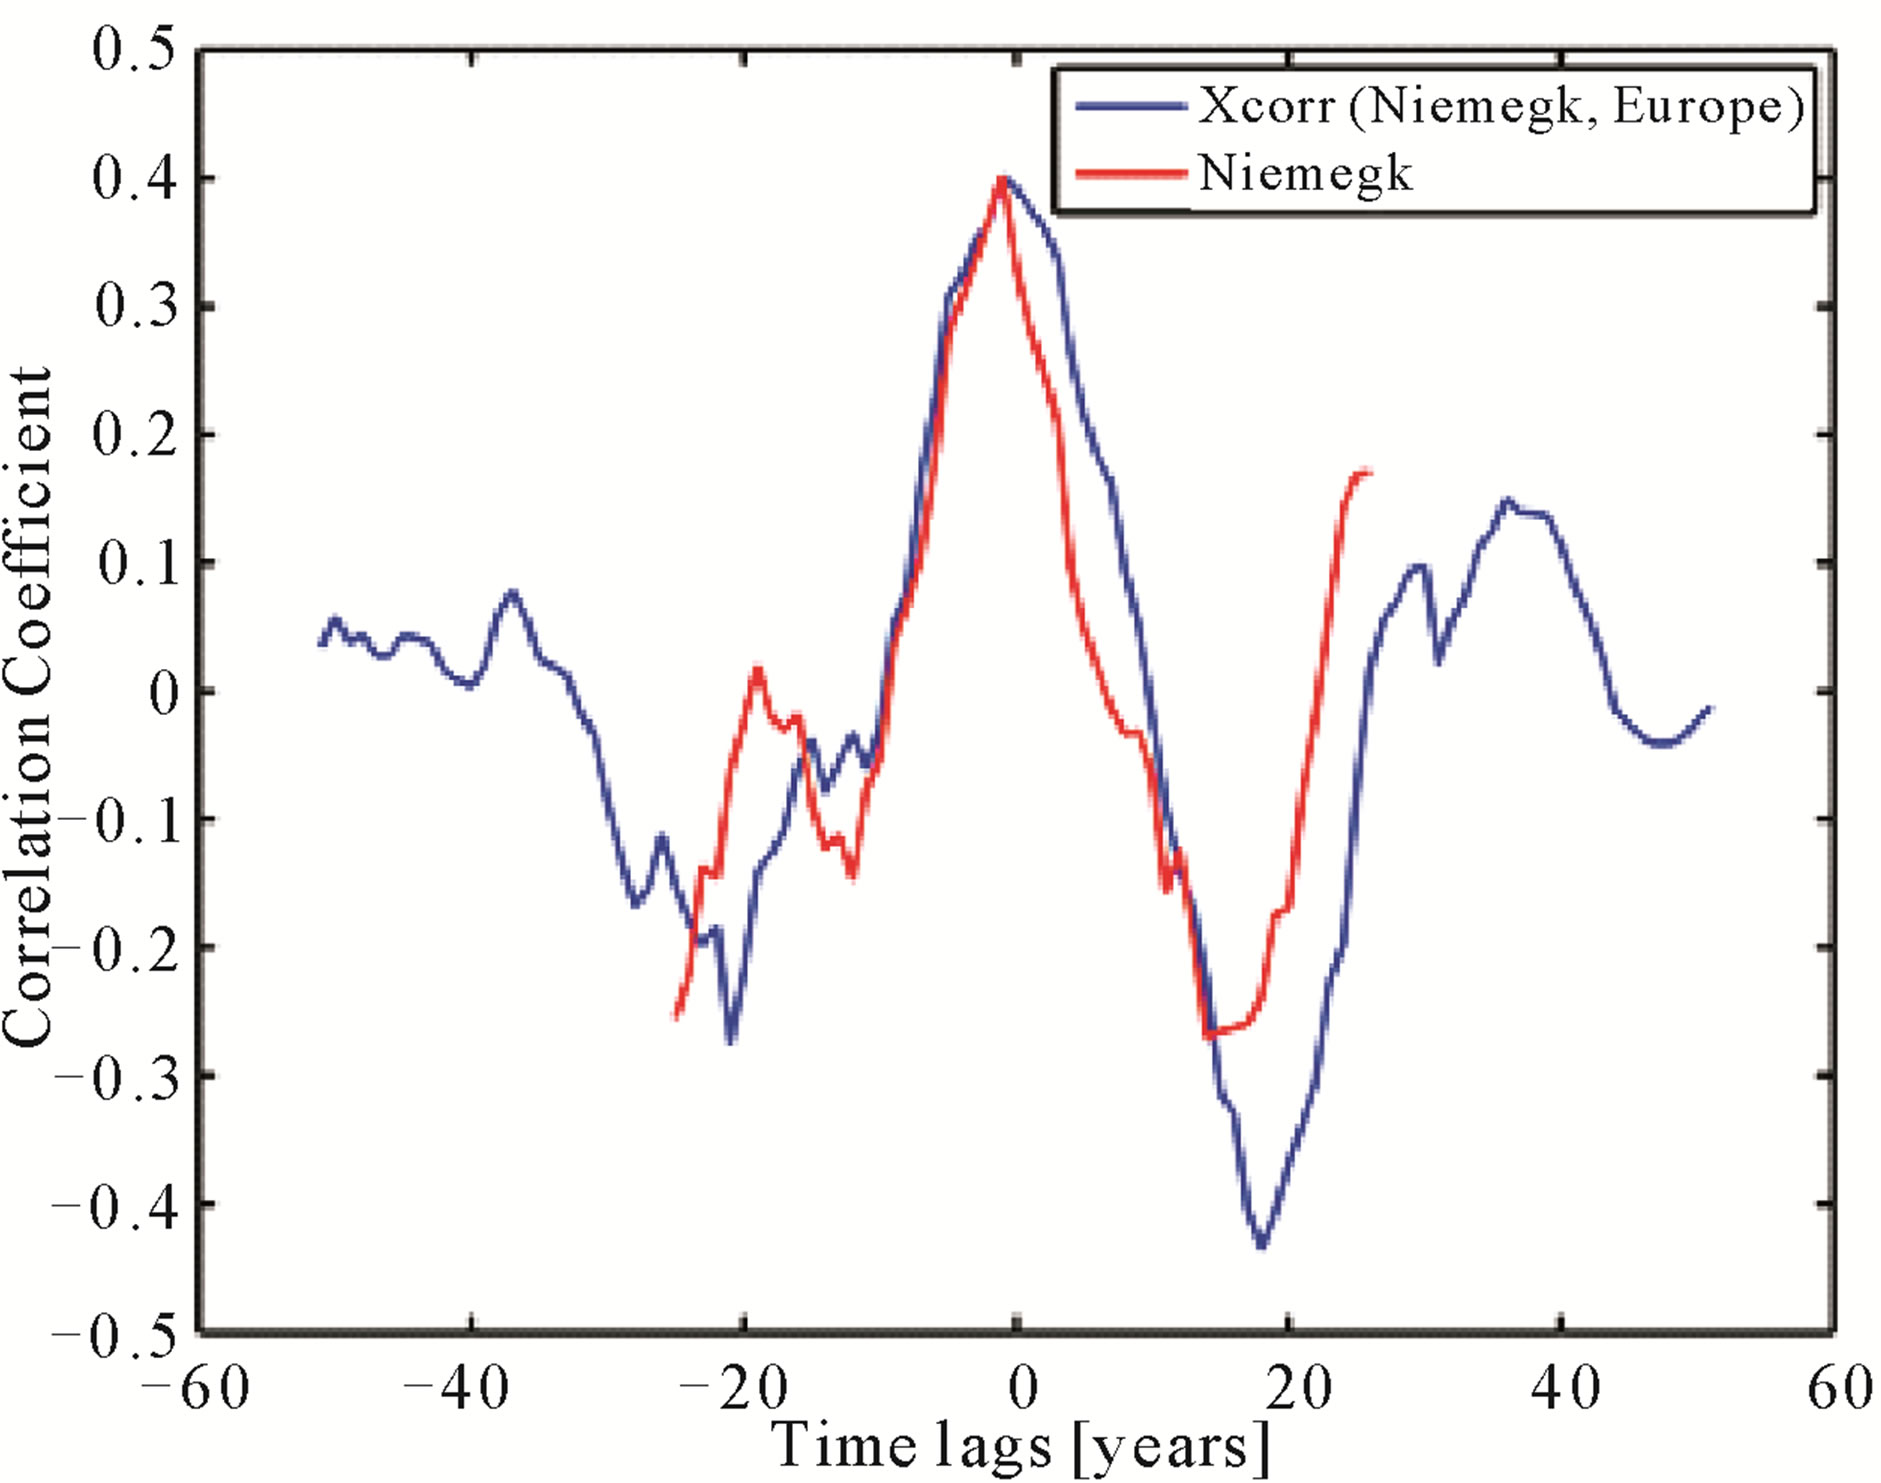
Figure 7. Correlation of the magnetic field strength recorded at Niemegk (Germany) and the Earthquake occurrence in Central Europe from the ANSS catalogue. The red line shows the curve form of the magnetic field strength in Niemegk (de-trended).
cointegrated time series. The series follow a random walk (secular variations) with some degree of individual, random freedom (magnetic storms, currents in the ionosphere...), but undoubtedly their general behaviour is linked to each other.
On the other hand, the Sunspot Number does not show those random walk characteristics, resembling a stationary process with a rather strict periodicity. Also the earthquake occurrence is stationary, following (in a basic model) a Poisson Distribution.
The test statistics show indeed a cointegration relation between the three magnetic field strength records. The graph for the Residuals ut in Figure 8 is given by
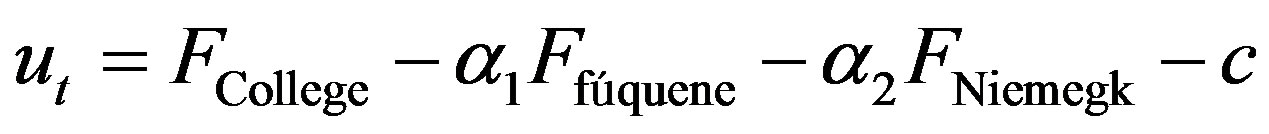 (5)
(5)
where  are the records from the observatories,
  constant factors and c is a constant that shifts the curve to zero mean.
Applying the cointegration with the Sunspot data, although it contains no unit root, results either in an associated factor of α almost zero, or, in the case of SSN = yt in Equation (4), in the residuals being identically to the Index. Although this is not exactly a valid test, this could mean that Sunspot Number and magnetic field strength (in a relation of year-long cycles) are independent. If there was a common trend or cyclicality the curve form of the Sunspot Index wouldn’t appear in the Residuals.
As the earthquake data is linked to the same problem, further cointegration testing is omitted.
5. DISCUSSION
First of all it’s notably that the geomagnetic field strength does not show a clear correlation with solar activity (Figure 4). This fact, however, is expected, given
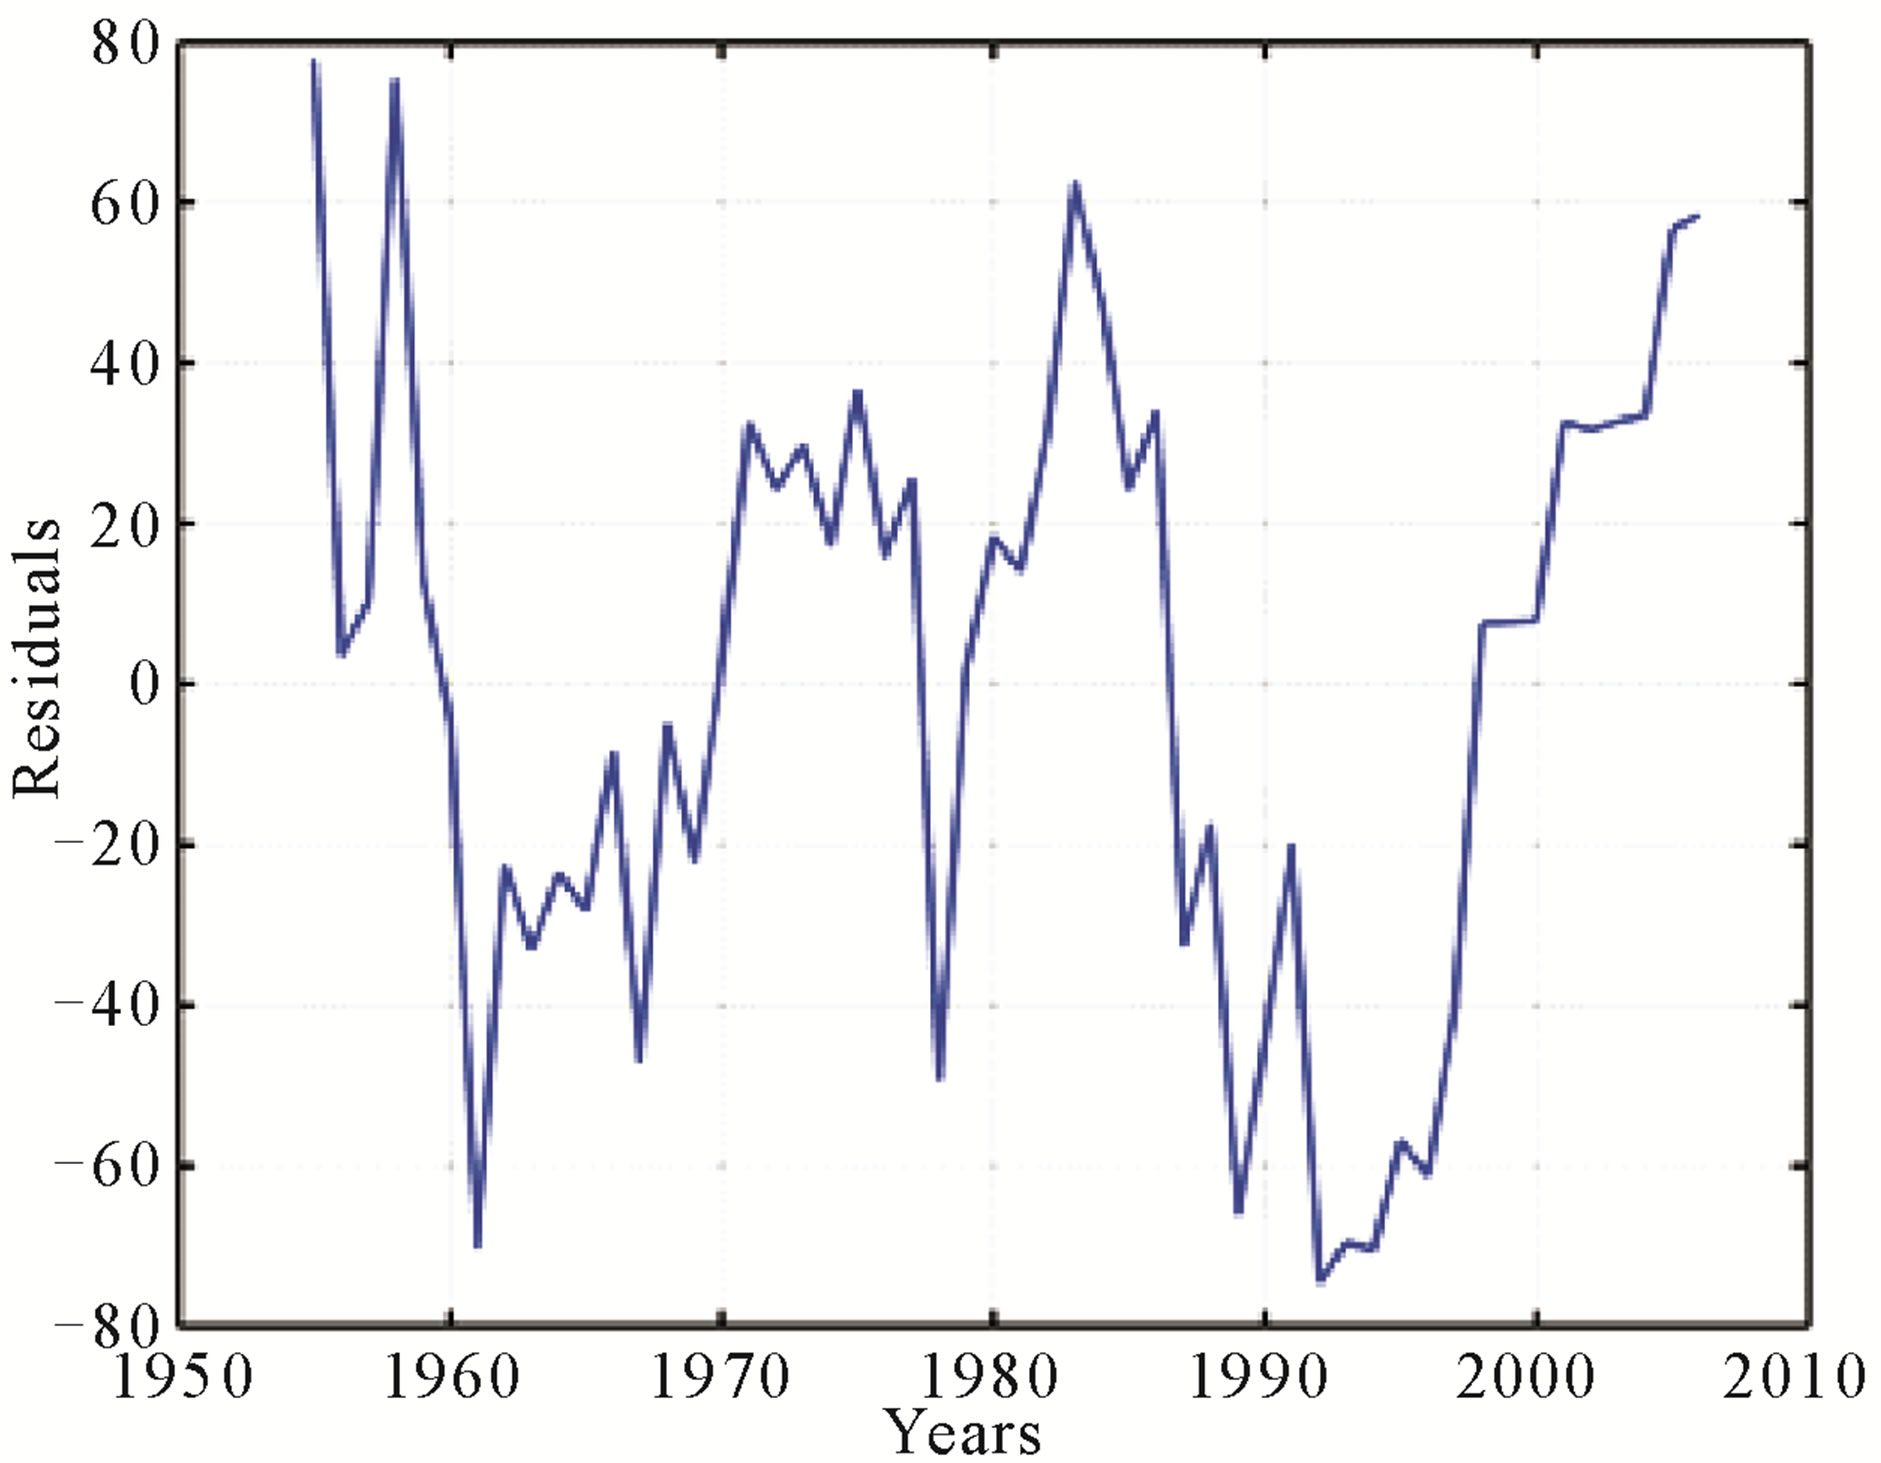
Figure 8. Residuals from the cointegration analysis according to Equation (5). a1 = 0.422; a2 = 1.440. The Residuals basically show the difference in the three magnetic field strength records, whilst common features are cancelled out.
the data used in this study. During solar maxima the number of magnetic storms increases considerably, yet, those are effects, typically in the range of hours to few days. Hence, the long-term magnetic field strength is not expected to be influenced strongly by these disturbances. The correlation between field strength and regional earthquake events doesn’t resolve this issue (Figure 7), but is rather inconclusive, although the correlation coefficients are slightly higher than random correlation.
The cointegration analysis including the Sunspot Number, yields the same result, as the residuals resemble the variations in solar activity. This could mean that there is no direct link between the two values, i.e. no cointegration, although the results cannot be seen as proof, as the basic prerequisite condition of a unit root has been ignored.
Although the three geomagnetic observations are cointegrated, the approx. 20 year periodicity in Figure 6 is possibly due to geomagnetic jerks. These are non-predictable impulses or inversion of the trend-direction of the declination of the magnetic field [14]. Those variations, that are still not very well understood, have roughly shown that periodicity in the last 50 years. However they include no direct information for this report.
Concerning the earthquake data, there also seems to be no strong relation between their occurrence and the solar activity (Figure 4). It’s remarkably that more anti-cyclical correlation is found, although one has to keep in mind, that the regional catalogues (CEurope, Alaska, NSAmerica) make part of the ANSS catalogue and thus don’t really show independent results. Taking greater time shifts between the series into account, there is data plotting above the mean random-correlation limit. But not only the time lags are difficult to explain, but it’s also still more likely for those values to plot randomly in this field.
Tavares and Azevedo [1], on the other hand, state a positive result in their study regarding the connection between the solar cycles and the earthquake activity. Positive in the sense of a existing relationship and in the sense of higher earthquake activity during solar maxima. Firstly, they examine historic events, that coincide with the Maunder (1645-1720) and the Dalton (1790-1820) minima. They find an overall lower number of events during those two periods, though the activity in tectonic regions of mostly strike-slip faults is slightly increased. Tavares and Azevedo [1] propose that high solar activity could compress the magnetic field, exerting a pressure on certain tectonic settings, whereas during a minimum, the energy is liberated in zones characterized by strike-slip faulting or subduction zones.
Their observations are backed by observations during the last 50 years, similar to this study. The last maximum (around 2000), earthquakes seem to have occurred more frequently on different tectonic plates. This result, however, is not universal for all parts of the earth and not during all of the 5 maxima between 1950 and 2005. Their observations during the modern period seems exclusively based on graphical comparison and not one number is shown in this part. Also, the comparison of occurrence during the two historic minima vs. the whole time period are hardly statistically robust, as there are only small deviations from a normal pattern observed. Those effects could probably as well be explained by natural random behaviour.
The results of this work rather contradict the observations from Tavares and Azevedo [1], as the data presented in this article generally shows no or anti-cyclic correlation. Yet it is interesting that—though not predominant—they also describe in their work an inverted relationship between seismicity and solar activity. Comparing the two results, in the authors’ opinion these effects seem rather arbitrary and it’s highly questionable if not only the choice of the earthquake catalogue is the crucial factor in finding a positive or negative correlation.
6. CONCLUSIONS
The influence of the solar activity on earthquakes proves to be an elusive phenomenon. Magnetic storms caused by CMEs are supposed not only to affect modern technology such as GPS, but also the solid Earth’s crust, triggering earthquakes. As such events happen considerably more frequently during solar Sunspot Maxima, it is of interest, whether earthquake occurrence resembles these cycles.
This study doubts the results presented by Tavares and Azevedo [1], as the only clear signs of correlation found, predict a negative correlation between earthquakes and solar activity. Yet, future studies could come to more significant conclusions, by, for example, correlating directly CME events with earthquakes. In any case, it is important to take the complexity of an earthquake process into consideration, as there are many factors influencing the behaviour of fault zones and if at all, solar activity represents only one part of the puzzle. Thus, effects are presumably small, so all the more there is need for robust statistical methods. Otherwise, this topic stays in its niche, widely ignored by the scientific community.
7. ACKNOWLEDGEMENTS
We want to thank the Colombian National University and the University of Potsdam, for making this project possible. For providing the data we express our thanks to the Geomagnetic Observatory in Fúquene (Instituto Geográfico Agustín Codazzi—IGAC), Niemegk (GFZ Potsdam) and College (USGS), as well as the NCEDC, the SIDC and the USGS.
REFERENCES
- Tavares, M. and Azevedo, A. (2011) Influences of solar cycles on earthquakes. Natural Science, 3, 436-443. doi:10.4236/ns.2011.36060
- Simpson, J.F. (1968) Solar activity as a triggering mechanism for earthquakes. Earth and Planetary Science Letters, 3, 417-425. doi:10.1016/0012-821X(67)90071-4
- Han, Y. Guo, Z., Wu, J. and Ma, L. (2004) Possible triggering of solar activity to big earthquakes (Ms ≥ 8) in faults with near west-east strike in China. Science in China Series G: Physics, Mechanics and Astronomy, 472, 173-181.
- Gousheva, M.N., Georgieva, K.Y., Kirov, B.B. and Antanasov, D. (2003) On the relation between solar activity and seismicity. IEEE Proceedings of International Conference on Recent Advances in Space Technologies, Istanbul, 11-13 June 2003, 236-240.
- Odintsov, S., Boyarchuk, K., Georgieva, B., Kirov, B. and Antanasov, D. (2006) Long-period trends in global seismic and geomagnetic activity and their relation to solar activity. Physics and Chemistry of the Earth, Parts A/B/C 31.1-3, 88-93.
- Solar Influences Data Center (SIDC) (2012) International sunspot number. http://sidc.oma.be/
- Kunow, H. Crooker, N.U. and Linker, J.A. (2007) Coronal mass ejections. Springer, Berlin.
- NASA (2012) Coronal mass ejections. http://helios.gsfc.nasa.gov/cme.html
- Dandouras, I.S., Rème, H., Cao, J. and Escoubet, P. (2009) Magnetosphere response to the 2005 and 2006 extreme solar events as observed by the Cluster and Double Star spacecraft. Advances in Space Research, 43, 618-623. doi:10.1016/j.asr.2008.10.015
- Northern California Earthquake Data Center (NCEDC) (2012) ANSS worldwide earthquake catalogue. http://www.ncedc.org/anss/
- Engdahl, E.R. and Villasenor, A. (2002) 41 global seismicity: 1900-1999. International Geophysics, 81, 665-690. doi:10.1016/S0074-6142(02)80244-3
- Sørensen, B.E. (2005) Cointegration. http://www.uh.edu/~bsorense/coint.pdf
- Engle, R.F. and Granger, C.W.J. (1987) Cointegration and error correction: Representation, estimation and testing. Econometrica, 55, 251-276. doi:10.2307/1913236
- British Geological Survey (BGS) (2012) The Earth’s magnetic field: An overview. http://www.geomag.bgs.ac.uk/education/earthmag.html