Health
Vol.6 No.5(2014), Article ID:43097,7 pages DOI:10.4236/health.2014.65041
Importance-performance analysis: Revisiting a tool for the evaluation of clinical services
![]()
1Department of Community Oral Health, Piracicaba Dental School, University of Campinas—UNICAMP Piracicaba, Brazil; *Corresponding Author: julianarocha11@uol.com.br, mariliajbatista@yahoo.com.br, apereira@fop.unicam.br, glaucia@fop.unicamp.br
2Department of Oral and Maxillofacial Medicine and Diagnostic Sciences, University Hospitals Case Medical Center and School of Dental Medicine, Case Western Reserve University, Cleveland, USA; andres.pinto@case.edu
Copyright © 2014 Juliana Rocha Gonçalves et al. This is an open access article distributed under the Creative Commons Attribution License, which permits unrestricted use, distribution, and reproduction in any medium, provided the original work is properly cited. In accordance of the Creative Commons Attribution License all Copyrights © 2014 are reserved for SCIRP and the owner of the intellectual property Juliana Rocha Gonçalves et al. All Copyright © 2014 are guarded by law and by SCIRP as a guardian.
Received 21 December 2013; revised 27 January 2014; accepted 4 February 2014
KEYWORDS
Quality of Health Care; Quality Indicators; Health Care; Dental Health Education; Health Services Evaluation
ABSTRACT
The importance-performance analysis method (IPA) is used in market research in order to measure the level of customer satisfaction. The aim of this study was to evaluate and highlight the use of IPA as a management tool to measure quality of dental services. We suggest that this method can be easily implemented in a dental educational setting, as a performance outcome measure that includes patient input. The study was conducted in a dental service through a valid questionnaire, SERVQUAL. This instrument explores levels of service quality perceived by patients. It was conducted in four companies in Brazil in 2011 (derived from different industry segments; two from textiles, one from hospital care and the other from the manufacturing industry) in two States (São Paulo and Minas Gerais). These companies were covered by the same dental managed care organization which contracted with independent dentists to provide care. The study was divided into two stages: the first, in which beneficiaries answered the questionnaire prior to receiving dental treatment, and the second when the same beneficiaries answered after completing their dental treatment. Data obtained from SERVQUAL generated graphs that were used to characterize the IPA matrix using several dimensions of care. The Assurance Dimension had the highest average in both expectation and perception. The Reliability dimension showed the value of the most negative GAP among the dimensions, and the best value occurred in the Responsiveness dimension. The IPA tool may be effective in Dental Medicine since it highlights the key points to be improved in the delivery of dental services in a clinical setting.
1. INTRODUCTION
The evaluation process of the delivery of health services has been a challenge for years. Most assessment methods focus on the outcomes of health programs (number of procedures) and other epidemiological data regardless of user perspective. Attention to customer’s expectations and experience with the service provides useful data for evaluation that should not be ignored.
The concept of the IPA (Importance-Performance Analysis) method lies in using market surveys to understand the importance of customer’s expectations and satisfaction level. The actual perceived satisfaction level establishes a two-dimensional matrix of the level of importance and the level of performance. Quality characteristics are separated into four categories according to their level of importance and level of performance so that businesses can develop marketing strategies according to these categories (concentrate here, Keep up with good work; Low priority and Overkill) of quality characteristics.
Importance-performance analysis (IPA) has been extensively used in hospitals and tourism research. The IPA was first proposed in 1977 [1] as a tool to develop firm management strategies. Since then, the IPA framework has gained popularity among researchers in service quality [2], and healthcare marketing [3-5]. Thus, the SERVQUAL model is used to assess the quality of care considering client’s expectations and perceptions of service. Consumer satisfaction is modeled as a function of the disparity between the expected and perceived perception [6].
Dental schools often struggle with choosing appropriate measures to retain and increase patient satisfaction and referral for care. The aim of this study was to evaluate the use of IPA as a management tool for dental services, which could be applied to an educational setting.
2. METHODS
This project was approved by The Ethics Committee in Research of the School of Dentistry of Piracicaba— State University of Campinas, registered by number 040/ 2010, complied with the recommendations of the National Health Council—Ministry of Health of Brazil for research in human subjects.
Questionnaire design: The research was performed in a dental insurance service through implementation of a valid and reliable questionnaire (SERVQUAL) [6]. The model is based on marketing theory and relies on the comparison between perceived service and the expected service, in which customer expectations are influenced by special needs, previous experience, word-of-mouth communication, and external communication. The difference between Perception and Expectation values is defined as the service Gap. It is interesting to point out that, the lower Gap, the worse the value of the result obtained, i.e., the assessed quality of the service was unsatisfactory.
2.1. Sample Size
In a dental insurance company with an average of 1200 dental care consultations per month performed by accredited dentists, a prevalence of 50% user satisfaction was estimated. Confidence level was set to 95%, with 5% margin of error, thereby estimating a sample of 308 individuals. Considering a possible loss to follow up between phases 1 and 2 of 25%, 385 charts were selected. Sampling was done by random drawing (using a computer generated algorithm) among the records that were part of the service (limited to 4 companies). Adult patients older than age 18 took part in the study.
The companies were contacted and consent was obtained in consultation with each visited company. Selected employees in each company attended a seminar describing the study and were invited to participate. Three hundred and seventy nine questionnaires were provided (in phase 1) in four companies (with different industry segments; Two from textiles, one from hospital care, and the other from manufacturing industry) in two States (São Paulo and Minas Gerais) of Brazil during the year 2011. One hundred and fifty five questionnaires were returned for phase 2 (satisfaction with provided care).
The selected questionnaire, SERVQUAL, contained 18 items that formed five dimensions of care. The dimensions were:
1) Tangibles: The physical characteristics of the premises (physical facilities, equipment and appearance of personnel).
2) Reliability: Ability to perform the proposed service dependably and accurately, reference to another specialized dentist or physician when necessary.
3) Responsiveness: Reactiveness to help the patient, provision of prompt care and adequate information on oral health and hygiene.
4) Assurance: Freedom from risk (i.e. from possible damage or infection through sterilization, disposable gloves and masks and also use of antiseptics), having a positive effect in security, confidence and consistency.
5) Empathy: Effort to learn about the patient needs, understanding, and showing interest. Staff is caring and provides individualized attention.
All constructs were measured on a seven point Likert scale (graded from one to seven. Responses in phase 1 indicated the level of importance or expectations in each dimension. Responses in phase 2 indicated the level of satisfaction after receiving care). A separate socio-demographic questionnaire included questions such as gender, age, family income, education, and parental education.
The following questions were used in all dimensions: What is your expectation, that is, what do you expect regarding the performance of a dental office or clinic? Answers should follow a scale from 1 - 7. If you strongly agree with the statement, select number 7. Select number1 if you strongly disagree, otherwise select one of the intermediate numbers. The wording was slightly modified for the questions in phase 2 to indicate level of perceived satisfaction with care.
1) Clinic with up-to-date equipment 2) Dentists are always well dressed and appear neat 3) The auxiliary are well dressed, clean and appear neat 4) Appropriate physical facilities for the type of service 5) Staff can be depended upon to do the right thing 6) Patients are informed precisely when services will be performed 7) Sincerity of clinic staff in trying to solve patient problems 8) Reasonable waiting time in relation to the appointment time or time scheduled for a service 9) Prompt service is received from the clinic staff 10) Staff is always willing to help patients 11) Prompt response to patient’s requests and problems 12) Staff is trustworthy 13) Feeling of security in receiving services from the staff 14) Staff is courteous 15) Staff works together in the patients’ best interest 16) Staff knows what your needs are 17) Convenient operating hours for the patient’s needs 18) Staff gives you personal attention The following items correspond to the respective dimensions:
Ÿ 1 through 4 Tangibles
Ÿ 5 through 8 Reliability
Ÿ 9 through 11 Responsiveness
Ÿ 12 through 15 Assurance
Ÿ 16 through 18 Empathy The IPA model scheme is characterized by a fourquadrant graph where each one has a meaning (for future action) (Figures 1(a) and (b)).
The first IPA matrix (Figure 2) was constructed with the data generated by SERVQUAL. (Table 1) A macro function was created in Excel, which allowed expectation and perception means to be plotted in the following quadrants:
1) Concentrate here: Customers feel that the service or quality characteristic of the product is high, but the performance of the organization is low.
2) Keep up with the good work: Customers feel that the service or quality characteristic of the product is high, and the performance of the organization is also high.
3) Low priority: The performance of the organization’s product or service quality characteristic is low, and the importance perceived by the customer is also low.
4) Possible overkill: The performance of the organization’s product or service quality characteristic is high, but the importance perceived by the customer is low.
The schematic (Figure 1(a)) shows the matrix design used to implement IPA with regression results. Note that the quadrants are changed because of different axis. In the first graph, we worked with expectation and perception. In the other (Figure 1(b)), the axis “x” is the value of the difference between expectation and perception (GAP) and the “y” axis is the confidence interval value for each dimension.
2.2. Data Analysis
Data was tabulated in an Excel 2003® (Microsoft Corporation, Seattle, USA) spreadsheet, and analysis per-
 (a)
(a) (b)
(b)
Figure 1. (a) IPA matrix with 4 quadrants (mean values); (b) IPA matrix with a confidence interval.
formed using SPSS® (Statistical Package for Social Sciences) version 17 (SPSS Inc., Chicago, USA). T-test was performed to find differences between expectations (questionnaire applied before dental treatment) and perceptions/satisfaction. All associations with p < 0.20 were included in multivariate logistic regression models analyses with the confidence intervals in dimensions as the independent variable and the Gap value as dependent variable.
3. RESULTS
Both Figures 2 and 3 show the characteristics analyzed. The first focuses on the measures of each questionnaire item both for expectation and perception. The second graph shows the confidence intervals for each dimension of the instrument. The use of confidence intervals allowed for assessment of variability and produced a more precise result, in case narrows confidence interval, which will assist in a planned management decision.
Figure 2 shows the means of expectation and perception of each item of the questionnaire (Table 1) plotted in Excel. Item “4” was graphed into the quadrant “concentrate here”. This item involves a Tangibility dimension, and responds to the question on the physical appearance of the clinical facility.
Table 2 shows the GAPs values, which is the difference between the Perception and Expectation means for each dimension and their respective confidence intervals. The major difference or the most negative result was in
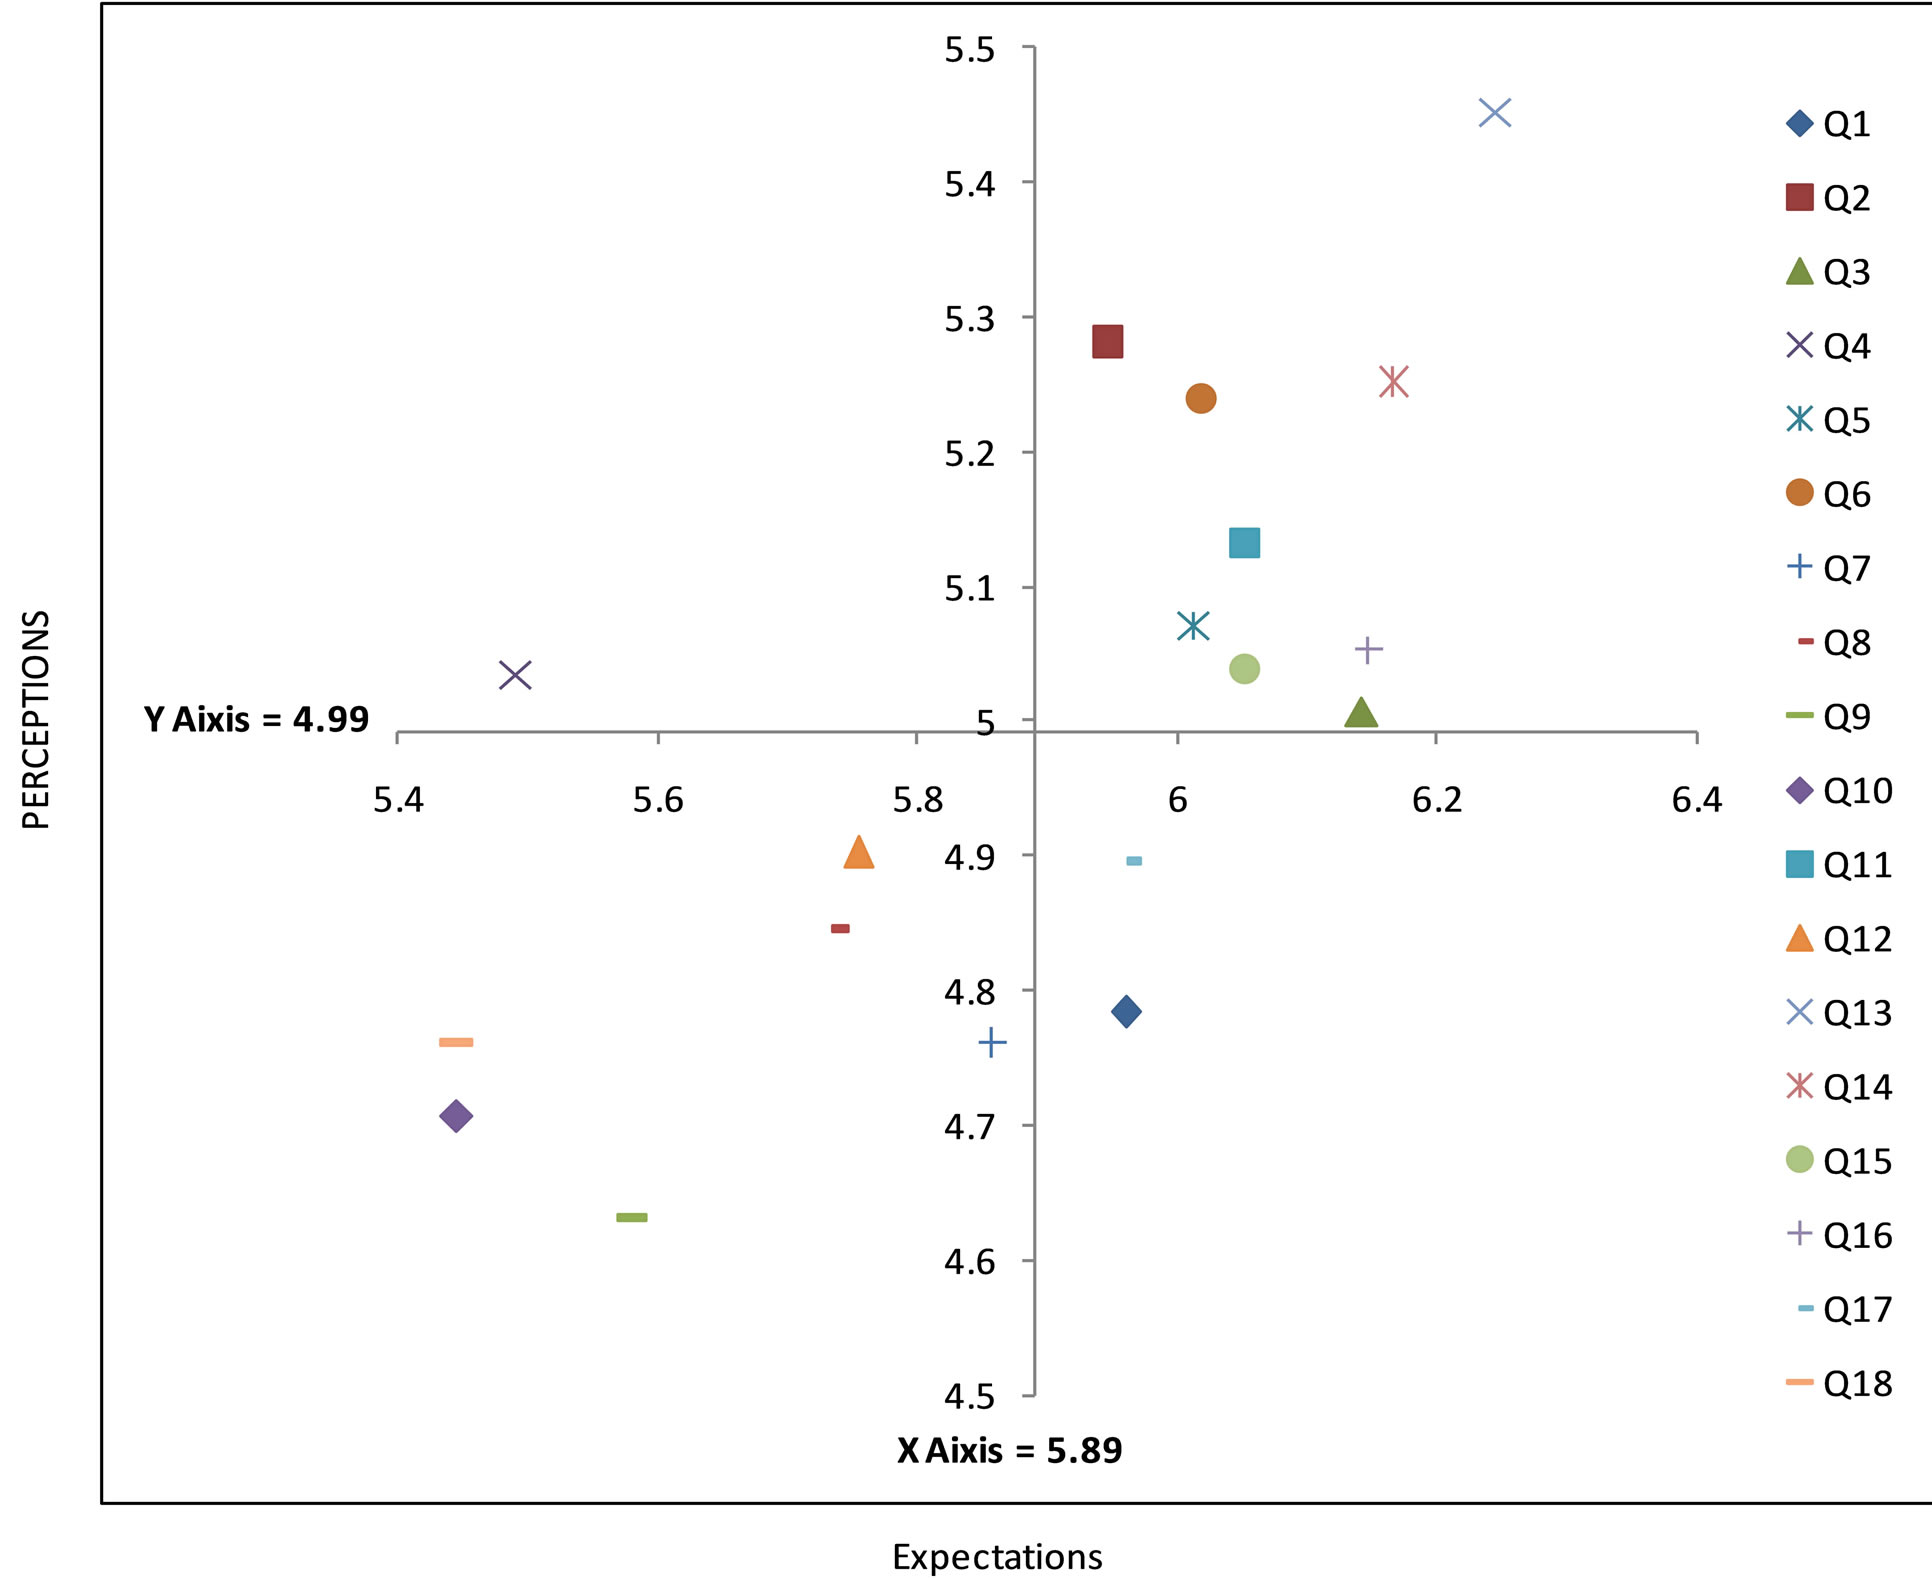
Figure 2. IPA matrix with the means of Expectations and Perceptions.
Reliability (−0.235).
We had significant results in all dimensions in according Table 1. The biggest difference between Expectations and Perceptions was in Reliability dimension (3.71).
In the plot of the IPA using confidence intervals it can be observed in Figure 3 that three dimensions are in the quadrant “concentrate here”, Tangibility, Assurance and Empathy and that the last two presented narrower confidence intervals.
4. DISCUSSION
The results of this study propose that IPA may be an important tool to identify the strengths and weaknesses of a clinical service offered and it can be useful for the evaluation of health services. To our knowledge, this instrument has never been implemented in a dental education setting. This method, which evaluates strengths (keep up with the good work) and weaknesses (concentrate here), shows that service satisfaction of a service from the users’ perspective is an excellent strategy for program development [7,8]. The matrix with four quadrants helps establish and define action plans to minimize the differences between expectations and perceptions. This study found that the greatest concentration needs were in the Tangibility, Assurance and Empathy dimensions.
The traditional importance-performance analysis (IPA) uses the mean ratings of importance and performance to construct a two-dimensional grid, identifying improvement opportunities to guide strategic planning efforts [1, 9]. Point estimates of importance and performance vary from sample to sample in such a way that the numerical means do not adequately reflect the variability of different samples. Thus, using point estimates for items may lead a management team to mistaken decisions [10].
It is important to comment that the narrower representation of confidence interval means that this data is more
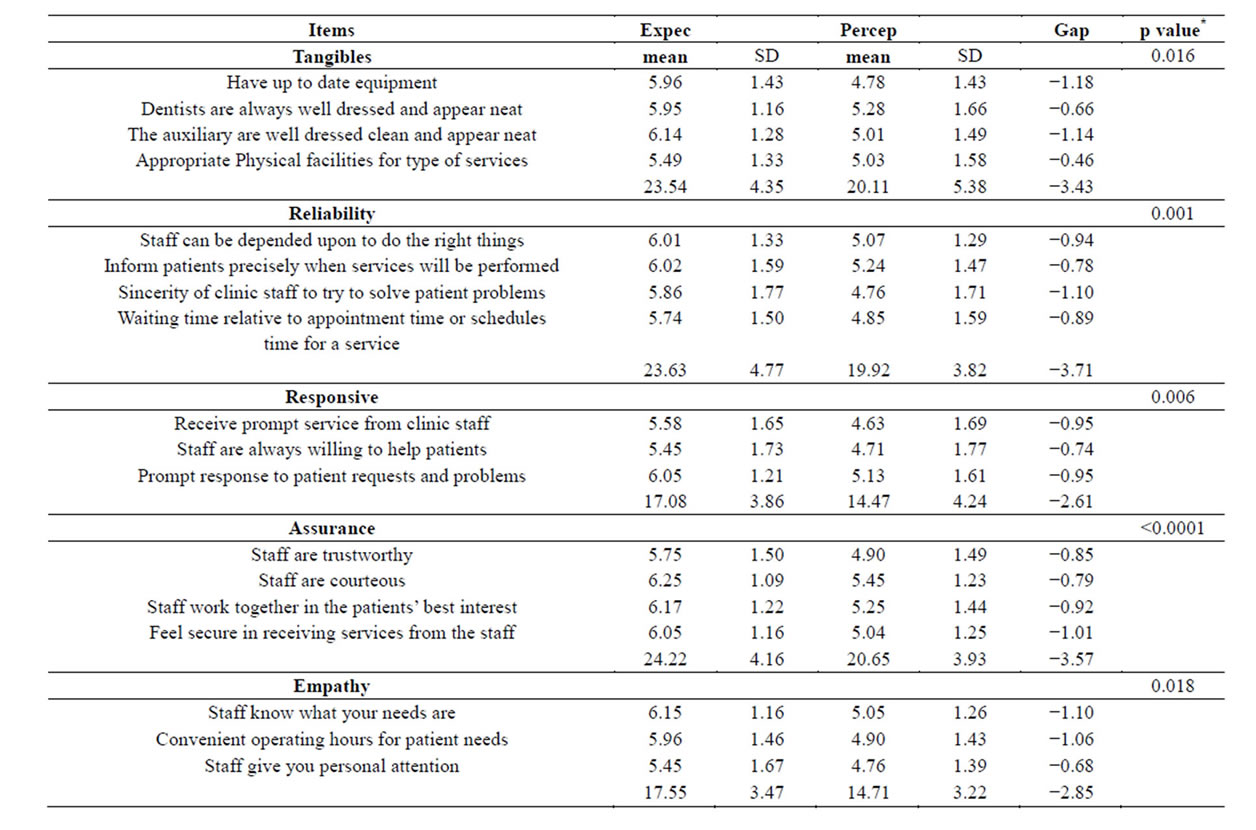
Table 1. Means of Perceptions and Expectations of SERVQUAL.
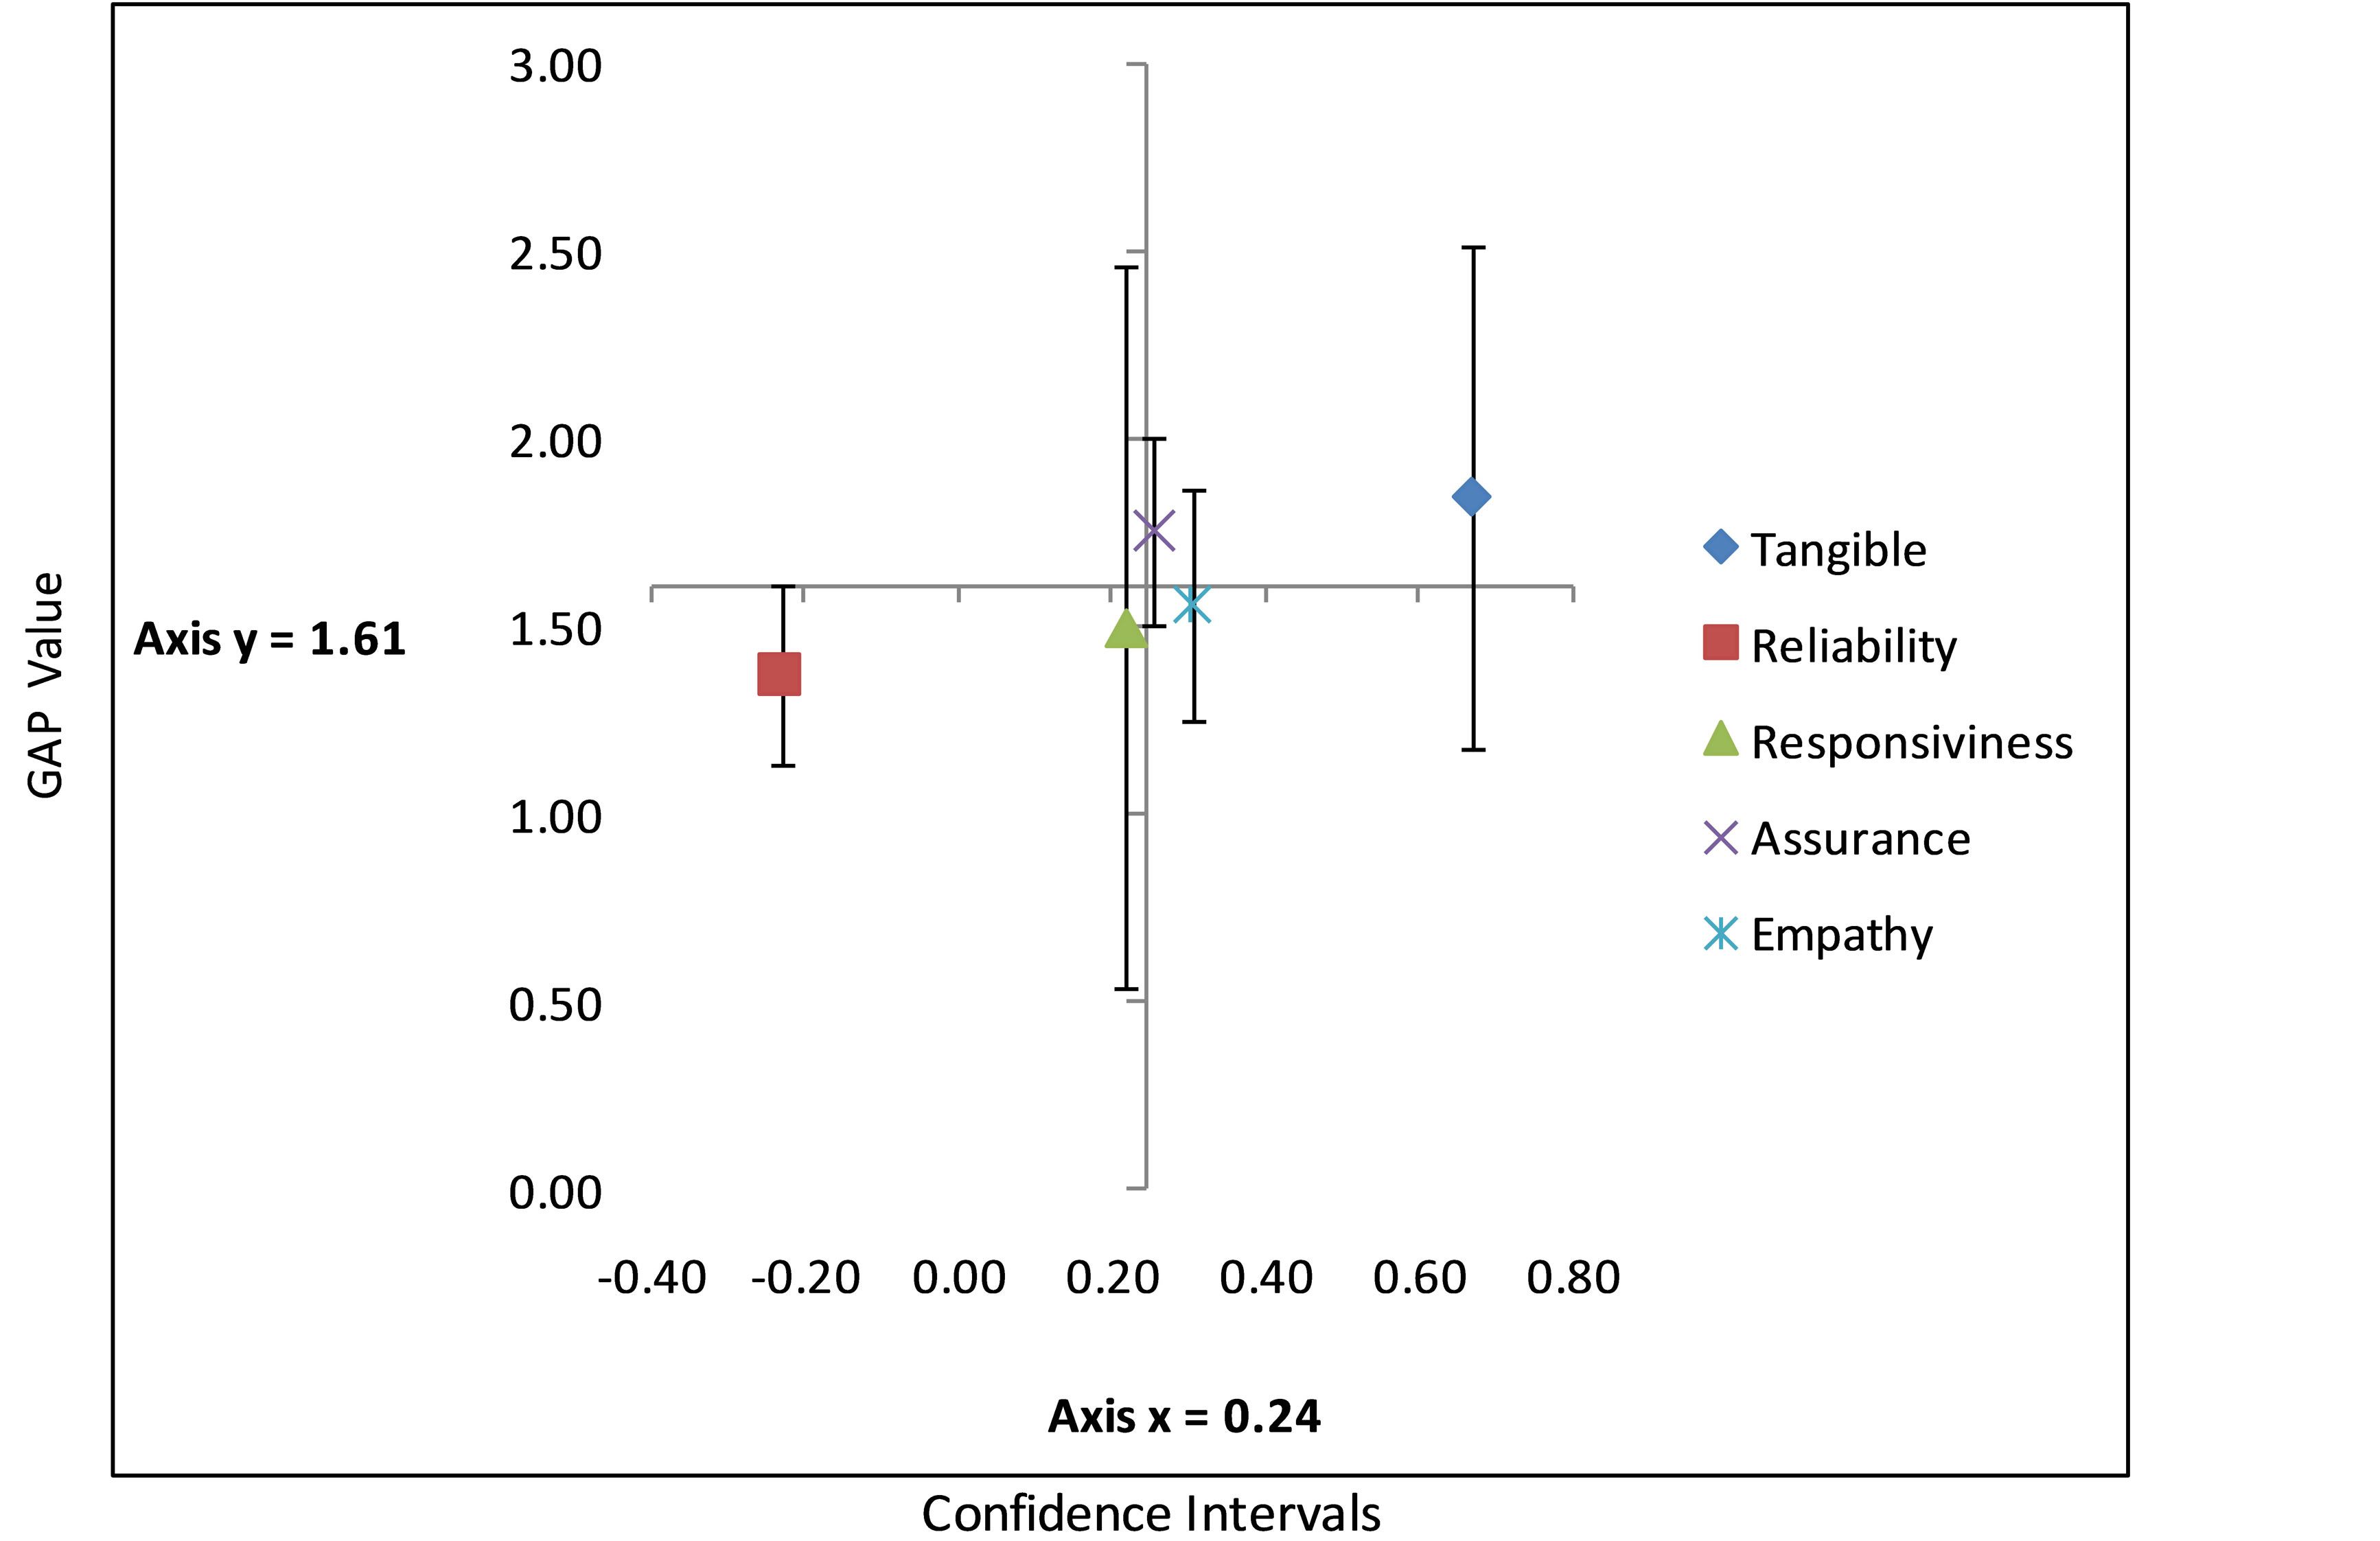
Figure 3. IPA matrix with GAP outcomes and interval confidence per dimension.
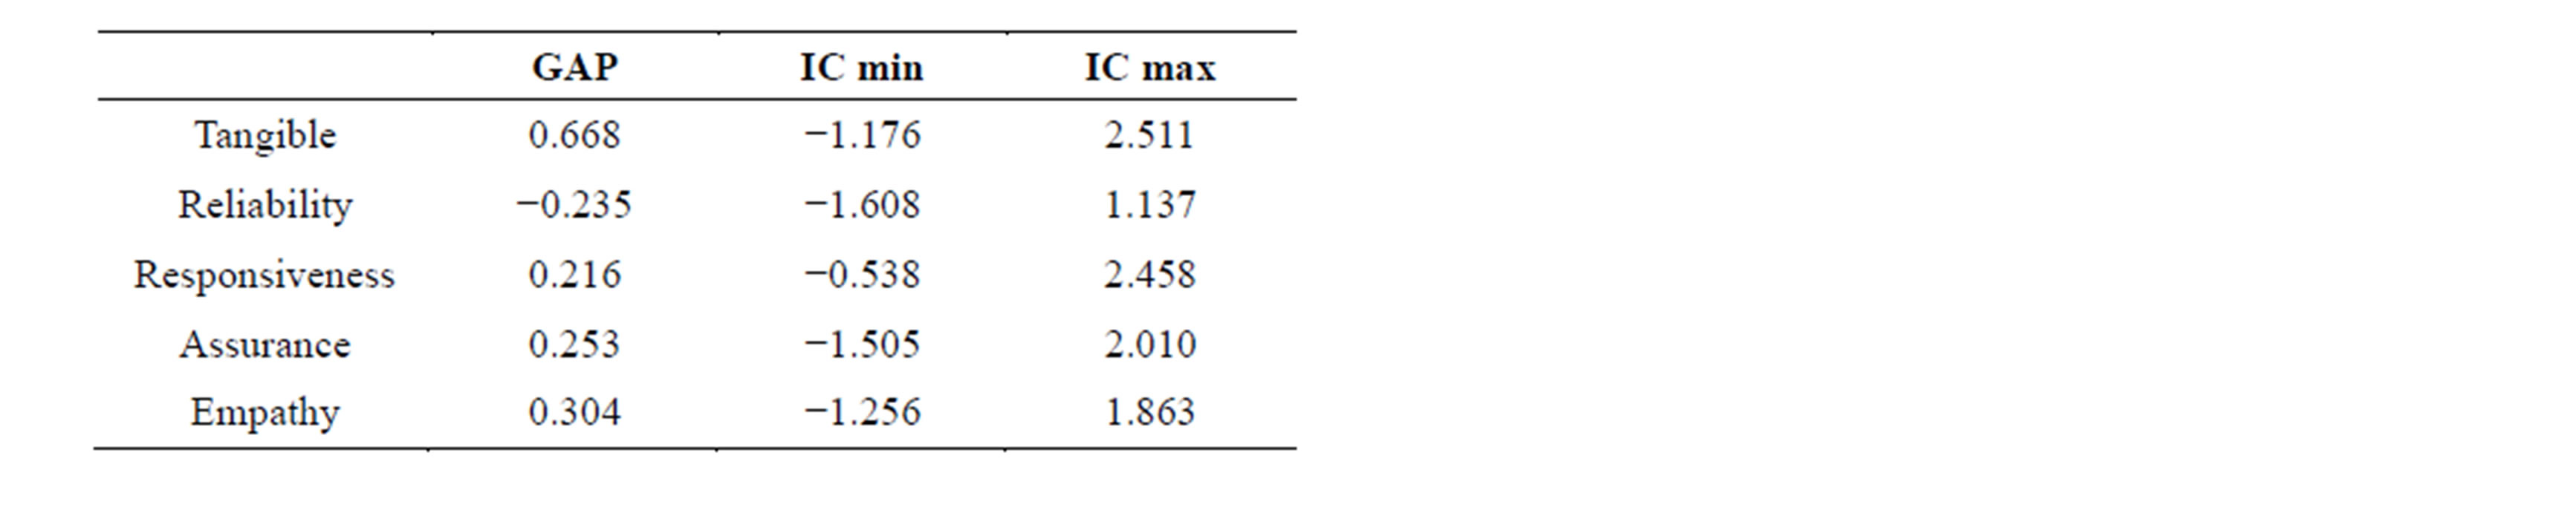
Table 2. Gap value and Confidence Intervals in Dimensions.
reliable. When IPA was used with confidence intervals, the Empathy dimension appeared in addition to the Tangibility in the “concentrate here” quadrant, which demonstrates the importance of individualized attention and interest in the patient’s needs. In a study [11] conducted in 1989, the most important items were related to quality care, personal recommendations, cost, and clinic appearance. Similar results were reported in two other studies [12,13]. A study reported in 2011, a total of 90 questionnaires were completed by the dental patients who came to a Hospital based dental clinic in West Java, Indonesia. The questionnaire highlighted only two dimensions of service quality model as important to patients, i.e. empathy and responsiveness. In our study we worked with five dimensions. The authors also concluded that it can be inferred from IPA that priority should be given to dentist’s communication and dental assistant’s knowledge toward patient’s needs to enhance service quality [13].
The Tangible and Assurance dimensions were represented as needing the most attention in this study (albeit with wide variability), reflect the initial patient-professional contact, and influence the development of other items [3]. Although these two dimensions presented the highest score in the study, the other items were also highly prioritized, indicative of high expectations from several levels of provision of oral health services [14]. After using confidence intervals in IPA, one dimension stood out in the “concentrate here” item, which was the Assurance dimension with the lowest confidence interval in the quadrant. Regarding Assurance, it is important to remember that its meaning is Freedom of risk (i.e., possible damage or infection sterilization, use of disposable gloves and masks and also use of antiseptics), which demonstrates a positive effect in all aspects in this research which shows a highlights important procedures in infection control patients.
Less than a handful of studies in dentistry have implemented the IPA tool. The current study used confidence interval-based plotting to prioritize a management decision. This research integrated the IPA tool, Gap values, and confidence intervals to allow the dental service managers to easily identify the strengths and weaknesses based on the sample size utilized [15]. We recognize study limitations such as limited external validity and decreased power based on a decreased return of questionnaires in phase 2. We were unable to control completely for selection bias given the specific number of companies surveyed and the use of one managed care organization. However, we think this study provides valuable insight into the utility of the IPA method when evaluating quality of health care and suggests potential application to dental settings that face important challenges like patient retention and recall, and selection of appropriate “teaching” cases for undergraduate and graduate students.
5. CONCLUSION
The IPA tool with means and confidence intervals was effective when used in the management of the service since it emphasizes the key points to be improved or maintained in the service. This kind of assessment from the user’s point of view is innovative and can add improvements to the evaluation of dental care services in a dental educational setting.
ACKNOWLEDGEMENTS
This work was supported by CAPES (Coordination for the Improvement of Higher Level -or Education-Personnel) [5632-11-0]; and CNPq (National Council for Scientific and Technological Development) [470687/2010-0], Brazil.
REFERENCES
- Martilla, J. and James, J. (1977) Importance-performance analysis. Journal of Marketing, 41, 77-79. http://dx.doi.org/10.2307/1250495
- Ennew, C.T., Reed, G.V. and Binks, M.R. (1993) Importance-performance analysis and the measurement of service quality. European Journal of Marketing, 27, 59-70. http://dx.doi.org/10.1108/03090569310026402
- Dolinsky, A. (1991) Considering the competition in strategy development: An extension of importance-performance analysis. Journal of Health Care Marketing, 11, 31-36.
- Dolinsky, A.L. and Caputo, R.K. (1991) Adding a competitive dimension to importance-performance analysis: An application to traditional health care systems. Health Marketing Quarterly, 8, 61-79. http://dx.doi.org/10.1300/J026v08n03_03
- Hawes, J.M. and Rao, C.P. (1995) Using importanceperformance analysis to develop health care marketing strategies. Journal of Health Care Marketing, 5, 19-25.
- Parasuraman, A., Zeithaml, V. and Berry, L. (1998) SERVQUAL: A multiple-item scale for measuring consumer perceptions of service quality. Journal of Retailing, 64, 12-40.
- Hu, H.Y., Chiu, S.I., Cheng, C.C. and Yen, T.M. (2011) Applying the IPA and DEMATEL models to improve the order-winner criteria: A case study of Taiwan’s network communication equipment manufacturing industry. Expert Systems with Applications, 38, 9674-9683. http://dx.doi.org/10.1016/j.eswa.2011.01.147
- Lee, Y.C., Yen, T.M. and Tsai, C.H. (2008) Using importance-performance analysis and decision making trial and evaluation laboratory to enhance order-winner criteria. A study of computer industry. Information Technology Journal, 7, 396-408.
- Keyt, J.C., Yavas, U. and Riecken, G. (1994) Importanceperformance analysis. International Journal of Retail & Distribution Management, 22, 35-40. http://dx.doi.org/10.1108/09590559410067325
- Manski, R.J. (1989) Decision process of the dental consumer. Journal of Dental Practice Administration, 6, 35-38.
- Cunningham, M.A. and Gaeth, G.J. (1989) Using Importance-Performance Analysis to Assess Patients’ Decisions to Seek Care in a Dental School Clinic. Journal of Dental Education, 53, 584-586.
- Ayres, C. and Abrams, R.A. (1989) Attitudes of consumers toward dentistry and dentists. Journal of Dental Practice Administration, 6, 22-28.
- Dewi, F.D., Sudjana, G. and Oesman, Y.M. (2011) Patient satisfaction analysis on service quality of dental health care based on empathy and responsiveness. Journal of Dental Research, 8, 172-177. http://dx.doi.org/10.4103/1735-3327.86032
- Matzler, K. and Sauerwein, E. (2002) The factor structure of customer satisfaction: An empirical test of the importance grid and the penalty-reward-contrast analysis. International Journal of Service Industry Management, 13, 314-332. http://dx.doi.org/10.1108/09564230210445078
- Ho, F. and Lee, Y. (2012) Using modified IPA to evaluate supplier’s performance: Multiple regression analysis and DEMATEL approach. Expert Systems, 2, 7102-7109.