Health
Vol.5 No.7A4(2013), Article ID:34199,12 pages DOI:10.4236/health.2013.57A4001
Health related quality of life of university students in Lebanon: Lifestyles behaviors and socio-demographic predictors
![]()
1Faculty of Public Health, Lebanese University, Saida, Lebanon; *Corresponding Author: nsdroubi@inco.com.lb
2Faculty of Economic Sciences and Business Administration, Lebanese University, Nabatieh, Lebanon
3Doctoral School of Literature, Humanities & Social Sciences-Lebanese University, Beyrouth, Lebanon
4Institute of Social Science, Lebanese University, Saida, Lebanon
Copyright © 2013 Ibtissam Sabbah et al. This is an open access article distributed under the Creative Commons Attribution License, which permits unrestricted use, distribution, and reproduction in any medium, provided the original work is properly cited.
Received 15 May 2013; revised 16 June 2013; accepted 1 July 2013
Keywords: Health Related Quality of Life; Lifestyle Behaviors; SF-36; Health Promotion; Young University Students
ABSTRACT
Measuring and monitoring health related quality of life (HRQoL) in youth are important for both researchers and decision makers. During the time that young people are at university, many will encounter a number of academic, as well as social, emotional and psychological difficulties. The aims of this study are to: 1) assess the health related quality of life of youths using SF-36 questionnaire and its factor determinants, and 2) provide an objective basis for a health promotion structure. Methods: This is a crosssectional study in South Lebanon, in a population of 282 young university students attending a public university which is the largest and most widespread institution of higher education in Lebanon. Socioeconomic and lifestyle behaviors data were collected. Students’ HRQoL was measured using the SF-36 Health Survey. Results: The mean age of the respondents was 18.7 years (SD = 1.16), 80.1% were women, 64.5% were living in rural area. The proportion of current smokers was significantly greater among men than women (26.8% vs. 11.5%, p < 0.01). Water pipe was the main type of smoking. Education of the fathers had negatively influenced HRQoL. Younger age scored higher in Social Functioning and Role-Emotional; the area of residence had no influences on SF-36 scales scores. Females had poorer HRQoL than males especially in mental health scales. Smokers had low Vitality and Mental Health scores. Sedentary lifestyle was linked to a lower score of Physical Functioning (( = −5.16, 95% CI = −7.67 - −2.65), and Vitality (( = −5.85, 95% CI = −10.24 - −1.45). The HRQoL of the students studying business and economics was higher than those studying health. Conclusion: Youths’ HRQoL is affected by socio-demographic and behavioral characteristics. Effective health-promoting actions, social support, and counseling services should be implemented in the campus and are a necessary step towards the main goal of improving the overall HRQoL of the university young students in Lebanon.
1. INTRODUCTION
Measuring and monitoring health related quality of life (HRQoL) in youth continue to increase in importance for both researchers and decision makers [1-13]. World Health Organization (WHO) defines quality of life (QoL) as “an individual’s perceptions of their position in life in the context of the culture and value systems in which they live, and in relation to their goals, expectations, and concerns”. This definition of QoL highlights the factors that impact subjective evaluations of life circumstances and may explain the apparent discrepancies sometimes found between an objective evaluation of a person’s life circumstances and his/her own self-evaluation [6,14]. A related concept of healthrelated quality of life is well-being, which involves satisfactory, stable and happy life [1,15,16].
HRQoL is a multidimensional concept which reflects patients’ health both physically and mentally. Health is defined as “a state of complete physical, mental and social wellbeing and not merely the absence of disease and infirmity is an important factor for academic achievement at school, and in higher education [11,17, 18]. In the context of universities, promoting health and well-being means promoting effective learning [17] and human development [19]. Vice versa, education is a strong predictor of lifelong health and quality of life in different populations, settings, and time [17]. Indeed, “efforts to improve school performance that ignore health are ill-conceived, as are health improvement efforts that ignore education” [20].
The majority of students entering university are aged between 18 and 21, a transition age to adulthood characterized by dramatic changes in life. On one hand, the university experience provides the young person with the opportunity to enhance knowledge and perspective, to develop and establish aspects of personal identity and to achieve personal growth. On the other, during that time many will encounter a number of academic as well as social, emotional and psychological difficulties [18,21], financial limitations [11], and a myriad of challenges and stressors [11,22,23]. Young people also seem not to be aware of the effects of unhealthy behaviors [3,24], so they are less likely to engage in health promoting activities [25]. Youth are usually at the stage of life when the future is ahead, and the essential goals are set [16]. Good physical, social, emotional, and psychological health help protect young people against behavioral problems, violence and crime, misuse of drugs and alcohol [26], teenage pregnancy [26], risky sexual behavior [27], suicidal behavior [28], and low academic performance [18,29]. Several factors can negatively predict the Health related quality of life of youth such as gender, socio-economic and demographic status [3,4,11,30-33], parental socio-economic status [2, 16,30,32], overweight and obesity [25,34], alcohol consumption [14], physical activity [25,35-38], and war [36, 39,40].
The youth aged between 15 and 29 years represents 28% of the total population in Lebanon [41]. As in certain European countries [11,17], and Canada [22], the available information of HRQoL of this age group remains limited [5,31,42-47]. Assessment of HRQoL should be based on patients’ self-report and should cover the relevant domains of daily functioning (physical, mental, social). The SF-36 measures generic health concepts relevant across age, disease, and treatment groups. It provides a comprehensive, psychometrically sound, and efficient way to measure health from the patient’s point of view by scoring standardized responses to standard questions. The current study aims to: 1) assess the health related quality of life of youths using SF-36 questionnaire and its factor determinants especially gender and residence areas (urban/rural), and 2) establish an evidence-based decision-making for the implementation of a health promotion structure in university setting in Lebanon.
2. METHODS
2.1. Data Collection
From October 2011 to March 2013, a cross-sectional survey was conducted amongst a population of youth university students attending faculties of Economics and Management, and Public Health (Nursing, Midwifery, Physiotherapy, Medico-social Work, Radiology, and Laboratory Sciences), at a public university in South Lebanon. This public university is the largest and most widespread institution of higher education in Lebanon. Classes were chosen randomly. The students were approached after class and asked to participate in the study. Students were informed about the purpose of the study and were assured that their participation would be voluntary, and that if at any point they decided not to complete the questionnaire, they could withdraw from the study. The participants were also informed that the information collected would be anonymous, and that no individual participant could be identified from their data. The students were given a consent form stating the purpose of the study (presented at the beginning of the questionnaire). The sample size would allow us to detect a 5 point difference in SF-36 scores between groups with a fixed norm (a general population), assuming two-sided significance of 5%, with 80% power [48]. This led us to predict that 300 students would be necessary for the survey. Data collection was carried out privately after assuring respondents about confidentiality of the information collected by self-administration. 3 types of Information were collected.
2.1.1. Socio-Economic Status
In order to assess familial socioeconomic status, information about age, marital status as well as mothers and father’s education, profession, social security, number of inhabitants per house, and car ownership was collected. The declared health illness in the family and for students was also collected.
Students’ socio-demographic information was collected such as gender, age, area (urban/rural) and place of residence, marital status, specialization, current occupation, and social security coverage. Self-rated one-item measure of financial status with ratings ranging from 1 (very poor) to 5 (very good) is also collected.
2.1.2. Lifestyle Behaviors’ and Declared Health Illness
Tobacco and alcohol use, physical activities (where the subjects currently exercise over 30 min per session, at least 2 times per week for duration), diet (yes/no) and body weight and height were self-reported by the students. Body mass index (BMI), a universally used and recognized measure in medicine to categorize people’s weight into obese (³30 kg/m2), overweight (25 - 30 kg/m2), normal weight (18.5 - 25 kg/m2), and underweight (<18.5 kg/m2) was used to calculate the participants’ BMI by dividing the individual’s body weight in kilograms by the square of their height. The declared health illness in the family and for students was also collected.
2.1.3. HRQoL
Students’ HRQoL was measured using the SF-36 health survey [48], before the respondent was asked about other health questions and concurrent illnesses, so that any discussion of health problems does not influence the respondent’s answers to the questionnaire. An Arabic copy of SF-36, version 1 which was translated and adapted in Lebanon was used in our study [31]. The SF-36 is a general questionnaire, widely used in various conditions and populations, and was designed to measure health status from the patient’s point of view. The SF-36 consists of 36 questions that are clustered to yield 8 health status scales commonly represented in health surveys: Physical Functioning (PF), Role-Physical (RP), Bodily Pain (BP), General Health (GH), Vitality (VT), Social Functioning (SF), Role-Emotional (RE), Mental Health (MH), and Reported Health Transition (HT). Two summary measures aggregate these status scales, namely the Physical and Mental health summary scales. The SF-36 is suitable for self-administration, computerized administration, or administration by a trained interviewer in person or by telephone, to persons age 14 and older. The health concepts described by the SF-36 range in score from 0 to 100, with higher scores indicating higher levels of function and/or better health status. The subjects’ responses are presented as a profile of scores calculated for each scale. For all domains, each raw scale score is transformed to a 0 to 100 scale using the formula shown below [48]. Transformed scale = {(Actual Raw Score – Lowest Possible Raw Score)/Possible Raw Score Range} × 100. This transformation converts the lowest and highest possible scores to zero and 100, respectively. Scores between these values represent the percentage of the total possible score.
Self-rated one-item measure of quality of life, with ratings ranging from 1, very poor, to 5, very good was also collected [31].
2.2. Statistical Analysis
Analyses were carried out through frequencies, mean and standard deviation (SD). Individual SF-36 items were recorded, summed and transformed, with missing values imputed as recommended [48]. Subjects with missing scale scores were excluded listwise from the analysis. The mean and standard deviation (SD), percentiles for responses to each scale of the SF-36 were calculated. The percentage of people with scores at the ceiling (percentage of subjects with a score of 100) and floor (lowest level) were calculated for each scale.
The Chi-square statistics (χ2) and t-test statistics independent sample were used for categorical and continuous variables respectively to analyze the significance of differences. One-way analysis of variance (ANOVA) was performed for demographic dimensions with more than two categories. As the HRQoL may differ between males and females, and according to area of residence (urban/rural) we do stratify the analyses for gender and residency.
A multivariate analysis was performed to analyze the combined effect of predictors (independent variables), on SF-36 dimensions (dependent variables). The adjustments were performed by generalized linear model. The confusion variables taken into account were the following: age (included in the model as a continuous variable), gender areas of residence, marital status, financial status perception, global quality of life perception, health illness, mother’s and father’s education, and mother’s and father’s job.
The SPSS 16 package was used in the analysis of the data. All tests of significance were two-tailed. p < 0.05 was taken as the critical level of significance.
3. RESULTS
A sample of 300 young university students was recruited. A total of 282 self-reported questionnaires were returned (that is, approximately 94% response rate).
3.1. Household’s Characteristics
The mean age of mothers and fathers was respectively 50.7 (SD = 5.6) years, and 45.7 (SD = 5.0) years. 5% of the parents were widowed or divorced. The mean number of inhabitants per house was 5.77 (SD = 1.5; median 6; minimum = 2, maximum = 11). 18.4% of fathers have university education and higher, 19.1% were educated to primary level or lower and only 1.4% were illiterate. The proportion of mothers with university and higher education was 14.2% and there was a significant difference between rural and urban environment: 26.1% in rural vs. 15.5% in urban areas have primary level and lower, and 10.1% in rural vs. 16.4% in urban areas have university level of education and higher (p < 0.05). Regarding employment status, 13.1% of the mothers were employed; 52% of fathers were independent workers, with non difference between urban and rural areas in this regard. Concerning car possession, 7.1% of families didn’t have a car, 45.7% had one car and 47.2% had 2 cars and more. 45.0% of the families were not registered with the social security, with no statistically difference between urban and rural area. 38.8% of the families reported having experienced a disease during the last 12 months in the family.
3.2. Socio-Demographic Characteristics, Lifestyle Behaviors, and Self-Reported Illnesses
Table 1 summarizes the socio-demographic characteristics and lifestyle of the people interviewed, stratified by gender, and urban and rural settings. A majority (80.1%) of the respondents were women, living in rural area (64.5%). 41.5% live in Nabatieh, 46.8% in South Lebanon, and 11.7% in Mount Lebanon Department. 18.8% have moved after their birth from urban (41.5%), rural (37.7%) or abroad (20.8%). The students’ age span was from 16 to 24 years and the mean, and median age of the respondents was 18.7 (SD = 1.16), and 18 years respectively. Most of the respondents were single (92.2%). Concerning the marital status we observed more married and fiancée in rural area (10.4% vs. 3.0%; p ≤ 0.05), and in female (9.7% vs. 0.0%; p ≤ 0.05); 77.3% studied in public health faculty. 98.9% of students were affiliated to social security (all had non Lebanese nationality). Regarding employment status, 20 (7.1%) of the students indicated that they were employed. The males reported worse financial status than the females where 8.9% vs. 2.2%; p ≤ 0.05 declared their financial status was very poor and poor. The largest proportion assessed their quality of life as good and very good (59.9%) or fair (37.6 %), with much smaller percentages for poor or very poor (2.5%), but the students living in urban areas reported bad quality of life (6.0% vs. 0.5%; p ≤ 0.05). The proportion of current smokers was significantly greater among men than women (26.8% vs. 11.5%; p ≤ 0.01). The water pipe was the main type of smoking (60.0% of men vs. 96.2% of women; p ≤ 0.01). Alcohol consumption was declared by 2.5% of respondents without statistically significant difference between men and women, and according to area of residence. A higher rate of physical activity was reported by male students (87.5% vs. 49.6%; p ≤ 0.001). Indeed, 58.4% of the samples do the regular walking or jogging or running, and 41.6% of students declared doing physical activities including playing football or any other games, weight lifting, swimming, karate, horse riding, aerobics, and dancing. Higher rate of women declared that they are on diet (11.9% vs. 1.8%; p ≤ 0.05). Self-reported diseases and symptoms, employing a recall period of 12 months, were numerous, declared by 39.4% of young students. 11.2% were underweight, and 1.4% were obese.
3.3. HRQoL
The amount of missing data for the SF-36 questionnaire was very low, at only 0.1% all answered. The missing data were spread evenly over the different scales with a minimum of 0 and maximum 0.4%. The mean scores for scales measuring health related disability (PF, RP, and BP except RE) were higher than scores for scales measuring well being (GH, VT, SF, and MH) (Table 2).
A group of variables consisted of age and gender of the student, financial status and quality of life perception is significantly associated with student’s physical and mental scales scores of the SF-36. Male students reported better scores for their HRQoL than female students. The SF and VT dimension of the SF-36 is negatively associated with age. Except the PF, the SF-36 scales scores are also negatively associated with the majoring of the students (Table 3).
After adjustment for the other socio-demographic variables (Table 4), it was found that the area of residence (urban vs. rural) has no influences on SF-36 scales scores. The females had poorer RP, GH perception, VT and 3 mental health scales scores than males (SF, RE, and MH). Concerning self-reported morbidity, there were statistically significant differences between healthy and ill students. Young students who had a health problem had poorer scores on all eight dimensions of the SF-36 Scales. In addition, the presence of disease for another person in the family mostly the fathers and mothers influence the GH and SF scores of the young university students. The scores of the PF increase with age (b = −1.7 , 95% CI = 0.5 - 2.8), but younger students report SF, and RE scores higher by 3.11, and 4.72 times respectively in average compared to older students (p ≤ 0.05). The level of education of fathers influences the VT scale scores for students (p ≤ 0.01). The global assessment of quality of life of students was statistically significantly related to all scales scores of the SF-36 except BP scores. The number of children in the families was positively associated with physical domain scores. The smokers had lower VT, and MH scores than non smokers. Indeed, the specialization influences most of the SF-36 scales scores where the students of Business and Economics reported higher scores of BP, GH, VT, and SF than their colleagues studied Health. The Fathers’ job had a minor influence on their quality of life. The physiccal activity was linked to a higher score of PF (b = −5.16, 95% CI= −7.67 - −2.65) and VT (b = −5.85, 95% CI= −10.24 - −1.45).
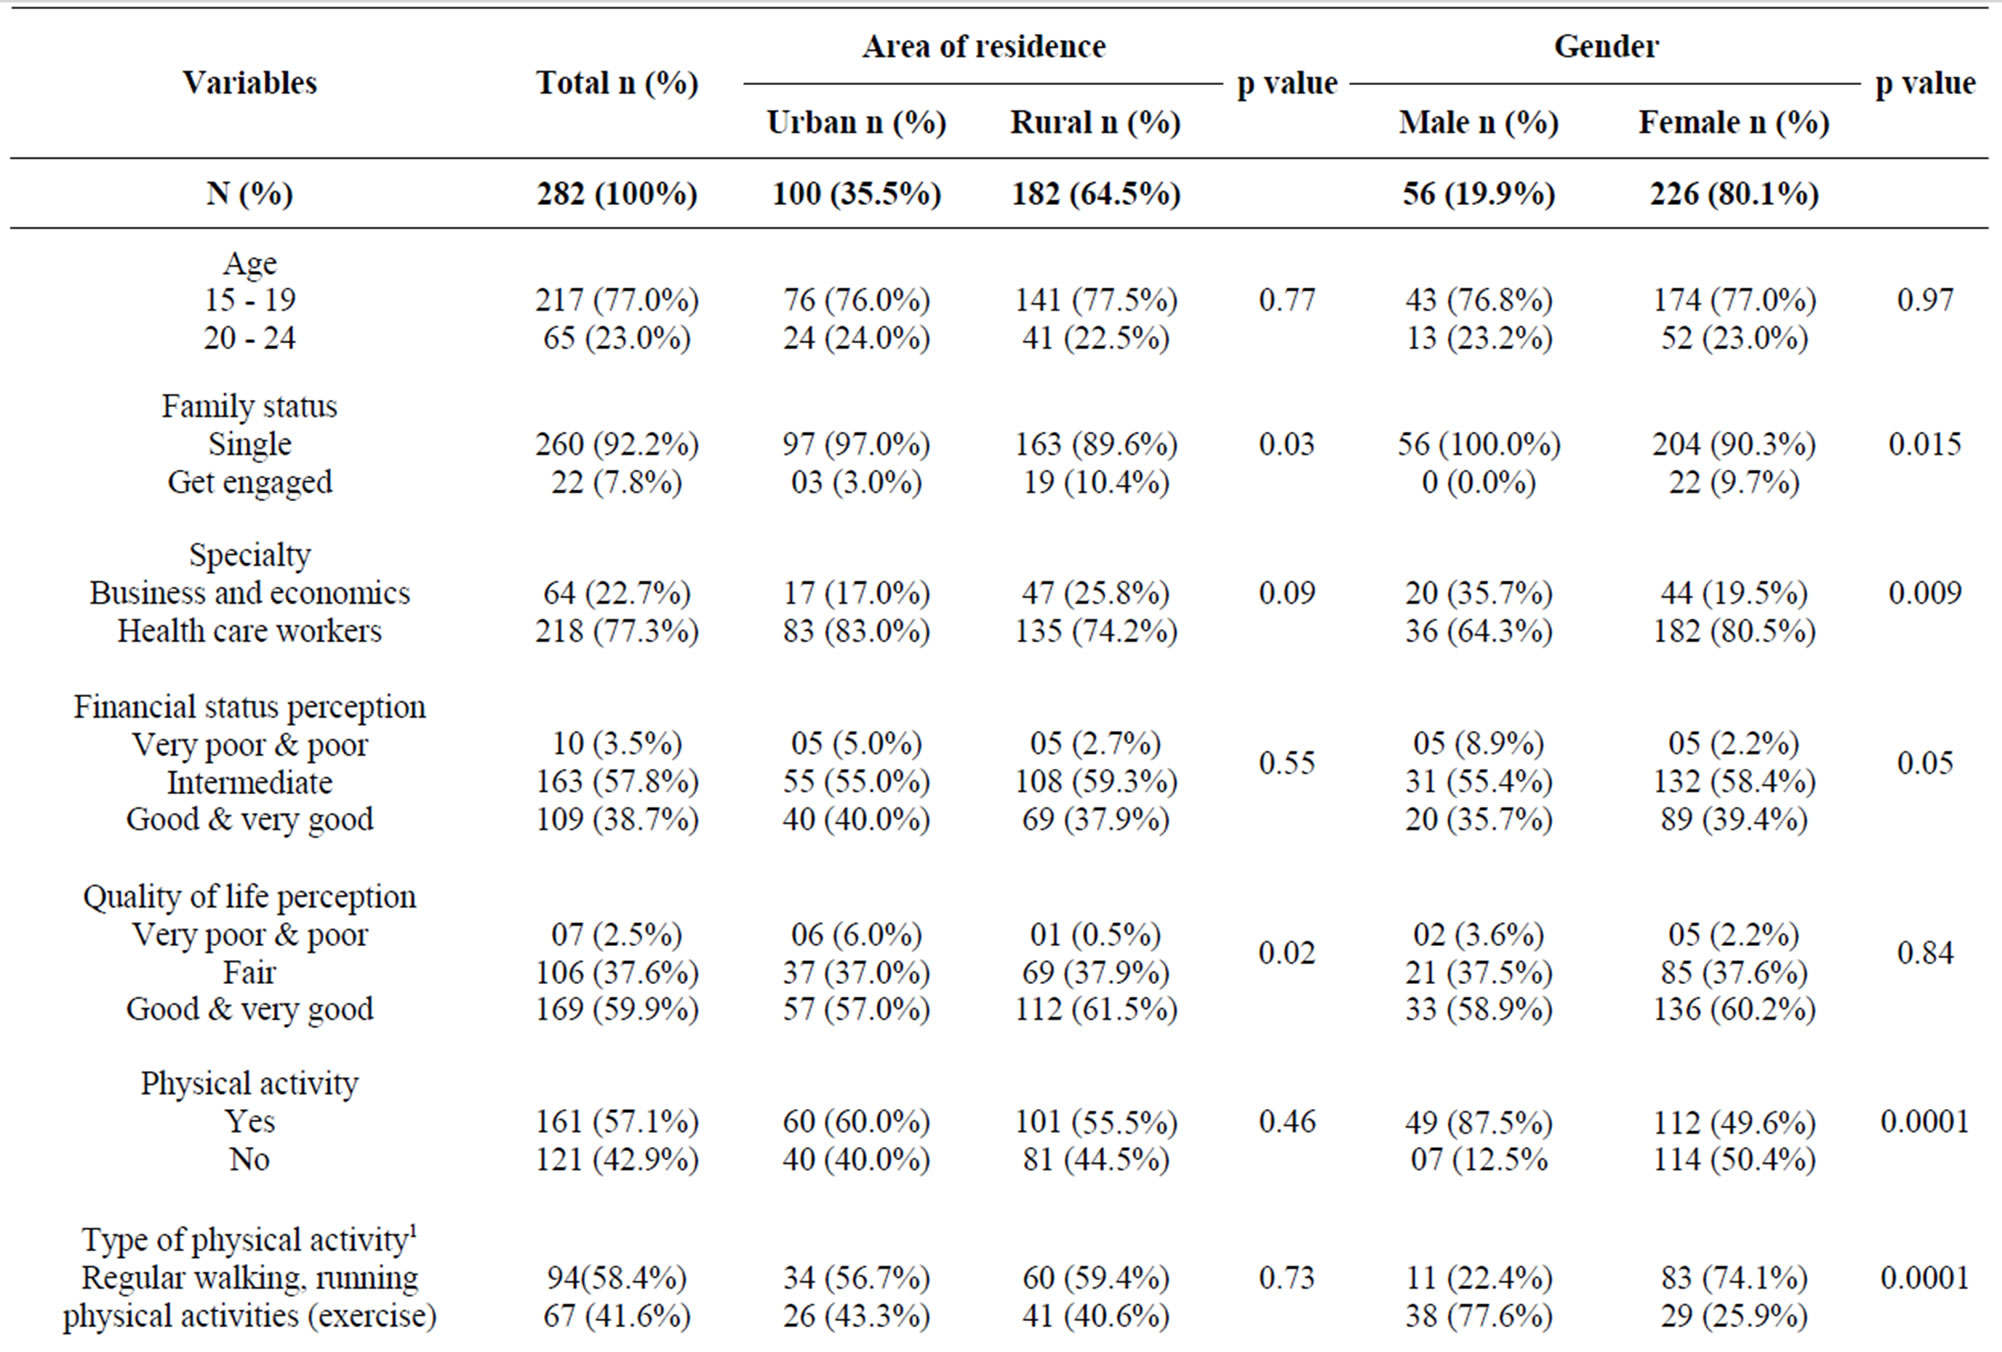
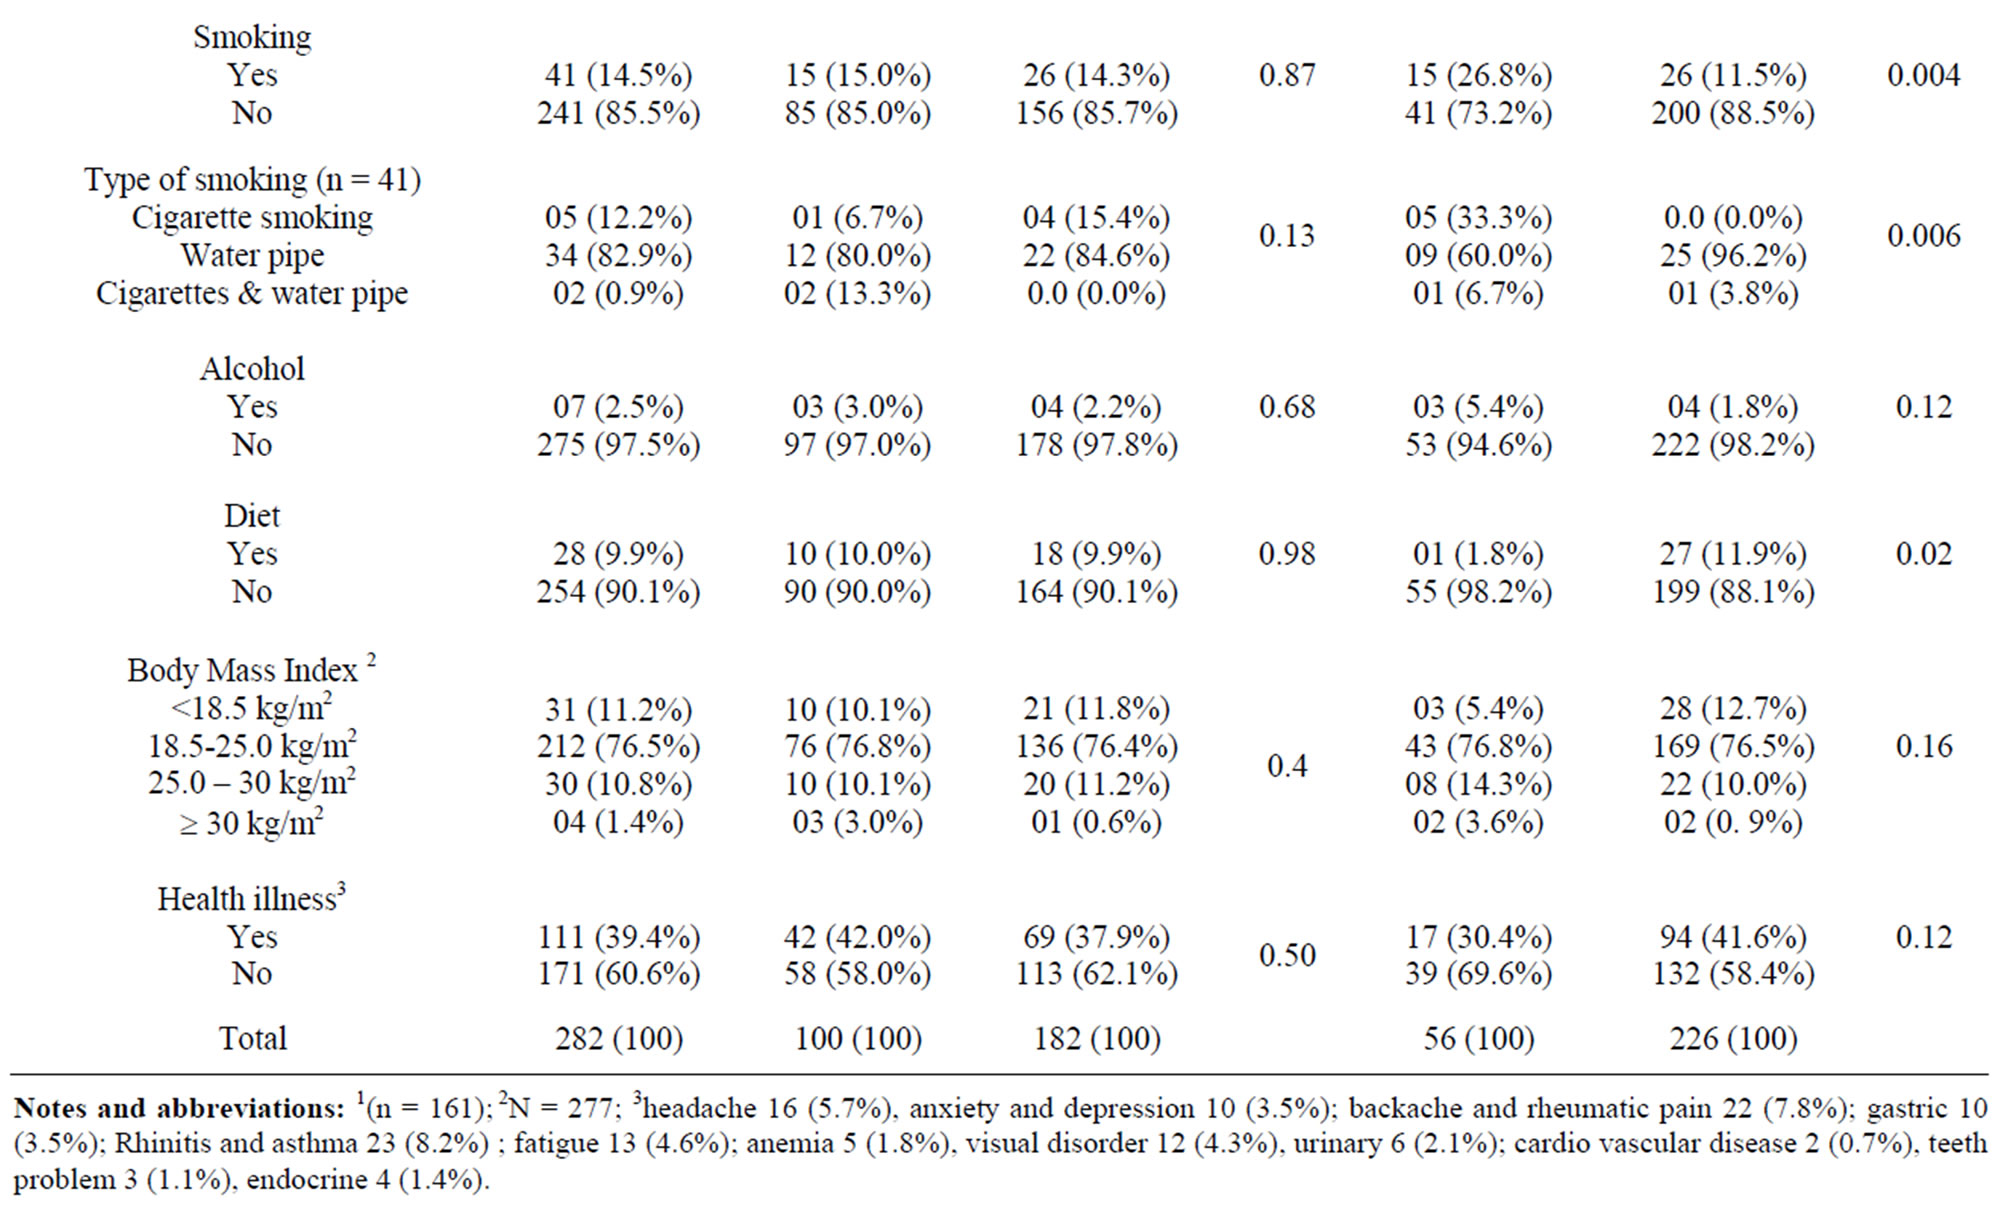
Table 1. Socio demographic, environmental, lifestyle behavior and health illness of students according to area of residence (urban vs. rural) and gender (male vs., female): Chi-square tests results.
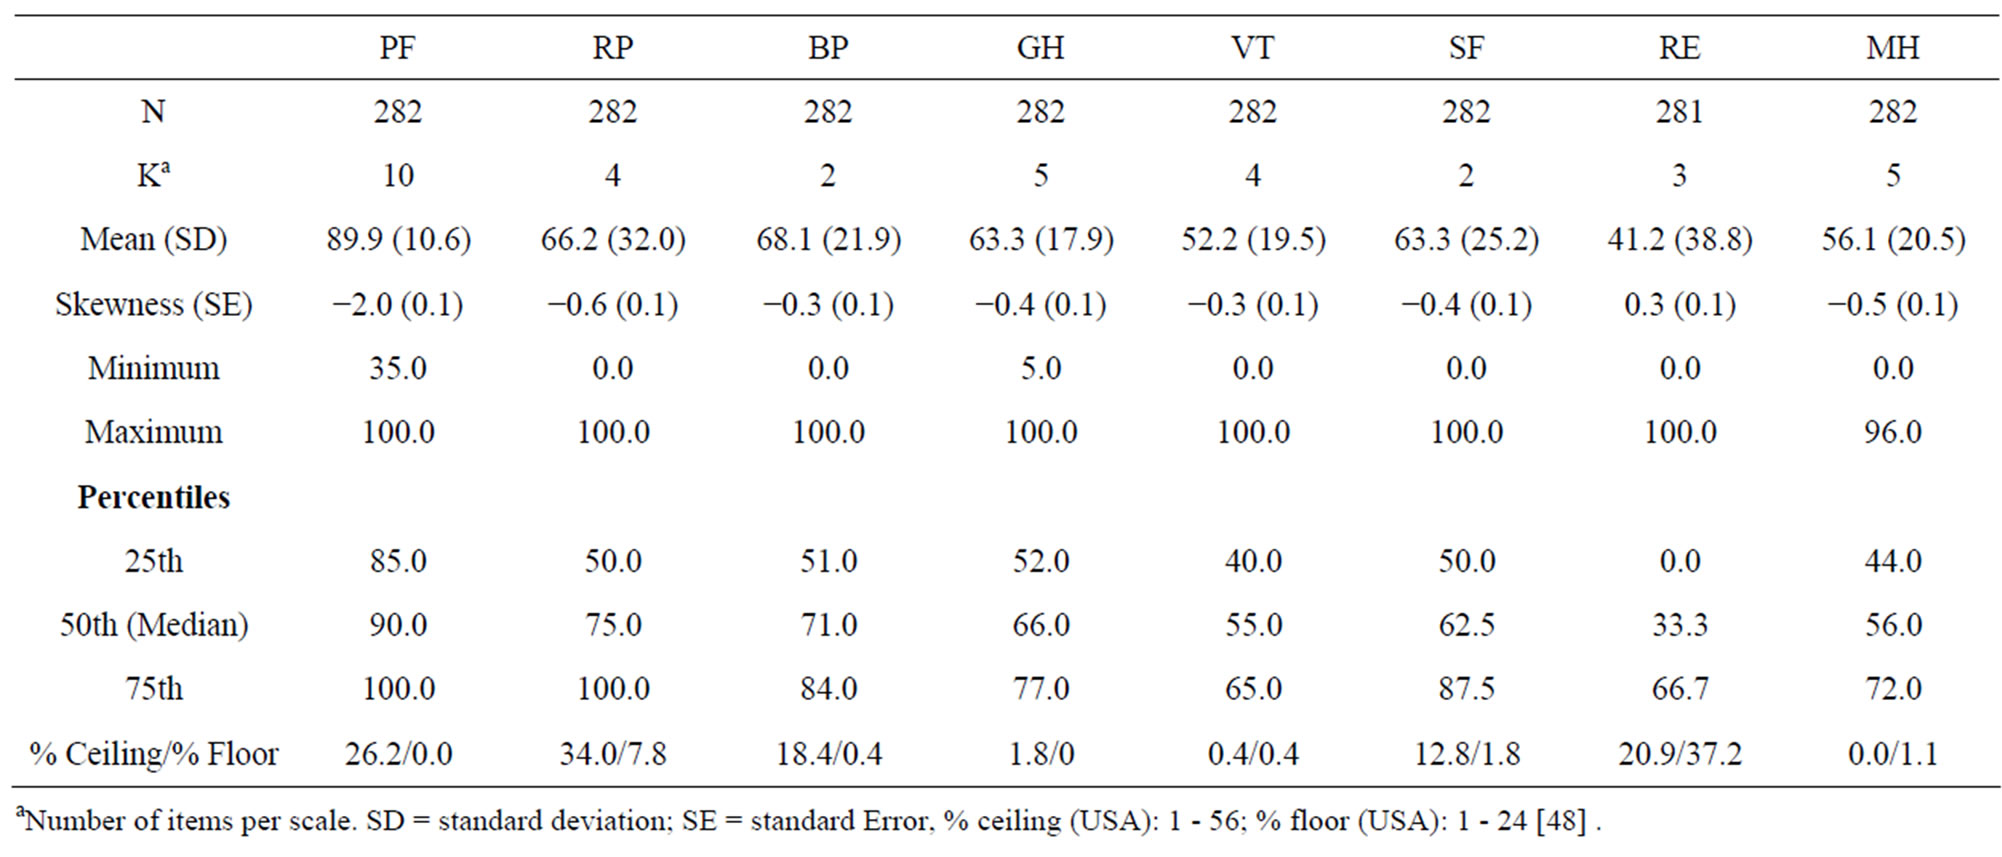
Table 2. Description of scales of the SF-36: mean, SD, percentiles, and % ceiling and floor.
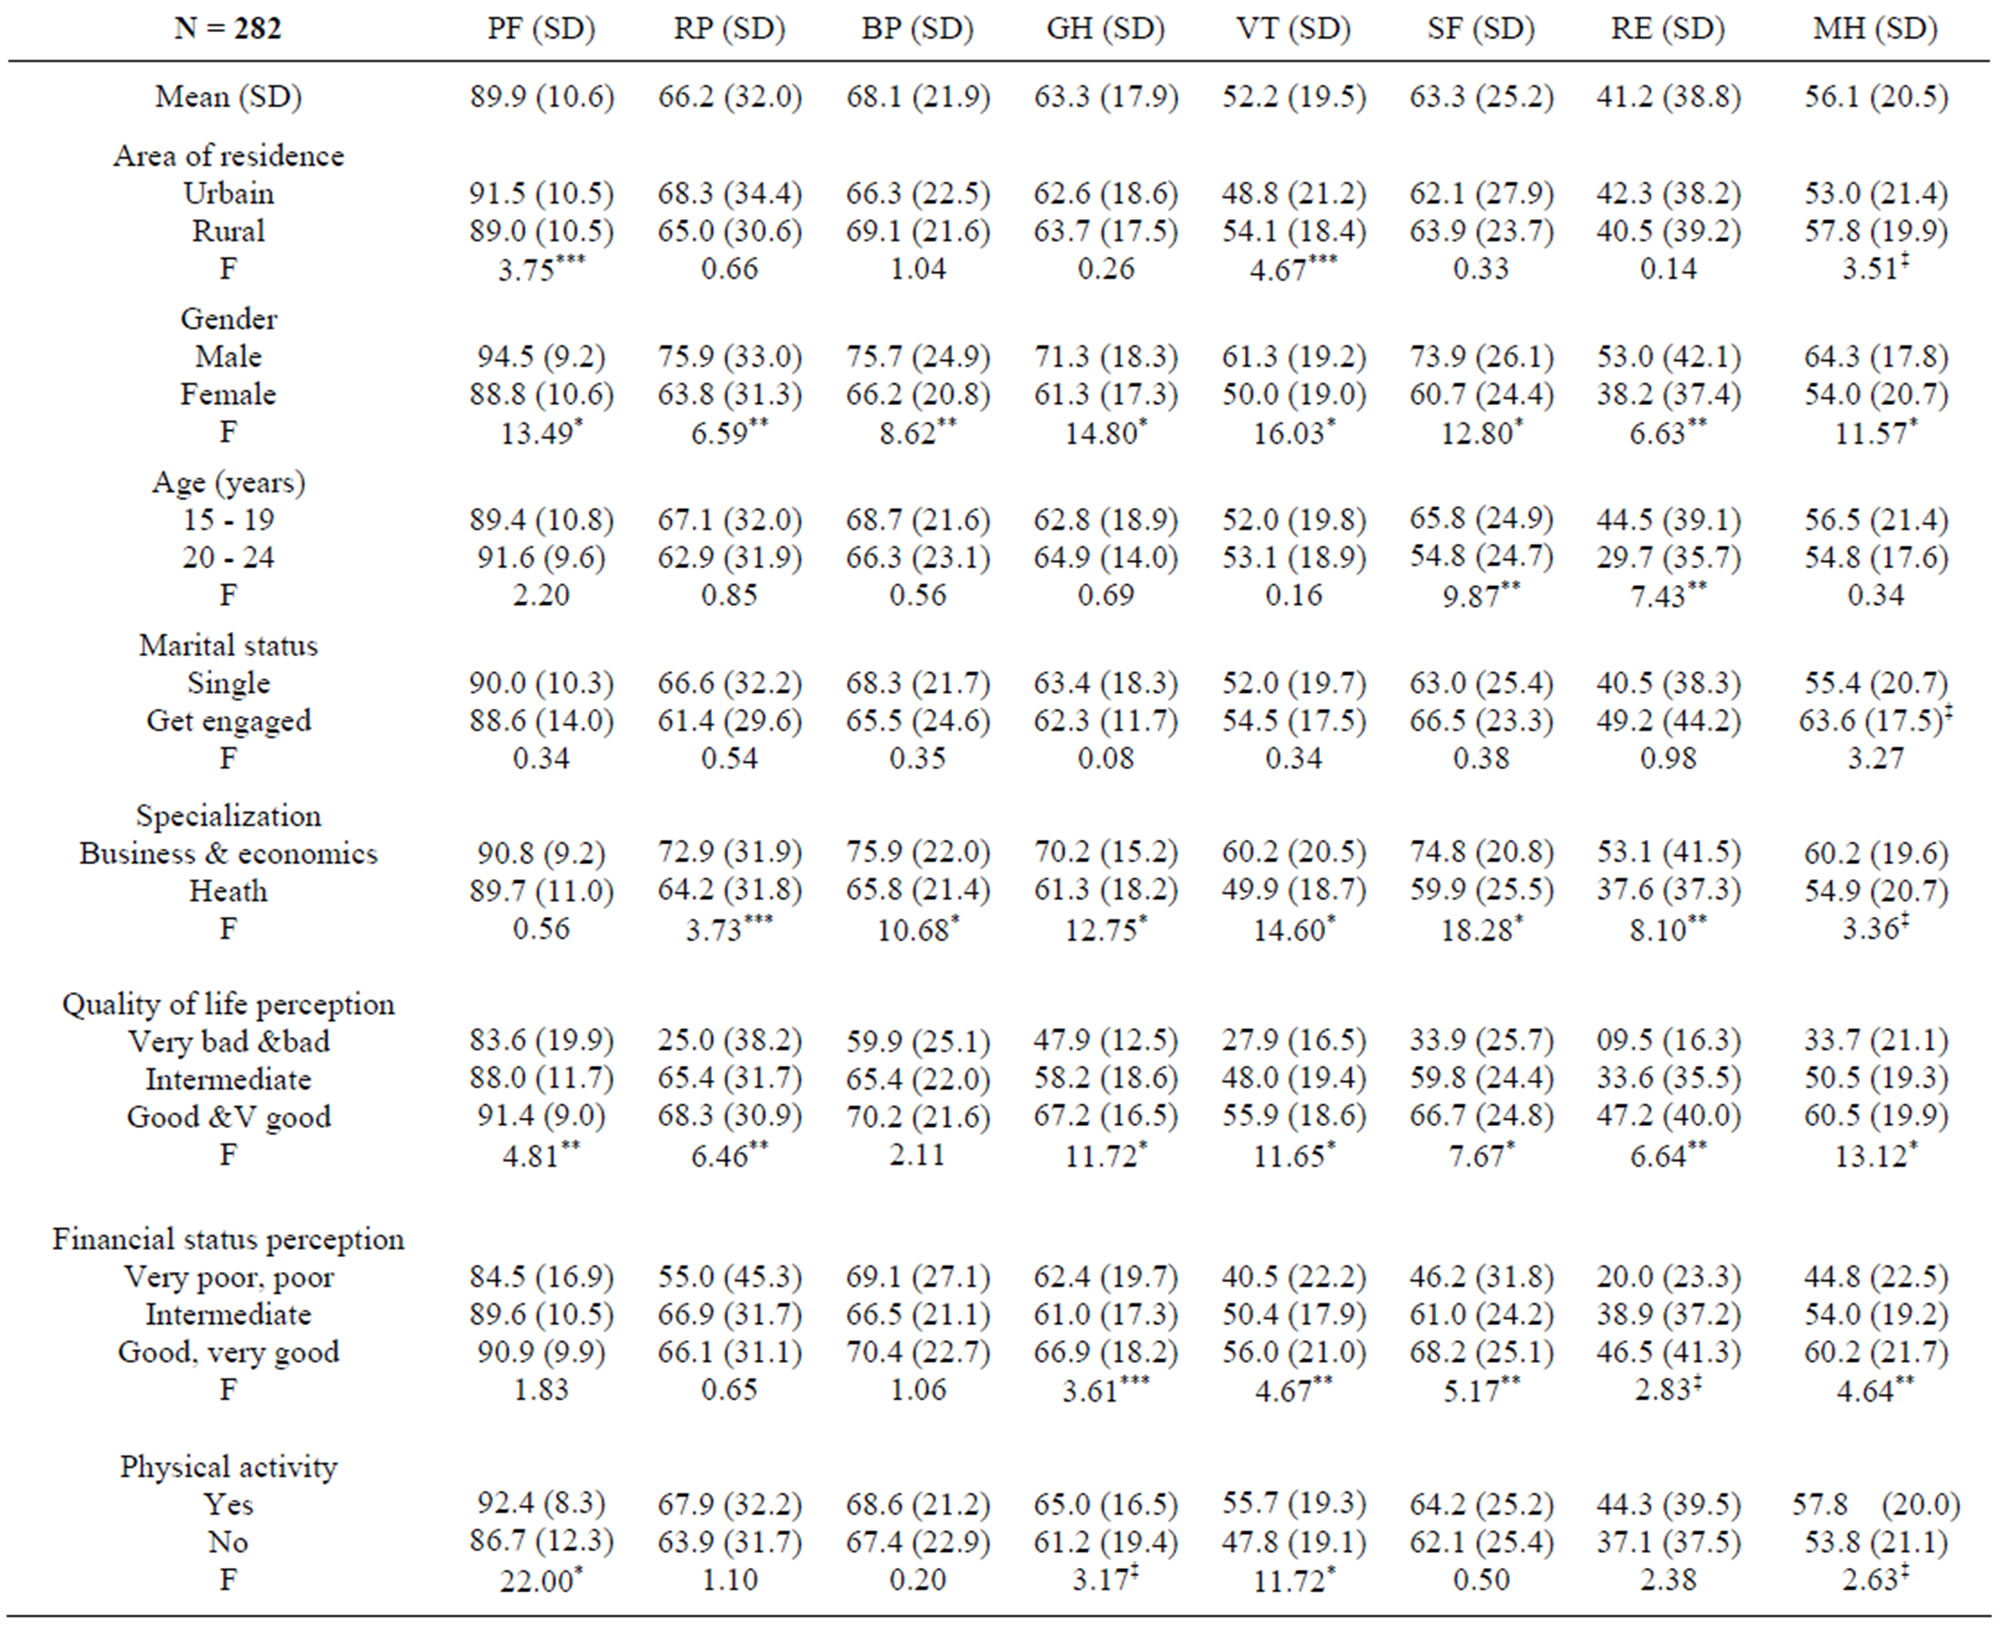
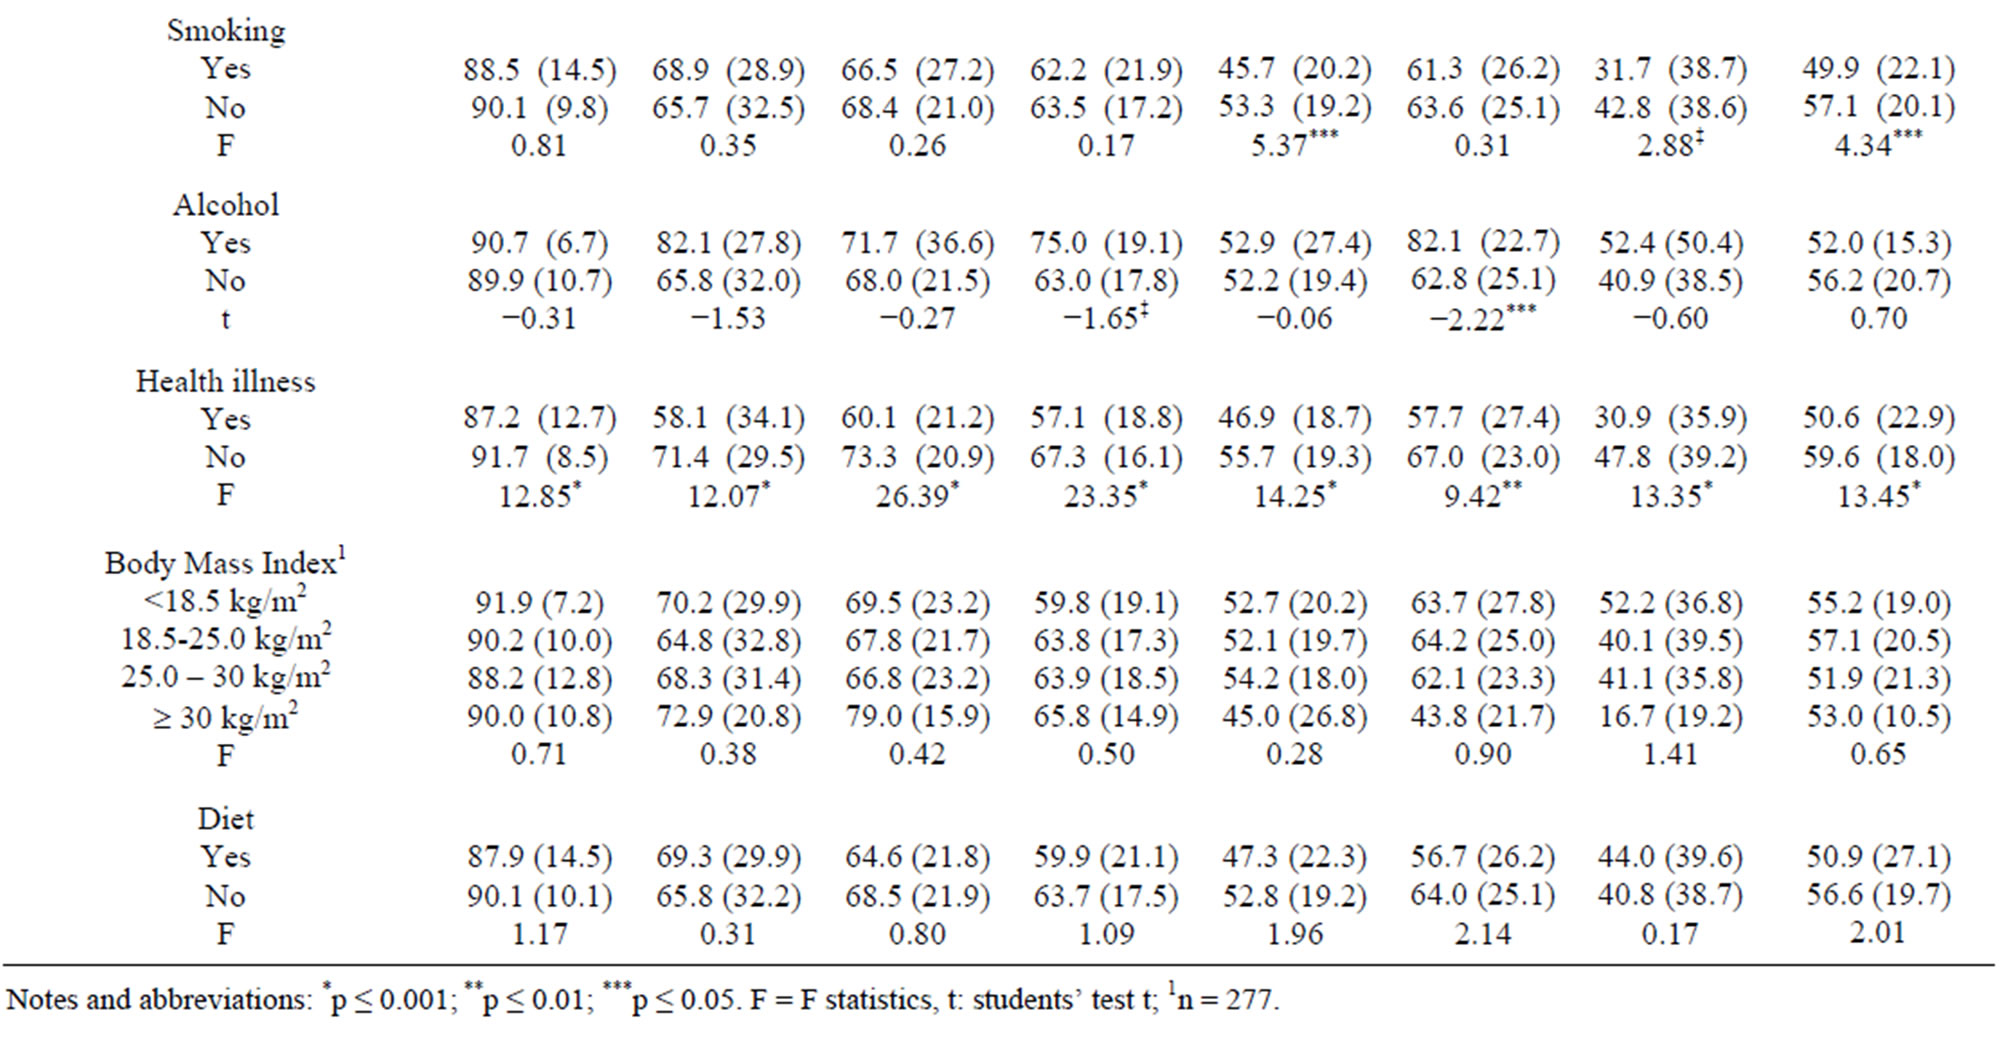
Table 3. Relation between the SF-36 scale scores and socio-demographic, environmental characteristics, lifestyle behaviors of the subjects: one way ANOVA.
4. DISCUSSION AND CONCLUSIONS
The aim of the present study was to explore the predictors of young university students’ HRQoL. An additional objective was to examine the possible role of other factors such as gender and area of residence (urban/ rural) in order to help decision makers to elaborate health promotion strategies for university youth.
As in other studies [3,11,30-33,49], socio-demographic and economic status influenced to a great extent the HRQoL of the individuals; but area of residence did not [11]. In contrast to others [18], younger age scored higher in SF and RE. The mean scores for all SF-36 scales revealed that the population as a whole had a badly perceived HRQoL and, that males had better selfperceived health than females [3,22,30-32] especially in the mental health. This could be explained by the fact that women may experience a wider range of stressful life events compared to men [3,31]. Family maintains a central role in the young’s quality of life. The level of education of fathers negatively influenced youth HRQoL, but mothers’ education did not [3,22,30]. Indeed, the study showed that students of fathers that have a higher level of education (university and higher) reported poorer vitality. A possible explanation for this is that fathers in the high socio-economic status level experience greater career and family pressures [50]. As for adolescents [32] and children [42], the somatic illness of parents was strongly associated with reporting less positive HRQoL by the young students. This association shows the importance of addressing the issue of parental health status when clinicians, counselors, educators and researchers have to understand and/or treat problems of the young low wellbeing and functioning in new models of health promotion and care [32]. The demographic and epidemiological transition in Lebanon [31,36,42,43] and the daily immigration of the students may explain the non difference in reported illness and HRQoL between rural and urban residence area.
Many young university students declared general health, social, emotional, and mental health difficulties. The scores of HRQoL are lower compared to the American scores [48] and national norms except for the PF scale [31] (Figure 1). Age, gender, quality of life perception, smoking, and the psychosocial health illness were the main predictors. Other factors may be implicated but not studied such as financial worries and concerns about future career [28,51].
The lifestyle behavior of young is linked to their HRQoL. Results were particularly strong for smoking status where smokers were almost 9.7 and 6.97 times more likely to rate their VT and MH scales scores low compared to non smokers. These findings are similar to those found among young military troops of the United States Air Force [7]. This is not surprising given the negative impact of smoking on health, perhaps utilized as a coping strategy for mental health dysfunction [27]. Our findings are in agreement with previous studies indicating that physical activity is an important determinant of HRQoL [3,30,33,49]. Young women are less ikely to be physically active and they rather participate in home-based activities or unsupervised exercise such as walking [33]. One explanation could be that men and
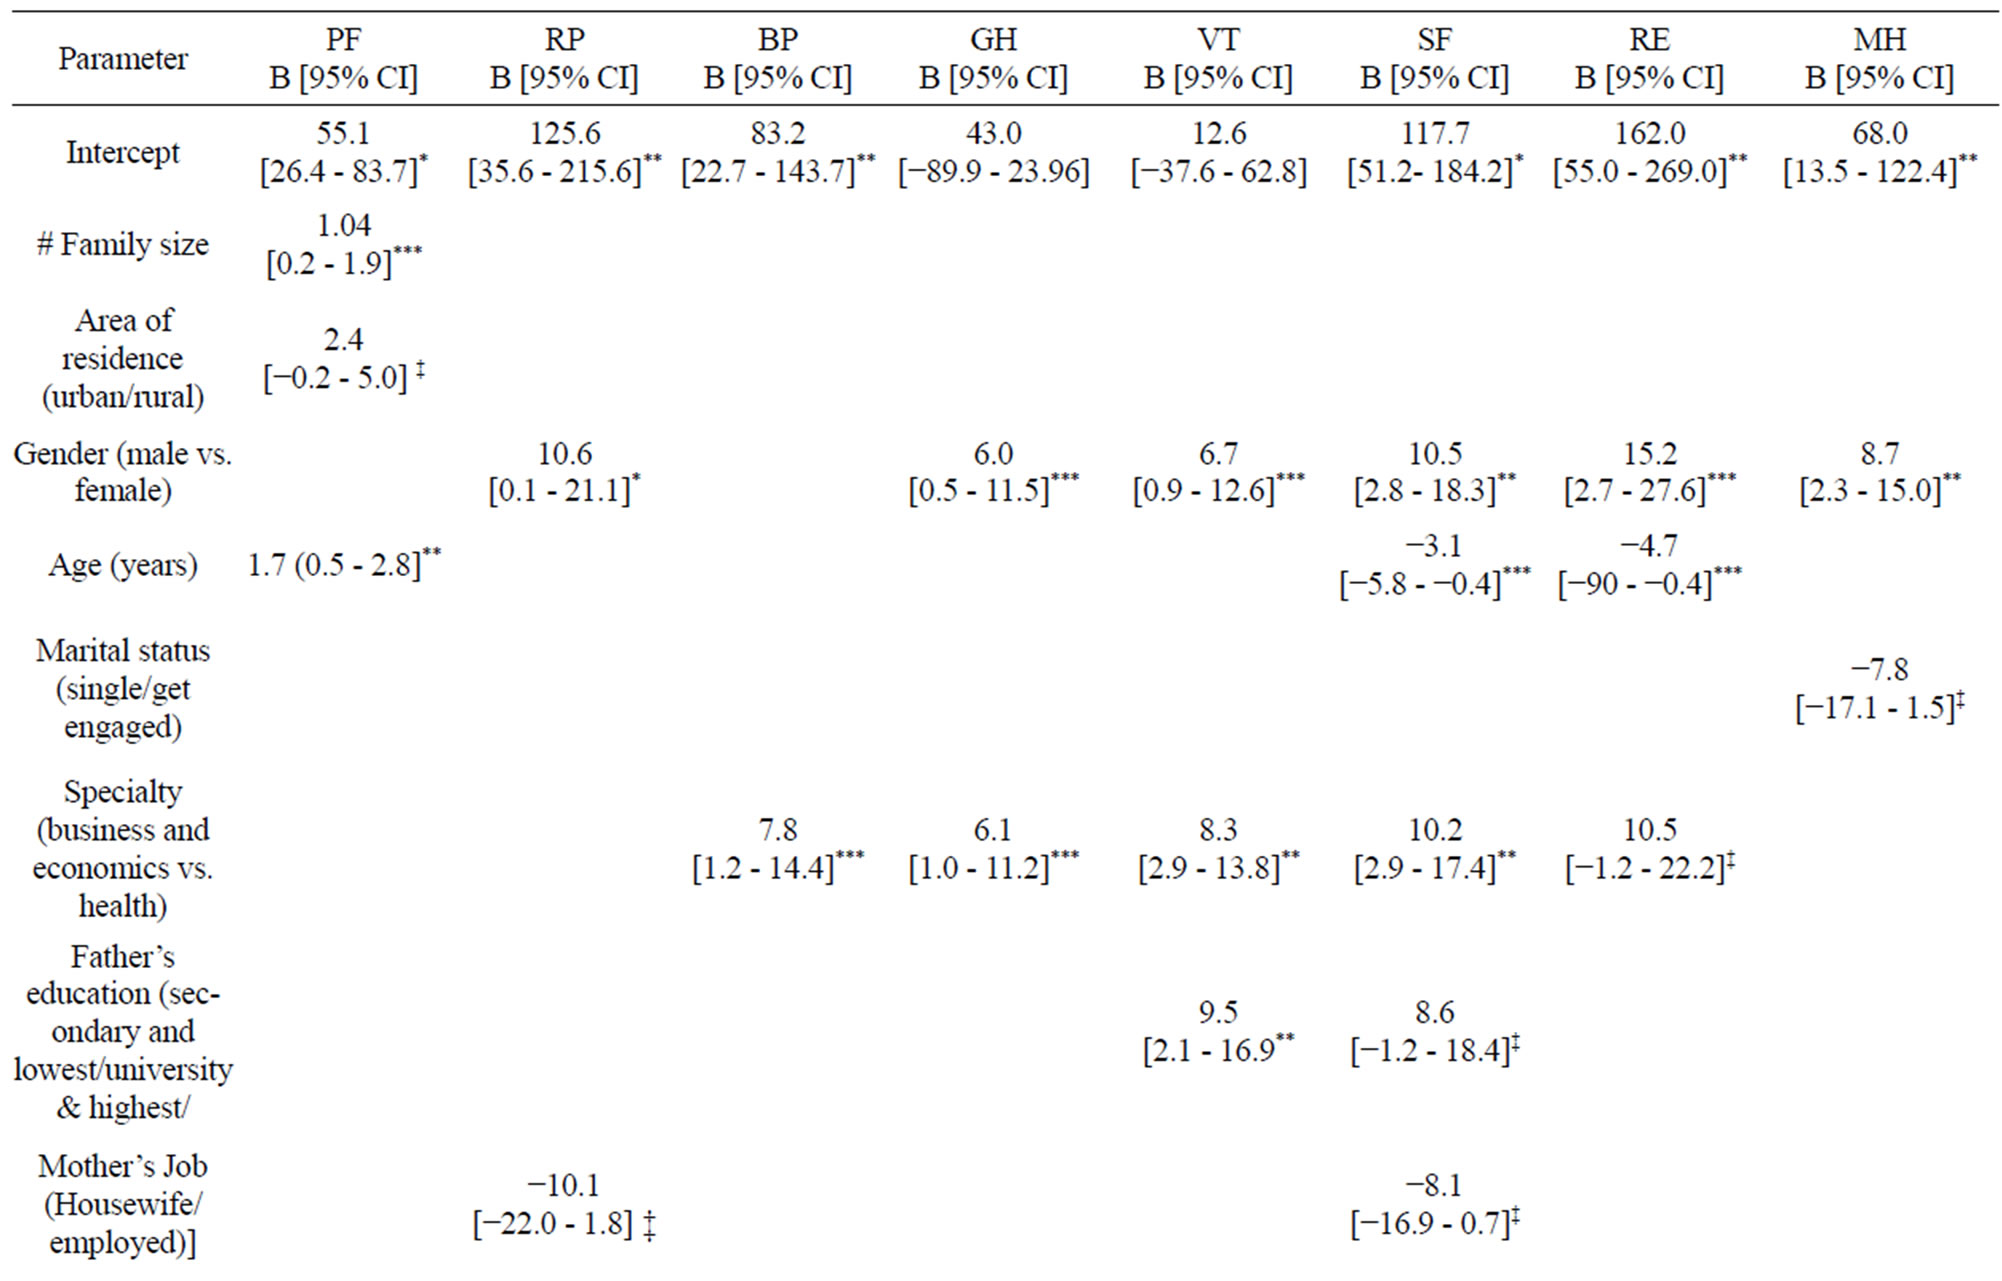
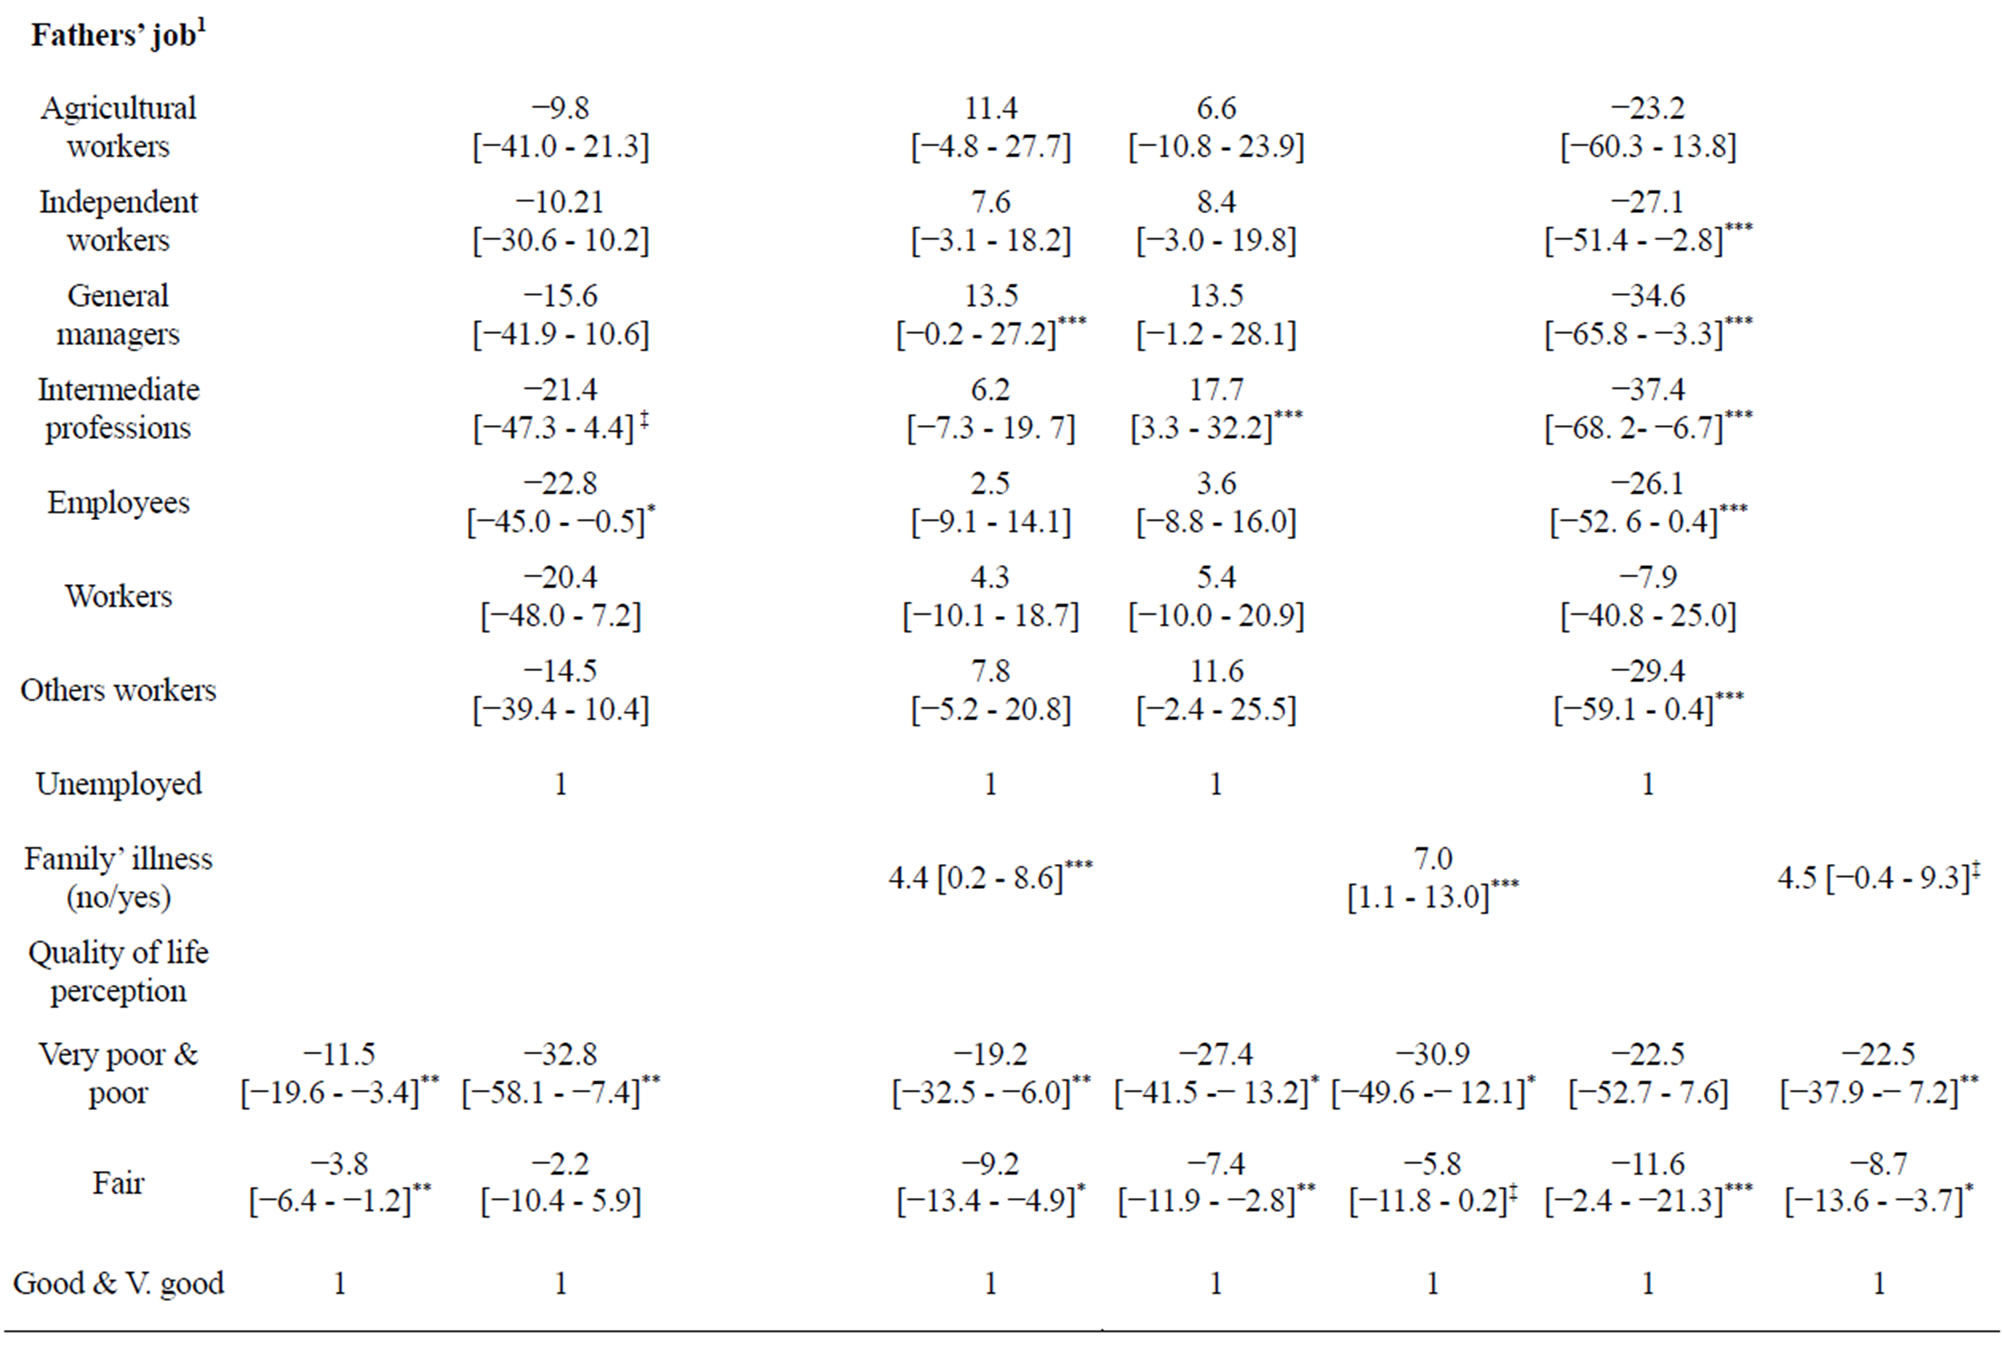
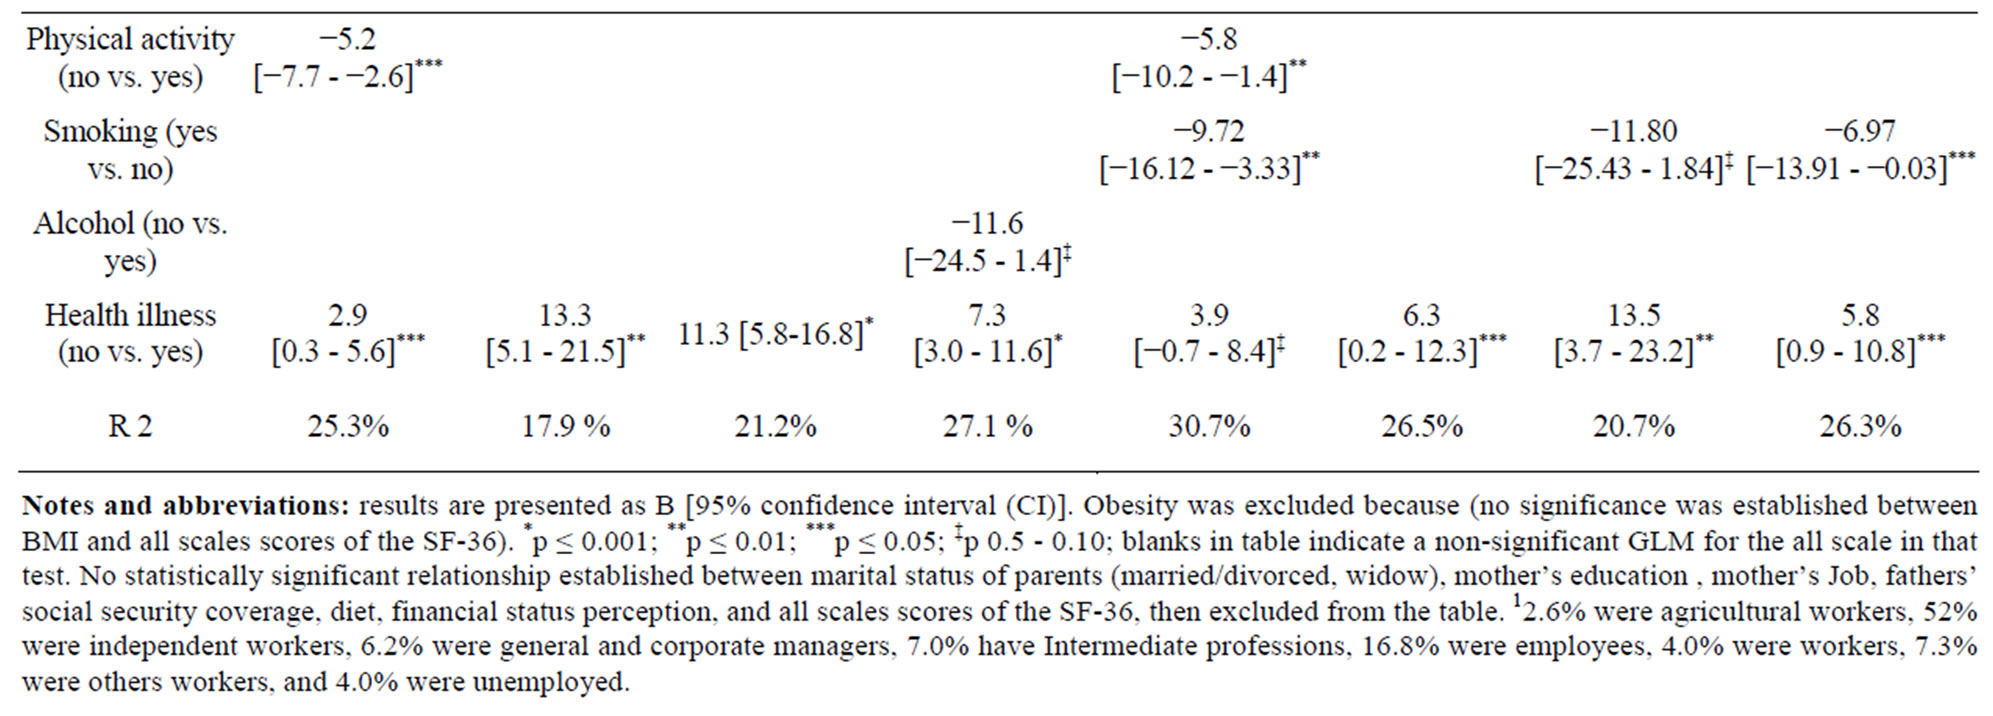
Table 4. Predictors of the SF-36 scale scores: Multivariate analysis results (generalized linear model).
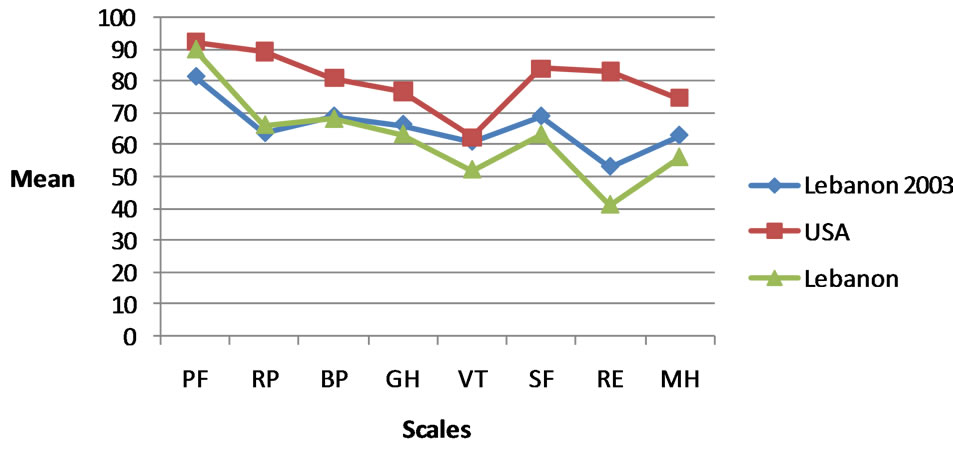
Figure 1. Comparison between SF-36 scales scores of youth in Lebanon, USA youth aged 18 - 24 years, and national scores in Lebanon in 2003.
l women have different motivations for being physically active [3]; while men are usually motivated by intrinsic factors such as challenge and enjoyment, women tend to be motivated by extrinsic motivation factors such as improving appearance, managing weight and avoiding ill-health [3]. No difference between males’ and females’ alcohol consumption was noted, and only few students declared occasional consumption. Our finding is similar to previous research findings in Lebanon, where alcohol consumption is under declared by the population [36], but contradicts others [52,53]. Eating habits of young students often change when they start studying. Often university students suffer from eating disorders, and skipping meals is a common habit [3]. This may explain the high rate of underweight (10%). Diet often adopted by the female students may be inappropriate; nevertheless promoting knowledge about healthy diet does not necessarily lead to better eating habits: healthy foods need to be accessible and available in university restaurants [33] at a reasonable price.
Academic discipline is associated with HRQoL. Students studying health reported many lower SF-36 scales scores than their colleagues studying business and economics. Several factors may be involved such as differences in staffing and difference in the feeling of valorization of students [12] in the two faculties. Many foreign students do not have medical insurance, despite being one of the human rights of population (article 22), without any discrimination according to nationality [54]; this can also influence their health status [36].
There were some potential limitations of the current study. It was carried out in only two faculties at a public university which limits the results to a certain social strata [10]. Also, this is a cross sectional study which cannot establish a temporal relationship between predictors and outcomes [36]. The self reported illness, and weights and heights have also a certain limitation [31]. Females were more prevalent in our sample as in higher education in most European countries [53].
Based on this survey, there is a high need for an in campus preventive medicine and health promotion services. Those services must be funded by the Ministry of Higher Education and the university fees. Students should familiarize and acclimatize with the health promotion services offered [49,55]. Health promotion at university is not and should not be confined to improving young people’s health only, but should aim to build a just and healthy civil society [29]. It is the duty of universities and governing bodies to eradicate the barriers which prevent students from reaching their full potential in education, particularly when these barriers may have an impact on their mental health for the rest of their lives [51]. In the context of university, the wellbeing of the young students requires openness to a dialogue between all partners [29,56]. Positive youth development first originated as a conceptual approach of developing assets within youth as opposed to removing risk factors via “deficit-focused strategies” [10].
Faculty-in-residence programs [10] must be developed in collaboration with teachers, students, relevant health and legal professionals [57], community and family [55]. They must be centered on lifestyle behaviors (like eating habits, tobacco, alcohol, stress, and physical activity), socioeconomic disparities [49], illness and health issues [55], mental health and sex behavior. The most preferred mean to address these health programs may be an Internet site for youth health [24,35,45,49,55,57], and the online usage must be allowed and accessible for every student in the university. Such means are convenient for providers as they are easy to disseminate and low in cost compared to traditional modes of delivery [24]. Furthermore, digital interventions can incorporate interactive materials, such as video streaming and chat rooms, in order to maximize engagement [24], social interaction (even sociality of youth), literacy, and well-being [35].
Finally, leadership and the involvement of professor, student and administrator in research studies are thus key component in the practice of health-promotion [12,45, 56].
In conclusion, the youths’ HRQoL is affected by socio-demographic and behavioral characteristics. It is not only in the best interests of an institution but also it is its responsibility to invest in a student’s wellbeing [51]. Effective health-promoting actions, social support and counseling services should be implemented in the campus and are a necessary step towards the main goal of improving the overall HRQoL of the university young students in Lebanon.
5. ACKNOWLEDGEMENTS
The authors wish to acknowledge Mrs. F. Badran for her help and advice on the manuscript. We are grateful to the subjects who participated in this survey, and helped to carry out this study.
REFERENCES
- Bakar, A.A. (2012) Health-related quality of life among youth: Evaluating measurement model fit. International Journal of Social Science and Humanity, 2, 282-285. http://www.ijssh.org/papers/110-CH214.pdf
- Ford, J., Spallek, M. and Doson, A. (2008) Self-rated health and a healthy lifestyle are the most important predictors of survival in elderly women. Age and Ageing, 37, 194-200. doi:10.1093/ageing/afm171
- Schmidt, M. (2012) Predictors of self-rated health and lifestyle behaviours in Swedish university students. Global Journal of Health Science, 4, 1-14. doi:10.5539/gjhs.v4n4p1
- Tümkaya, S. (2011) Humor styles and socio-demographic variables as predictors of subjective well-being of Turkish university students. Education and Science, 36, 158-170. http://egitimvebilim.ted.org.tr/index.php/EB/article/viewFile/463/26
- Moghnie, L. and Kazarian, S.S. (2011) Subjective happiness of Lebanese college youth in Lebanon: Factorial structure and invariance of the Arabic subjective happiness scale. Social Indicators Research, 109, 203-210. doi:10.1007/s11205-011-9895-5 http://www.aub.edu.lb/fas/psychology/people/Documents/moghnie.kaz.2011.pdf
- Palepu, A., Hubley, A.M., Russell, L.B., Gadermann, A.M. and Chinni, M. (2012) Quality of life themes in Canadian adults and street youth who are homeless or hard-tohouse: A multi-site focus group study. Health and Quality of Life Outcomes, 10, 93. http://www.hqlo.com/content/10/1/93 doi:10.1186/1477-7525-10-93
- Haddock, C.K., Poston, W.S.C., Pyle, S.A., Klesges, R.C., Vander Weg, M.W., Peterson, A. and Debon, M. (2006) The validity of self-rated health as a measure of health status among young military personnel: Evidence from a cross-sectional survey. Health and Quality of Life Outcomes, 4, 57. doi:10.1186/1477-7525-4-57
- Zeller, M.H. and Modi A.C. (2006) Predictors of healthrelated quality of life in obese youth. Obesity, 14, 122- 130. http://onlinelibrary.wiley.com/doi/10.1038/oby.2006.15/pdf doi:10.1038/oby.2006.15
- Ravens-Sieberer, U., Gosch, A., Abel, T., Auquier, P., Bellach, B-M., BruiP, J., Dür, W., Power, M., Rajmil, L. and the European KIDSCREEN Group (2001) Quality of life in children and adolescents: A European public health perspective. Sozialund Präventivmedizin, 46, 294-302. http://link.springer.com/content/pdf/10.1007%2FBF01321080#page-1
- Zullig, K.J., Teoli, D.A. and Ward, R.M. (2011) Not all developmental assets are related to positive health outcomes in college students. Health and Quality of Life Outcomes, 9, 52. doi:10.1186/1477-7525-9-52
- Mikolajczyk, R.T., Brzoska, P., Maier, C., Ottova, V., Meier, S., Dudziak, U., Ilieva, S. and El Ansari, W. (2008) Factors associated with self-rated health status in university students: A cross-sectional study in three European countries. BMC Public Health, 8, 215. doi:10.1186/1471-2458-8-215
- Chabot, G., Godin, G. and Gagnon, M.-P. (2010) Determinants of the intention of elementary school nurses to adopt a redefined role in health promotion at school. Implementation Science, 5, 93. http://www.implementationscience.com/content/5/1/93 doi:10.1186/1748-5908-5-93
- Eapen, V., Faure-Brac, G., Ward, P.B., Hazell, P., Barton, G., Asghari-Fard, M. and Dullur, P. (2012) Evaluation of weight gain and metabolic parameters among adolescent psychiatric inpatients: Role of health promotion and life style intervention programs. Journal of Metabolic Syndrome, 1, 109. doi:10.4172/2167-0943.1000109
- Chen, C.-Y. and Storr, C.L. (2006) Alcohol use and health-related quality of life among youth in Taiwan. Journal of Adolescent Health, 39, 752.e9-752.16. http://www.ncbi.nlm.nih.gov/pmc/articles/PMC2278239/pdf/nihms38967.pdf
- Medar, M., Õun, K. and Looring M. (2012) Economic growth versus development of social welfare structures in Europe. http://halshs.archives-ouvertes.fr/docs/00/66/57/07/PDF/Liege2011-medar-oun.pdf
- Marttinen, E. and Salmela-Aro, K. (2012) Personal goal orientations and subjective well-being of adolescents. Japanese Psychological Research, 54, 263-273. doi:10.1111/j.1468-5884.2012.00521.x
- El Ansari, W. and Stock, C. (2012) Is the health and wellbeing of university students associated with their academic performance? Cross sectional findings from the United Kingdom. International Journal of Environmental Research and Public Health, 7, 509-527. doi:10.3390/ijerph7020509
- Leontopoulou, S. and Triliva, S. (2012) Explorations of subjective wellbeing and character strengths among a Greek University student sample. International Journal of Wellbeing, 2, 251-270. doi:10.5502/ijw.v2.i3.6
- Undpf (1998) Chapter 7: Youth & health. In: The 1998 National Human Development Report: Youth and Development, United Nations Development Programme, Beirut, 87-97. http://www.undp.org.lb/programme/governance/advocacy/nhdr/nhdr98/chptr7.pdf
- Bradley, B.J. and Greene, A.C. (2013). Do health and education agencies in the United States share responsibility for academic achievement and health? A review of 25 years of evidence about the relationship of adolescents’ academic achievement and health behaviors. Journal of Adolescent Health, 52, 523-532. www.jahonline.org doi:10.1016/j.jadohealth.2013.01.008
- Wiklund, M., Malmgren-Olsson, E.-B., Öhman, A., Bergström, E. and Fjellman-Wiklund, A. (2012) Subjective health complaints in older adolescents are related to perceived stress, anxiety and gender—A cross-sectional school study in Northern Sweden. BMC Public Health, 12, 993. doi:10.1186/1471-2458-12-993
- Chow, H.P. (2010) Predicting Academic success and psychological wellness in a sample of Canadian undergraduate students. Electronic Journal of Research in Educational Psychology, 8, 473-496. http://www.investigacion-psicopedagogica.org/revista/articulos/21/english/Art_21_413.pdf
- Barnes, V.A., Bauza, L.B. and Treiber, F.A. (2003) Impact of stress reduction on negative school behavior in adolescents. Health and Quality of Life Outcomes, 1, 10. http://www.hqlo.com/content/1/1/10 doi:10.1186/1477-7525-1-10
- Epton, T., Norman, P., Sheeran, P., Harris, P.R., Webb, T. L., Ciravegna, F., Brennan, A., et al. (2013) A theorybased online health behavior intervention for new university students: Study protocol. BMC Public Health, 13, 107. doi:10.1186/1471-2458-13-107
- Correa-Burrows, P., Burrows, R., Uauy, R. and Albala, C. (2012). Health production and risk of obesity among Chilean adolescents: Understanding health related behaviors in youth. Health, 4, 1413-1419. doi:10.4236/health.2012.412A204
- National Institute for Health and clinical Excellence (NIH) (2009) Promoting young people’s social and emotional wellbeing in secondary education. NHS, London, 45pp. http://www.nice.org.uk/nicemedia/pdf/PH20Guidance.pdf
- Robinson, M., Kendall, G.E., Jacoby, P., Hands, B., Beilin, L.J., Silburn, S., Zubrick, S.R. and Oddy, W.H. (2011) Lifestyle and demographic correlates of poor mental health in early adolescence. Journal of Paediatrics and Child Health, 47, 54-61. doi:10.1111/j.1440-1754.2010.01891.x
- Department of Education and Skills/Health Service Executive/Department of Health (2013) Well-being in postprimary schools: Guidelines for mental health promotion and suicide prevention. http://www.labour.ie/download/pdf/well_being_pp_schools_guidelines.pdf
- O’Brien, M. with the Human Development Team (2008) Student well-being. Well-being and post-primary schooling: A review of the literature and research. National Council for Curriculum and Assessment (NCCA) Research Report No. 6, Dublin. http://www.ncca.ie/uploadedfiles//Curriculum/post-primary/wellbeing/Well-being_report_en.pdf
- Salam, A.A., Alshekteria, A.A., Mohammed, H.A.A., Al Abar, N.M., Al Jhany, M.M. and Al Flah, M.F. (2012) Physical, mental, emotional and social health status of adolescents and youths in Benghazi, Libya. Eastern Mediterranean Health Journal, 18, 586-597. http://www.emro.who.int/emhj-list/emhj-volume-18-2012/vol18-issue6.html
- Sabbah, I., Drouby, N., Sabbah, S., Retel-Rude, N. and Mercier M. (2003) Quality of Life in rural and urban populations in Lebanon using SF-36 Health Survey. Health and Quality of Life Outcomes, 1, 30. http://www.hqlo.com/content/1/1/30 doi:10.1186/1477-7525-1-30
- Giannakopoulos, G., Dimitrakaki, C., Pedeli, X., Kolaitis, G., Rotsika, V., Ravens-Sieberer, U. and Tountas, Y. (2009) Adolescents’ wellbeing and functioning: Relationships with parents’ subjective general physical and mental health. Health and Quality of Life Outcomes, 7, 100. doi:10.1186/1477-7525-7-100
- Naidoo, J. and Wills, J. (2005) Public health and health promotion Developing practice, 2nd Edition, Balliere Tindall, London.
- Wille, N., Bullinger, M., Holl, R., Hoffmeister, U., Mann, R., Goldapp, C., Reinehr, T., Westenhöfer, J., et al. (2010) Health-related quality of life in overweight and obese youths: Results of a multicenter study. Health and Quality of Life Outcomes, 8, 36. http://www.hqlo.com/content/8/1/36
- Hume, M. and Mort, G.S. (2012) iLeisure: Conceptualizing youth online leisure and quality of life. International Journal of Organisational Behaviour, 17, 87-107. http://eprints.usq.edu.au/21893/1/Hume_Mort_IJOB_v17n2_PV.pdf
- Sabbah, I., Vuitton, D.-A., Droubi, N., Sabbah, S. and Mercier, M. (2007) Morbidity and associated factors in rural and urban populations of South Lebanon: A crosssectional community-based study of self-reported health in 2000. Tropical Medicine and International Health, 12, 907-919. doi:10.1111/j.1365-3156.2007.01886.x
- Pišot, R. and Kropej, V.L. (2006) Correlation between perceived quality of life and healthy environment in youth. FACTA UNIVERSITATIS Series: Physical Education and Sport, 4, 115-123. http://facta.junis.ni.ac.rs/pe/pe200602/pe200602-04n.pdf
- Jarpe-Ratner, E., Zamula, A., Meyer, D., Nieto, A. and McCord, M. (2013) The healthy schools healthy families program—Physical activity integration into elementary schools in New York city. Journal of Community Medicine & Health Education, 3, 194. doi:10.4172/2161-0711.1000194
- WHO (2006) Mental health and psychosocial protection and support for adults and children affected by the Middle East crisis: Inter-agency technical advice for the current emergency. http://www.who.int/hac/network/interagency/news/IA_tehcnical_advice_mental_health.pdf
- Tayara, R. (2013) Resiliency and war experiences: A psychometric study of the Lebanese adolescent experience of war. International Journal of Psychology and Behavioral Sciences, 3, 23-33.
- UNESCO (2012) Youth policy in Lebanon. http://www.unesco.org/new/fileadmin/MULTIMEDIA/FIELD/Beirut/images/Youth_Policy_in_Lebanon_English_.pdf
- Sabbah, I., Sabbah, H., Sabbah, S., Akoum, H., Droubi, N. and Mercier, M. (2012) Measurement properties of the Arabic Lebanon version of the pediatric quality of life inventory 4.0 generic core scales for young child (5 - 7 years), and child (5 - 7 years), and child aged 8 - 12 Years: Quality of life in urban and rural children in Lebanon. Creative Education, 3, 959-970. doi:10.4236/ce.2012.326146
- Sabbah, I., Sabbah, H., Sabbah, S., Akoum, H. and Droubi, N. (2012) Burnout among Lebanese nurses: Psychometric properties of the Maslach burnout inventoryhuman services survey (MBI-HSS). Health, 4, 644-652. doi:10.4236/health.2012.49101
- Farhood, S.L. and Noureddine, S.N. (2003) PTSD, depression, and health status in Lebanese civilians exposed to a church explosion. International Journal of Psychiatry in Medicine, 33, 39-53. http://www.ncbi.nlm.nih.gov/pubmed/12906342#
- Maroun, N., Kahi, H., Chemaly, N., ElKahi, H. and Akl, E.A. (2013) Needs assessment for a university-based youth clinic in Beirut, Lebanon: A mixed quantitative and qualitative study. The Open Public Health Journal, 6, 21-30. http://benthamscience.com/open/tophj/articles/V006/21TOPHJ.pdf
- Harb, C. (2010) Describing the Lebanese youth: A national and psycho-social survey. Youth in the Arab world, Working Paper Series #3. http://www.aub.edu.lb/ifi/public_policy/arab_youth/Documents/working_paper_series/ifi_wps03_ay_Harb.pdf
- Mahfoud, Z., Abdulrahim, S., Taha, M.B., Harpham, T., El Hajj, T., Makhoul, J., Nakkash, R., Kanj, M. and Afifi, R. (2011) Validation of the Arab youth mental health scale as a screening tool for depression/anxiety in Lebanese children. Child and Adolescent Psychiatry and Mental Health, 5, 9. doi:10.1186/1753-2000-5-9
- Ware, J.E. (1997) SF-36 health survey: Manual and interpretation guide. The Health Institute, New England Medical Center, Boston.
- Gan-Yadam, A., Shinohara, R., Sugisawa, Y., Tanaka, E., Watanabe, T., Hirano, M., Tomisaki, E., et al. (2012) Self-assessed health and its aspects in the case of Mongolia. Health, 4, 415-422. doi:10.4236/health.2012.47065
- Williams, J.S. and Cunich, M. (2013) The impact of socioeconomic status on changes in the general and mental health of women over time: Evidence from a longitudinal study of Australian women. International Journal for Equity in Health, 12, 25. doi:10.1186/1475-9276-12-25.
- National Union of Students Scotland (2010) Silently stressed: A survey into student mental wellbeing, Edinburgh. www.nus.org.uk/thinkpositive
- Ministry of Education, Ministry of Health in Lebanon (2005) Lebanon, 2005 global school-based student health, Beirut. http://www.aub.edu.lb/fhs/heru/Documents/heru/resources/pdf/Global_school.pdf
- Franca, L.R., Dautzenberg, B., Falissard, B. and Reynaud, M. (2010) Peer substance use overestimation among French university students: A cross-sectional survey. BMC Public Health, 10, 169. doi:10.1186/1471-2458-10-169
- United Nations (1948) Universal declaration of human rights (Article 22 and Article 2). http://daccess-dds-ny.un.org/doc/RESOLUTION/GEN/NR0/043/88/IMG/NR004388.pdf?OpenElement
- Gahagan, J.C., Jason, T. and Pender, C. (2011) Promoting adolescent males’ health: Utilization of school-based youth health centers in Nova Scotia, Canada. Journal of Community Medicine & Health Education, 1, 112.
- Block, E., Crochet, F., Jones, L. and Papa, T. (2012) The importance of teacher’s effectiveness. Creative Education, 3, 1164-1172. doi:10.4236/ce.2012.326173
- Vogl, L.E., Teesson, M., Newton, N.C. and Andrews, G. (2012) Developing a school-based drug prevention program to overcome barriers to effective program implementation: The CLIMATE schools: Alcohol module. Open Journal of Preventive Medicine, 2, 410-422. doi:10.4236/ojpm.2012.23059