Health
Vol.5 No.3(2013), Article ID:28561,3 pages DOI:10.4236/health.2013.53048
Diets of obese and non-obese older subjects*
![]()
1Tohoku Computer College, Aomori, Japan
2Hirosaki University of Health and Welfare, Aomori, Japan
3Department of Physical Therapy, Aomori University of Health and Welfare, Aomori, Japan
4Hirosaki University Graduate School of Health Sciences, Aomori, Japan
5Division of Sleep Medicine, Department of Medicine, Harvard Medical School, and Brigham and Women’s Hospital, Boston, USA
6Sendai Tomizawa Hospital, Sendai, Japan; #Corresponding Author: hsasakihide@yahoo.co.jp
Received 20 December 2012; revised 24 January 2013; accepted 9 February 2013
Keywords: Obesity; Food Intake; Exercise; Model Nutritional Balance Chart; Older Subjects
ABSTRACT
Aim: To compare diets between obese and nonobese in healthy older subjects. Methods: Fortyfive obese and eighty-seven non-obese older subjects were recruited and their habitual factors that may contribute to obesity were assessed. Intakes of food by food-group in the obesity and non-obesity groups were checked using a visual type presentation of model nutriational balance chart (MNBC). Results: Average intake ratio of food relative to ideal food intake was significantly higher in the obesity group than the non-obesity group. The relationship of obesity and exercise or habitual activities was not significant. Conclusion: Food intake is a primary factor of obesity but regular exercise or habitual activities is not a key factor for obesity in older subjects. Since exercise habit is difficult to achieve in older subjects, particularly those who are obese, food control using the present visualtype MNBC would be one strategy forthe management of obesity.
1. INTRODUCTION
The increasing incidence of obesity, and its contribution to metabolic syndrome in all age group, is becoming an urgent public health, syndrome in all ages. Childhood obesity is thought to be a risk factor for metabolic syndrome in adulthood because obesity in children tends to persist into adulthood. Cross-sectional studies have shown that children’s weights were associated with food consumption and decreased exercise levels, primarily through sedentary lifestyles. On the other hand, interventions to prevent childhood obesity have been inconsistent or have shown only limited effects of dietary habits and physical activity [1]. In the previous study [2], we reported that food intake was not a primary factor contributing to obesity but exercise was a key factor for reducing obesity in children. Iijima et al. [3] suggested that lower physical activity, but not excessive caloric intake, is associated with the prevalence of metabolic syndrome in older patients with type 2 diabetes mellitus. However, because vigorous exercise programs arerarely tolerated in older subjects, this key factor to contributing to obesity might not be consistent found in this group [4]. In the present report, we compared diets between obese and non-obese older subjects and compared diets with physical activity.
2. METHODS
Subjects were recruited from healthy older subjects more than 65 years old who jointed to programs for preventing self-care dependency in older subjects in five places in Odate City, Akita prefecture, Japan, where the authors had health assignments as nurses. Older subjects were considered to be obese when the body mass index (BMI) kg/m² exceeded 25 kg/m², those with BMI <25 kg/m²were considered to be non-obese. The subjects of the present study had no cardiac or pulmonary diseases, brain damage, or metabolic diseases except for some older subjects taking maintenance anti-hypertensive medicines. All subjects can walk and performed their active life by themselves. Barthel Indexes [5] of them were more than 90. Among 191 subjects, 42 subjects refused to participate in the study, leaving 149 subjects. Among these, 133 participants, female/ male, 110/23, average age 78 ± 6 years, completed a questionnaire about physical characteristics, health assessment, life styles, including habits and hobbies.
Regular exercise were defined as participating, at least twice per week, in sporting clubs such as golf, baseball, gymnastic, dancing, take a walk more than 4 km, or for those in the agricultural sector, working in e.g. rice fields. Food intakes were assessed using the model nutritional balance chart (MNBC) as described previously [6]. Briefly, The MNBC was designed to outline a 6697 kj intake according to the recommendation by the Japan Obesity Society [7]. The MNBC demonstrated the ideal dietary distribution of 11 categories of food: potatoes and grains (hereinafter called grains), meat, fish, eggs, milk and dairy products (hereinafter called milk), beans and bean products, such as bean curd and miso soup (hereinafter called beans), green and yellow vegetables, lightcolored vegetables, fruits, oil, and sugar. The number of times each food category was consumed was marked with black dots; the foods eaten were recorded by category, but not by amount. The subject filled a meal chart which consisted of columns for breakfast, lunch, dinner, and snacks between meals. The meal chart was to be filled out for any 3 days of the last 2 weeks before revisiting the programs for preventing self-care dependence. We calculated the nutritional balance, as follows: (intake ration of food = the actual food intake/the ideal food intake following the MNBC). Thus the nutritional balance based on the MNBC was ideally “1”. In order to analyze large number of subjects, eleven categories of 5381 foods were data based on computer and nutritional balance of three days was visually calculated from the food chart. Ethical approval was obtained from the Ethical Committee of the Akita Nursing and Welfare University. The Mann-Whitney’s U test was used for departures from the ideal value of 1 over all categories. Multivariate logistic regression was used to determine the variances. Values were presented as mean ± SD. Statistical significance was taken at p < 0.05.
3. RESULTS
Average BMIs of obese and non-obese older subjects were 27.1 ± 2.1 kg/m² (varied from 16.3 to 24.9 kg/m², n = 45) and 21.5 ± 2.3 kg/m² (varied from 25.0 to 34.5 kg/m², n = 88), respectively. The numbers of older subjects who did or did not engage in regular exercise were 33 and 10 in the obesity group and 61 and 23 in the nonobesity group, respectively. Exercise performance was not different between obese and non-obese older subjects. When the subjects completed the food chart over the three day interval, visual intakes of eleven categories of food were calculated and input to a computer (Figure 1). Intake-ratio of food in the obesity group was significantly higher than that of the non-obesity group (p < 0.01) (Table 1) in the categories of meat, eggs, oil, and sugar.
The numbers of subjects with hobbies and without hobbies were 29 and 14 in the obesity group and 63 and 17 in the non-obesity group, respectively. Hobby participation was not different between obese and non-obese subjects. The relative impact for obesity (where obese and non-obese subjects corresponded to 0 and 1, respecttively) versus intake ratio of food, exercise and hobby participation was assessed using multiple logistic regression where intake ratio of food entered as a continuous independent variable, exercise and hobby participation were indicator variables (yes/no corresponding to 0/1, respectively). Multiple logistic regression of the relationship between obesity and food was significant (odds ration = 0.21, 95% confidence interval = 0.071 - 0.62, p < 0.01) and not significant for other factors.
4. DISCUSSION
Present study suggests that diet than exercise may be the primary risk factor contributing obesity in older subjects. Exercise but not diet has been reported to be more important to reduce metabolic syndrome in older patients with type 2 diabetes mellitus [3]. This may be due to the fact that diets in type 2 diabetes mellitus are typically carefully restricted, leading to a promotion of the role that exercise plays in both metabolic syndrome and obesity [8]. As noted in the introduction, we previously found that non-obesity children showed a higher intake ratio of food than the obesity children presumably offset by their level of exercise obesity [2]. To the extent that exercise level and metabolic scope become progressively and significantly reduced in the elderly [9], the dietary factors which were secondary in younger individuals may become dominant risk factor for obesity. Diet rather than exercise may be primary factor to differentiate obese from non-obese subjects in the elderly. This represents a new perspective in the shifting of risk factors between young and older subjects.
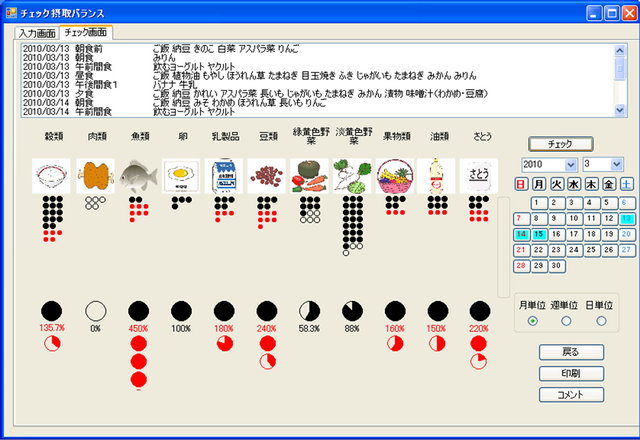
Figure 1. The subject marks servings of food by category over a three day interval (days are marked on the right upper panel). Within each of the eleven categories of foods, black dots correspond to each serving, white dots correspond to the deficit from ideal number of servings, and red dots correspond to servings in excess of the ideal. Pie chart of the ratio of servings consumed to the ideal are shown at the bottom (with excesses shown as additional pie sectors).
Table 1. Intake-ratio of food in obesity and non-obesity groups.
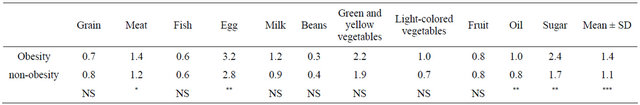
*(p < 0.05), **(p < 0.01) and ***(p < 0.001) shows significances between the obesity group and non obesity group using the two-sided Mann-Whitney’s U test. NS shows no significance. Values are mean ± SD.
Since diets thus appear to be important for contributing obesity in older subjects, the present study developed a visual presentation of foods of MNBC. As a result of the variability in eating patterns within the older age group, it is particularly important that the meal pattern is designed to fit the person’s usual eating habits, including cultural and personal food preferences [10]. Along with these considerations, a simple method of observing nutritional balance for older subjects would be needed. Individual subject would better appreciated a balance diet using the visual presentation of MNBC. The present visual presentation of MNBC might also be useful in managing not only obesity, but related disorders including metabolic syndrome, type 2 diabetes mellitus, and other diseases requiring diet control [11].
REFERENCES
- Flodmark, C.E., Marcus, C. and Britton, M. (2006) Interventions to prevent obesity in children and adolescent, a systematic literature review. International Journal of Obesity, 30, 579-589. doi:10.1038/sj.ijo.0803290
- Satoh, A., Fujita, S., Menzawa, K., Lee, S., Miyamoto, M. and Sasaki, H. (2011) Diets of obese and non-obese children. Health, 3, 487-489. doi:10.4236/health.2011.38080
- Iijima, K., Limuro, S., Ohashi, Y., Sakurai, T., Umegaki, H., Araki, A., Yoshimura, Y., Ouchi, Y., Ito, H. and the Japanese Elderly Diabetes Intervention Trial Study Group (2012) Lower physical activity, but not excessive calorie intake, is associated with metabolic syndrome in elderly with type 2 diabetes mellitus: The Japanese elderly diabetes intervention trial. Geriatrics Gerontology International, 12, 68-75. doi:10.1111/j.1447-0594.2011.00814.x
- Hsiao, P.Y., Jensen, G.L., Hartman, T.J., Mitchell, D.C., Nickols-Richardson, S.M. and Coffman, D.L. (2011) Food intake patterns and body mass index in older adults: A review of the epidemiological evidence. Journal of Nutrition in Gerontology and Geriatrics, 30, 204-224. doi:10.1080/21551197.2011.591266
- Mahoney, F.L. and Barthel, D.W. (1969) Functional evaluation: The barthel index. Maryland State Medical Journal, 14, 61-65.
- Satoh, A., Menzawa, K., Lee, S., Hatakeyama, A. and Sasaki, H. (2007) Dietary guidance for obese children and their families using a model nutritional balance chart. Japan Journal of Nursing Science, 4, 95-102.
- Japan Obesity Society (2001) Obesity manual for guidance of obese patients (in Japanese). Ishiyaku Publishers, Tokyo.
- Iijima, K., Iimuro, S., Shimozaki, T., Ohashi, Y., Sakurai, T., Umegaki, H., Araki, A., Ouchi, Y., Ito, H. and the Japanese Elderly Diabetes Intervention Trial Investigator Group (2012) Lower physical activity is a strong predictor of cardiovascular events in eiderly patients with type 2 diabetes mellitus beyond traditional risk factors: The Japanese elderly diabetes intervention trial. Geriatrics & Gerontology International, 12, 77-87. doi:10.1111/j.1447-0594.2011.00815.x
- Yamada, M., Uemura, K., Mori, S., Nagai, K., Uehara, T., Arai, H. and Aoyama, T. (2012) Faster decline of physical performance in older adults with higher level of baseline locomotive function. Geriatrics Gerontology International, 12, 238-246. doi:10.1111/j.1447-0594.2011.00757.x
- Funnell, M.M. and Merrit, J.H. (1998) Theolder adult with diabetes. Nurse Practitioner Forum, 9, 98-107.
- Satoh, A., Sakurada, T., Hatakeyama, A., Fukuoka, Y., Hatakeyama, R. and Sasaki, H. (2008) Dietary guidance for older patients with diabetes mellitus and primary caregivers using a model nutritional balance chart. Japan Journal of Nursing Science, 5, 83-89. doi:10.1111/j.1742-7924.2008.00105.x
NOTES
*Conflict of interest: We declare no potential conflict of interests.