Engineering
Vol.08 No.11(2016), Article ID:71681,20 pages
10.4236/eng.2016.811067
Groundwater Vulnerability Using DRASTIC and COP Models: Case Study of Halabja Saidsadiq Basin, Iraq
Twana O. Abdullah1,2, Salahalddin S. Ali3, Nadhir A. Al-Ansari2, Sven Knutsson2
1Department of Geology, University of Sulaimani, Sulaymaniyah, Iraq
2Department of Civil, Environmental and Natural Resources and Engineering, Division of Mining and Geotechnical Engineering, Lulea University of Technology, Sweden
3University of Sulaimani, Sulaymaniyah, Iraq

Copyright © 2016 by authors and Scientific Research Publishing Inc.
This work is licensed under the Creative Commons Attribution International License (CC BY 4.0).
http://creativecommons.org/licenses/by/4.0/


Received: October 12, 2016; Accepted: October 28, 2016; Published: October 31, 2016
ABSTRACT
To avoid groundwater from contamination, the groundwater vulnerability tool can be examined. In this study, two methods were applied, namely: DRASTIC (Groundwater depth, Net recharge, Aquifer media, Soil map, Topography, Impact of vadose zone and Hydraulic Conductivity) and COP (Concentration of flow, Overlying layer and Precipitation) to model groundwater vulnerability to pollution. The result illustrated that four vulnerability classes were recognized based on both models including very low, low, moderate and high vulnerability classes. The coverage areas of each class are (34%, 13%, 48% and 5%) by DRASTIC model and (1%, 37%, 2% and 60%) by COP model, respectively. The notable dissimilarity between these two models was recognized. For this reason, nitrate elements were selected as a pollution indicator to validate the result. The concentrations of nitrate were recorded in two following seasons in (30) watering wells; as a result, the substantial variation was noted. This indicates that contaminants can be easily reached the groundwater due to its suitability in geological and hydrogeological conditions in terms of contaminant transportation. Based on this confirmation, the standard DRASTIC method becomes more sensible than COP method.
Keywords:
Vulnerability, DRASTIC, COP, Nitrate Concentration, Halabja Saidsadiq Basin (HSB)

1. Introduction
With the scarcity of surface water, groundwater instead is considered to be one of the most important water sources of various regions. HSB that is situated in the northeast part of Iraq as explained in Figure 1 is a typical example where grounds water is the main source for all humans’ activities. This region in the past was destructed by armed force assaults by concoction weapons. Likewise, a few sections of the zone are described by the absence of water ventures. After 2003, the region is encountering extensive financial improvement and upgraded security. Moreover, the regulatory structure of Halabja has been changed from District to Governorate in March 2014; this will upgrade the start of more noteworthy financial improvement and progression. In perspective of these progressions, there is an expansion of the quantities of individuals going to live in this bowl and its encompassing areas. This is demonstrating a developing interest in water, which forced considerable weights on water assets. As stated by [1] groundwater repositories are effortlessly influenced by contamination, and the procedure is moderate; yet its influences are extremely repulsive. As indicated by the information got from the Directorate of Groundwater in Sulaimani City, a few thousand profound wells exist on the contemplated territory. As an outcome, the investigation into the groundwater assets and its potential contamination in the territory turned into a need.
Groundwater vulnerability is a measure of how easy or how hard it is for pollution at the land surface to reach a productive aquifer. Numerous models have been suggested for mapping groundwater vulnerability, such as: DRASTIC by [2] , GOD by [3] , AVI by

Figure 1. Site map of the study basin.
[4] , and SINTACS by [5] . These models have been for the most part connected to groundwater shield in leaky and fissured aquifers, apart from the EPIK [6] [7] and PI methods which were usually developed for the evaluation of vulnerability in karstic aquifers. These distinctive techniques are offered under the type of numerical portion frameworks in view of the transaction of the diverse components influencing the hydrogeological framework [8] .
In HSB, DRASTIC method was applied previously; while it is very important to know that this model is reflecting the actual vulnerability system everywhere in the world and for this specific area as well or not. So the main aim of the current study as the first attempt on the region is to compare DRASTIC method of one more recommended model. COP model beside DRASTIC model was selected, because these two models can be applied for the region in terms of aquifer properties. In addition both models were using different rates and weight value of the applied parameters and different potential characteristic on vulnerability system such as aquifer properties, and unsaturated zone. And then, the results have to be validated, so for validation purpose nitrate concentration in groundwater was used, because this region is described by an arable territory due to its suitability for agriculture. Accordingly, the employments of fertilizers and pesticides are normal practices, so it influences the groundwater quality [9] . Normally, different types of inorganic chemical fertilizer were used in the studied area namely sodium nitrate and chemical compounds that contain nitrogen in amide form, [10] .
1.1. Study Area
Halabja Saidsadiq Basin is situated in the northeastern piece of Iraq between the latitude 35"00'00" and 35"36'00"N and the longitude 45"36'00" and 46"12'00"E (Figure 1). Ali [11] isolated this basin of two sub-basins including Halabja-Khurmal and Said Sadiq sub-basins. The entire area of both sub-basins is around 1278 square kilometers with populace of around 190,727 in mid 2015, [12] . As far as climate, the territory portrayed by a particular mainland inside atmosphere with hot summers and cold winters of the Mediterranean sort with the normal yearly precipitation running from 500 to 700 mm. Around 57% of the contemplated territory is an arable zone because of its suitability for farming. Thusly, the employments of fertilizers and pesticides are normal practices, so it influences the groundwater quality [9] . Furthermore, the majority of the city wastewater from the urban areas of Halabja and Saidsadiq and all other sub-region locales inside of this basin invade into the groundwater consistently.
1.2. Geology and Hydrogeological Setting
In terms of geology, as stated by [13] , HSB is positioned inside the Western Zagros Fold-Thrust Belt. While in terms of Structural geology, it is situated inside the High Folded zone, Imbricated, and Thrust Zones [14] . Different geological formations were deposited in the area with geological age ranging from Jurassic to recent (Figure 2 and Table 1).

Figure 2. Geological map of study basin.

Table 1. Aquifer types in the HSB.
Permeability is the primary foremost calculates deciding the capability of the territory to be considered as a water bearing aquifer. The territory is portrayed by several distinctive hydrogeological aquifers because of vicinity of various geological units. The trademark components of the aquifers are classified in Table 1. From the gathered information about the field and those recorded in the chronicles of the Groundwater Dirctorate at Sulaimaniyah, the mountain arrangement encompassing the basin of the upper east and southeast, are portrayed by high profundity of groundwater. At the middle and the southeastern part, the groundwater level has a moderately bring down profundity. The movement towards groundwater is for the most part of high raised territories at the north and upper east and south and southeast towards southwest or for the most part toward the repository of Derbandikhan Dam (Figure 3).

Figure 3. Hydrogeological map of study basin.
Moreover, a few streams exist on the region, for example, Sirwan, Zalm, Chaqan, Biara, Reshen and Zmkan. Every one of these streams appropriates their water in Derbandikhan supply. There are a few springs inside of the basin (Figure 4). These springs can be arranged into three classes as indicated by their water release. The main group having discharged that is under 10 L/S, (for example, Anab, Basak, Bawakochak and 30 different springs). The second group having discharged of 10 to100 L/S, (for example, Sheramar, Qwmash, Khwrmal and Kani Saraw), lastly those have water discharge more than 100 L/S, (for example, Garaw, Ganjan, Reshen, Sarawy Swbhan Agha). Figure 4, clarify the local lineament highlights of the HSB [12] .
2. Methodology
2.1. Material and Source of Data
The required information about this assessment was gathered from the field and afterward from the records of the related association, for example, groundwater directorate

Figure 4. Map of standard DRASTIC model for the study basin.
in Sulaimaniyah City. Arc Map 10 programming was utilized to make the shape file of every layer. Nitrate concentration investigation used to confirm the proposed applied models. The required methodology to achieve the objective of this study clearly explained on Diagram 1.
2.2. Standard DRASTIC Model
The most appropriate, viable and generally utilized model to evaluate groundwater vulnerability to an extensive variety of potential contaminants is DRASTIC model. This model was created by Environmental Protection Agency (EPA) of the United States to sort out the contamination capability of aquifers [2] . DRASTIC model for the first time applied for HSB by [12] , so the final outcome of this model is utilized to compare it with the COP model.
2.3. COP Index Model
The COP shortened form originates from the three initials of variables in particular flow Concentration(C), Overlying layers (O) and Precipitation (P) [15] . The hypothetical premise of this strategy, as indicated by the European Approach [16] [17] , it is to assess the ordinary protection for groundwater (O variable) controlled by the properties of overlying soils and the unsaturated zone, and also to gauge how this assurance can be adjusted by diffuse, infiltration (C factor) and the climatic conditions (P Factor- precipitation). The COP-Index map can be computed from Equation (1):
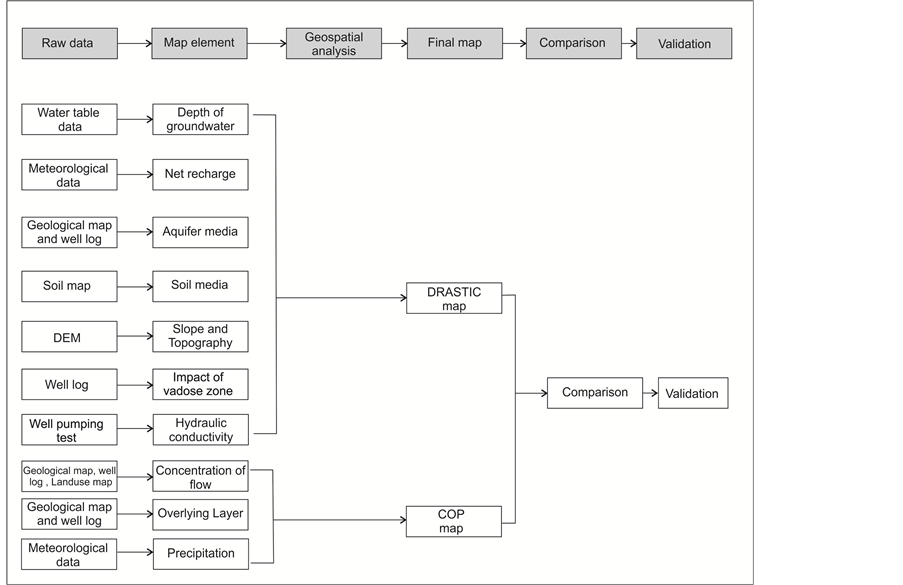
Diagram 1. Methodology processes applied in this study.
 [15] (1)
2.3.1. C-Factor
The C component is the reasonable for water to bypass the protection gave by the overlying layers [16] , or it is the concentration of flow maps and represents the sorts of infiltration happening to the catchment. It implies the extent to which precipitation at or close to the outcrop of the aquifer is gathered into an intergranular media, swallow gap and fissured rocks bypassing the vadose zone. This is set up from the EPIK technique [6] and the PI strategy [18] . In the COP strategy, the catchment range is for two primary zones; the first zone (Scenario 1) contains the revive territory of karst elements specifically sinkholes. The second zone (Scenario 2) comprises of a range where no surface karst elements were recognized. In the present study, the second situation connected to compute the C component because of absence of the swallow opening. The C Factor computed in view of Equation (2), from [15] :
 (2)
(2)
where, sf is the surface feature and sv is the slope and vegetation.
The Surface features’ parameters incorporates those geomorphological elements particular to carbonate rocks and the vicinity or nonappearance of any overlying layers (porous or impermeable), which decide the significance of runoff and/or infiltration progressions. Vegetation and slope derivatives from [15] and the assessment is entirely unique in relation to that in Scenario 1, since when slopes are more extreme and vegetation is mislaid; surface runoff or contaminant flow far from the aquifer. This circumstance is regular on the slopes of carbonate aquifers in mountainous regions in HSB.
2.3.2. O-Factor
The O factor encapsulates the overlying layers over the saturated zone, and it considers the protection provided for the aquifer by the physical properties and thickness of the layers. This factor partitioned into four subdivisions by [16] specifically topsoil, subsoil, nonkarstic rocks and unsaturated karstic rocks. In terms of hydrogeological roles, so as to evaluate the O component, Soils (OS) and the lithological layers of the unsaturated zone (OL) are used in the proposed COP method. The O-factor computed based on Equation (3):
 [15] (3)
(OS) signifies the soil character, including texture, grain size and thickness of the soil cover. The thicker the soil cover, the higher the likelihood of contaminant reduction. The OS sub-factor increases from increasing thickness and fining soil texture designating a low vulnerability.
(OL) is the lithology sub-factor which is reflecting the reduction capability of each layer within the unsaturated zone. The valuation principles of its quantification are the rock nature (mostly effective porosity and hydraulic conductivity) and the scale of fracturing (ly), the thickness of each layer (m) and every confining condition (cn) [15] . Consecutive summing of the products of the multiplication of thickness and lithology of each layer, give up an index which is connected with the protection (Layer index = ∑(ly∙m)). The confining condition parameter (cn) is a weighting coefficient for the layer index. The values allocated to the (cn) parameter provide the highest shield to the confined aquifer while an unconfined aquifer is not affected by this parameter (cn = 1), [15] .
The value of O-Factor decreases when the outcrop materials are composed of carbonate and the soil is absent or poorly developed and it signifies high vulnerability. While, with high or moderate protection then the value of O-Factor for subsurface material increase as a result of high degree of protection and presence of soil or low permeable materials or lithology.
2.3.3. P-Factor
P-Factor as clarified by [16] contains the measure of precipitation and factors that are influence the rate of penetration, for example, temporal distribution, duration, frequency and intensity of energizing precipitation occasions. The capacity of precipitation to transport a contamination towards the groundwater can be dictated by this factor; vulnerability increment as the capacity of transportation expanded. The P factor is assessed by two sub-factorses, Quantity of precipitation (PQ) and temporal distribution of precipitation (PI). The (PQ) sub-factor depicts the impact on precipitation quantity and the yearly recharge on groundwater vulnerability. Vulnerability increment as protection reduced and recharge increased too.
The (PI) sub-factor is identified with the temporal distribution of precipitation in a specific timeframe and in this way is uncovering of the intensity of precipitation. For the estimation of this sub-factor, two variables are to be considered for a wet year, the mean yearly precipitation and the quantity of rainy days. Along these lines, that values allocated to the (PI) sub-factor is more prominent with higher total of yearly precipitation and lower number of rainy days. These outcomes of bigger amounts of recharge that empowers rapid infiltration through fissures or karst channels, along these lines expanding groundwater vulnerability. The more noteworthy the rainy day, the more prominent the measures of runoff towards swallow gaps that support concentrated infiltration. Where infiltration is diffuse and moderate, the (PI) sub-factor is low; ordinarily in such conditions, the volumes of recharge are similarly small. Higher estimations of the P component indicate a lower effect on the level of protection gave by the O factor. However lower values demonstrate that precipitation, as a function of quantity and intensity decreases the protection managed by the O factor and increases groundwater vulnerability.
3. Result and Discussion
3.1. Standard DRASTIC Model
Figure 4 demonstrates the standard DRASTIC Vulnerability model of HSB which was built by [12] with four classes of vulnerability including (very low, low, moderate and high). The model clearly shows the strength of moderate and low vulnerability zones, which occupy an area of (48% and 34%) of the entire region respectively. As far as the geological and hydrogeological conditions, moderate vulnerability zone covered two different areas. The first are the mountains encompassing HSB that incorporates the fissured and karstic aquifer. While the second region, is included Quaternary deposits covering the southwest part of the area (encompassing the zone of Derbandikhan reservoir). This may be identified with the high water table level and high rate of coarse grain material, for example, rock, sand and rock fragments. Besides, the zone with low vulnerability is considered as the third rate class as far as spreading, possesses 166 km2 or 13% of the general surface region of the basin. The zone with high vulnerability covers just 64 km2 or 5% of the aggregate territory and is situated in the center of the basin. This territory is described by a moderately high water table level and vicinity of a few springs with cracked limestone.
3.2. Assessment of COP Model
3.2.1. C-Factor Map
To map the C-Factor, it is required to construct sf and sv maps as mentioned previously. The required data onto both sf and sv maps were extracted from land use and land cover, geological and soil maps. sf map was constructed and weighted based on [15] . Slope was extracted from the Digital Elevation Model (DEM) in percent, and reclassified into 4 categories (≤8%, 8 < S< 31, 31 < S < 76, and >76), which were assigned weights accordingly for constructing sv map. Surface feature, slopes and type of vegetation were assigned values as per Table 2.
The final C-map resulting from the multiplication of surface features and slope and vegetation indices Figure 5. Based on the result of C-score, the HSB classified in to three classes in terms of reduction of protection including (moderate, low and very low) of (0.56 - 0.6, >0.6 - 0.8 and >0.8 - 0.95) respectively.
3.2.2. O-Factor Map
The Os factor map was established based on the soil map of HSB and the field survey results from soil recognition and infiltration tests. Three main categories of Os factor are dominant in the HSB, the result presented in Table 3 and Table 4.
Table 2. Calculation of sf and sv sub-factors.
Table 3. Calculation of OS sub-factor.
Table 4. Calculation of OL sub-factors.

Figure 5. C-factor map for HSB.
The OL factor is the product of the layer index and the degree of confining condition (cn). In addition, the layer index is the product of lithology and fracturing value (ly) and the thickness of the unsaturated zone of each layer. Each formation was assigned a value of ly and cn as recommended by [15] . The confining conditions are recognized for each geological layer based on the impervious characters of overlying and underlying layers. The average depth to groundwater for each layer computed and is mainly illustrative of the thickness of the unsaturated zone under static conditions. Finally the O-Factor map created from the summation of both OL and Os sub-factors, Figure 6.
3.2.3. P-Factor Map
The P-Factor signifies the climatic conditions in the studied area. It is also calculated from the summation of two sub-factors (PQ and PI). Figure 7 describes the quantity and intensity of annually precipitation respectively. The average amount of yearly precipitation from (2001-2002) to (2013-2014) be (691, 2 mm/year) based on the analysis of precipitation data onto HSB achieved from Halabja Meteorological Station. The precipitation intensity is the ratio of the amount of precipitation to the number of rainy days. The number of rainy days in HSB for a mentioned period was about 63 days per year. The results of both PQ and PI were (0.3 and 0.4) respectively.

Figure 6. O-factor map for HSB.

Figure 7. P-factor map for HSB.
3.2.4. COP Index Map
The COP Index map for HSB computed by the multiplication of the three maps for each score namely C, O, and P using GIS software. The final map were reclassified according to the vulnerability classes as per the COP method, [15] .
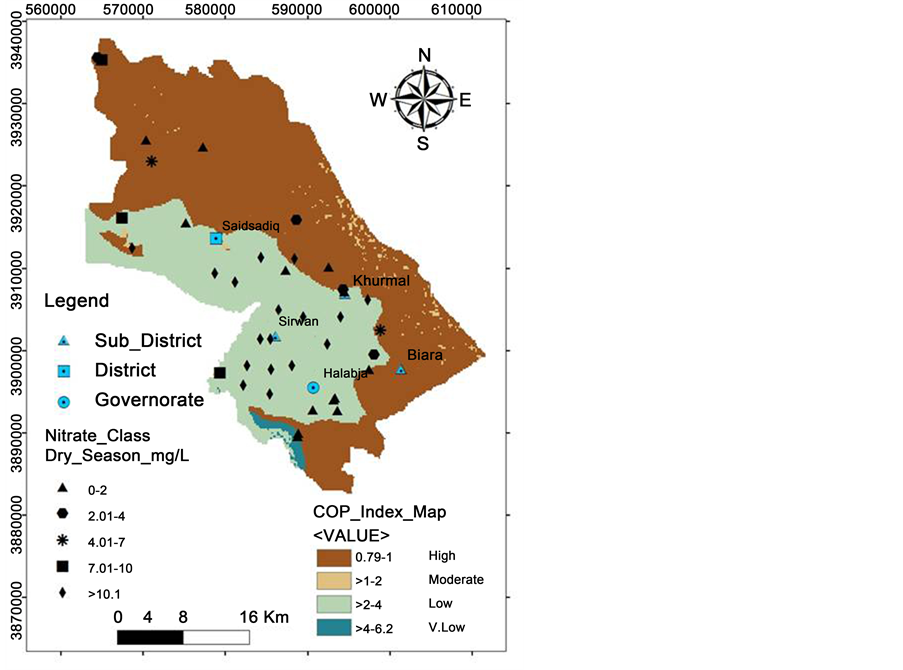
From Figure 8 based on the COP model, the area is alienated in to four vulnerability classes ranging from very low to high. The C factor appears to be an extremely influenced the final COP map. This is due to the fact that most of the HSB areas are characterized by a fissured and trivial karstic carbonate that has a slighter weighting value. High vulnerability zones which covered an area of 767 km2 or (60%) of the whole HSB, geologically includes the area of the fissured and slight karstic carbonate rocks of different ages. While, low vulnerability class comes in the second order, occupied 37% of the whole area (473 km2), which is mostly characterized by alluvial deposits. The zone with moderate and very low vulnerability classes covered only 25 and 13 km2 or 2% and 1% of the total area respectively.

Figure 8. COP index map for HSB.
3.3. Comparison of Both Models
The COP map of the HSB (Figure 8) shows high vulnerability throughout most South East and North West of the basin. In terms of geological formation, these areas are characterized by fissured carbonate rocks represented by Balamo, Kometan and Jurassic formations and fissured with a slightly karstic features represented by Avroman Formation, (Figure 2). Within fissured carbonate rocks, the O factor determines low value of protection and the C factor sets up higher vulnerability in range where infiltration processes are overwhelming as opposed to surface runoff. While based on the standard DRASTIC model , (Figure 4), the same areas were classified into moderate vulnerability represented by the fissured and low karstic formations (Balambo, Kometan and Avroman) formations and low vulnerability class symbolized by (Qulqula Formation). In addition, the central and south western parts of the basin, classified as low vulnerable zone according to COP result. This is related to the higher protection as the C-Factor recorded a high value. While most of the areas, was classified as “moderate vulnerability” based on the result of DRASTIC model. The area represents the inter-granular aquifer (Alluvial deposits). This is due to the low depth of water tables, gentle slope and highly porosity and permeability. These all factors lead to increase infiltration and recharge.
3.4. Validation of both Models
Each vulnerability map ought to be accepted after its development so as to gauge the legitimacy of the hypothetical thoughtful of current hydrogeological conditions [19] [20] . A few strategies can be connected to the approval for vulnerability evaluations [21] ; these incorporate hydrographs, chemographs and tracers (artificial or natural). With a specific end goal to approve both connected models at HSB, nitrate concentration had been chosen. Nitrate as a contamination pointer can be useful to perceive the advancement and changes of groundwater quality, since nitrate concentration ought to be increment in groundwater subsequent to raining season because of recharging of groundwater from precipitation. In this specific contemplated the case, the nitrate contrasts to two following seasons (dry and wet) were analyzed from (30) watering wells. The samples were gathered and examined toward the end of September 2014 for dry season and the end of May 2015 for wet season. The chosen wells for nitrate concentration analysis situated in all vulnerability zones atevery model.
In connection with nitrate values of dry season (nonappearance of precipitation for a long period), (Table 5), low nitrate levels were observed with concentration extending for zero to simply above 10 mg/l. While for the wet season, the nitrate concentration amazingly ascended to every used well. For accomplished DRASTIC vulnerability classes to be specific (very low, low, moderate and High), the common of nitrate concentration on dry season were (<2, 2 - 4, >10 and >10) mg/l respectively, Figure 9(a). While for the wet season the concentration was altogether higher up to (0 - 20, 20 - 30, >30 and >30) mg/l respectively, Figure 10(a). This condition is because of a few fundamental factors, for example, ascending to the water table in the wet season and vice versa for the dry season. Also, the effect of human action is critical to wet season, particularly because of employments of synthetic contaminants (nitrate) for agricultural purpose. As a final point, precipitation assumes a critical factor to transport nitrate taking into account particular state of vulnerability properties of the ground strata. Therefore, these impressive varieties of nitrate concentration on dry to wet seasons check the suitability of applying this model in HSB.
Table 5. Concentration of nitrate at each vulnerability class.
 (a) (b)
Figure 9. Models used ((a) for DRASTIC and (b) for COP) with nitrate concentration (dry season).
Furthermore, nitrate concentration again was applied for the verification of the COP model. Vulnerability classes realized by this model in HSB were (very low, low, moderate and high). The moderate and very low classes were occupied an insignificant area of HSB, and it does not have a scientific approach. The averages of nitrate concentration on dry season were (>10 and up to10) mg/l for low and high classes respectively (Figure 9(b)). Whereas for the wet season the concentration was considerably higher up to (>30) mg/l for both mentioned classes (Figure 10(b)).
Once more, these extensive variations in nitrate concentration on dry to wet seasons and the covered area of each class of each model, confirm the sensibility of the gradation and distribution of vulnerability levels acquired using the standard DRASTIC method than that obtained by the COP method. In addition, the DRASTIC outcome is more consistent with current hydrogeological understanding of HSB than COP model. For instance, the Qulqula Group which is classified to be an aquitard, due to presence of several impermeable layers, (Figure 2), This geological formation classified as a high vulnerable area by COP model and this is impossible due to presence of several impermeable layers, while by DRASTIC model it classified to be a very low vulnerable system which is quite sensible.

 (a) (b)
Figure 10. Models used ((a) for DRASTIC and (b) for COP) with nitrate concentration (wet season).
4. Conclusions
To evaluate the imminent vulnerability of groundwater contamination in the HSB, two distinct models (standard DRASTIC and COP) were connected to GIS environment. The DRASTIC vulnerability indexes values went somewhere around (63 and 191) while the COP indexes value ranged between (0.79 - 6.2). The higher index value of DRASTIC model means a higher vulnerability category while the lower COP indexes value means the higher vulnerability as well.
The vulnerability classes are elucidated in Table 6. Both model clarified only four vulnerability classes. The moderate and very low vulnerable covered areas by COP model constitute (2% and 1%) respectively of the basin while for DRASTIC model they occupied (48% and 34%) of the total studied area. Low and high classes covered (13% and 5%) with DRASTIC and (37% and 60%) for COP models respectively. Significant dissimilarity was noticed from both models in terms of covered areas. So, validation of vulnerability maps for both models becomes obligatory. Nitrate concentration analysis has been selected. Nitrate as a contamination pointer can be supportive to recognize the advancement and changes of groundwater quality. In this specific study cases, the concentration of nitrate contrasts to two following seasons (dry and wet) was examined
Table 6. Covered area for both models at HSB.

Figure 11. Comparison between vulnerability classes of both models using nitrate concentration.
from (30) watering wells. The outcome represents impressive varieties of nitrate concentration on dry to wet seasons. It can be reasoned that HSB is competent to receiving the contaminant because of suitability in the hydrogeological conditions.
Based on this verification and the covered area of each class, Figure 11 and Table 6 demonstrate that the degree and distribution of the level of vulnerability acquired using the standard DRASTIC method are more sensible than those attained from COP method.
Cite this paper
Abdullah, T.O., Ali, S.S., Al-Ansari, N.A. and Knutsson, S. (2016) Groundwater Vulnerability Using DRASTIC and COP Models: Case Study of Halabja Saidsadiq Basin, Iraq. Engineering, 8, 741- 760. http://dx.doi.org/10.4236/eng.2016.811067
References
- 1. Baghvand, A., Nasrabadi, T., Nabibidhendi, G., Vosoogh, A., Karbassi, A. and Mehradadi, N. (2010) Groundwater Quality Degradation of an Aquifer in Iran Central Desert. Desalination, 260, 264-275.
http://dx.doi.org/10.1016/j.desal.2010.02.038 - 2. Aller, L., Bennett, T., Lehr, J.H., Petty, R.H., and Hackett, G. (1987) DRASTIC: A Standardized System for Evaluating Groundwater Pollution Potential Using Hydrogeologic Setting. USEPA Report 600/2-87/035, Robert S. Kerr Environmental Research Laboratory, Ada, 252 p.
- 3. Foster, S (1987) Fundamental Concepts in Aquifer Vulnerability, Pollution Risk and Protection Strategy. In: Van Duijvenbooden, W. and Van Waegeningh, H.G., Eds., Vulnerability of Soil and Groundwater to Pollutants, Committee on Hydrological Research, The Hague, 69-86.
- 4. Van Stempvoort, D., Ewert, L. and Wassenaar, L. (1993) Aquifer Vulnerability Index (AVI): A GIS Compatible Method for Groundwater Vulnerability Mapping. Canadian Water Resources Journal, 18, 25-37.
http://dx.doi.org/10.4296/cwrj1801025 - 5. Civita, M. (1994) Le carte della vulnerabilita degli acquiferi all’inquinamiento: teoria e pratica [Contamination Vulnerability Mapping of the Aquifer: Theory and Practice]. Quaderni di Tecniche di Protezione Ambientale, Pitagora Editrice.
- 6. Doerfliger, N. and Zwahlen, F. (1998) Groundwater Vulnerability Mapping in Karstic Regions (EPIK)—Application to Groundwater Protection Zones. Swiss Agency for the Environment, Forests and Landscape (SAEFL), Bern.
- 7. Doerfliger, N., Jeannin, P.Y. and Zwahlen, F. (1999) Water Vulnerability Assessment in Karst Environments: A New Method of Defining Protection Areas Using a Multi-Attribute Approach and GIS Tools (EPIK Method). Environmental Geology, 39, 165-176.
http://dx.doi.org/10.1007/s002540050446 - 8. Attoui, B., Kherci, N. and Bousnoubra, H. (2012) State of Vulnerability to Pollution of the Big Reservoirs of Groundwater in the Region of Annaba-Bouteldja (NE Algeria). Geographia Technica, 1-13.
- 9. Huang, T., Pang, Z. and Edmunds, W. (2012) Soil Profile Evolution Following Land-Use Change: Implications for Groundwater Quantity and Quality. Hydrological Processes, 27, 1238-1252.
http://dx.doi.org/10.1002/hyp.9302 - 10. Statistical Directorate in Sulaimaniyah (2014) Archive Department.
- 11. Ali, S.S. (2007) Geology and Hydrogeology of Sharazoor-Piramagroon Basin in Sulaimani Area, Northeastern Iraq. Unpublished PhD Thesis, Faculty of Mining and Geology, University of Belgrade, Serbia, 317 p.
- 12. Abdullah, T.O., Ali, S.S., Al-Ansari, N.A. and Knutsson, S. (2015) Effect of Agricultural Activities on Groundwater Vulnerability: Case Study of Halabja Saidsadiq Basin, Iraq. Journal of Environmental Hydrology, 23, 1-20.
http://www.hydroweb.com/protect/pubs/jeh/jeh2015/AnsariGW.pdf - 13. Buday, T. and Jassim, S. (1987) The Regional Geology of Iraq: Tectonis, Magmatism, and Metamorphism. In: Kassab, I.I. and Abbas, M.J., Eds, Stratigraphy, State Establishment of Geological Survey and Minieral Investigations, Baghdad, 1-445.
- 14. Buday, T. (1980) Regional Geology of Iraq: Vol. 1, Stratigraphy. DG Geological Survey and Minieral Investigations Publication, 445 p.
- 15. Vias, J.M., Andreo, B., Perles, M.J., Carrasco, I., Vadillo, P. and Jimenez, P. (2006) Proposed Method for Groundwater Vulnerability Mapping in Carbonate (Karstic) Aquifers: The COP Method. Application in Two Pilot Sites in Southern Spain. Hydrogeology Journal, 14, 912-925.
http://dx.doi.org/10.1007/s10040-006-0023-6 - 16. Daly, D., Dassargues, A., Drew, D., Dunne, S., Goldscheider, N., Neale, S., Popescu, C. and Zwhalen, F. (2002) Main Concepts of the “European Approach” for (Karst) Groundwater Vulnerability Assessment and Mapping. Hydrogeology Journal, 10, 340-345.
http://dx.doi.org/10.1007/s10040-001-0185-1 - 17. Goldscheider, N. and Popescu, C. (2004) The European Approach. In: Zwahlen, F., Ed., Vulnerability and Risk Mapping for the Protection of Carbonate (Karst) Aquifers, European Commission, Brussels, 17-21.
- 18. Goldscheider, N., Klute, M., Sturm, S. and Hotzl, H. (2000) The PI Method a GIS—Based Approach to Mapping Groundwater Vulnerability with Special Consideration of Karst Aquifers. Zeitschrift fur Angewandte Geologie, 46, 157-166.
- 19. Bruyere, S., Jeannin, P.Y., Dassargues, A., Goldscheider, N., Popescu, C., Sauter, M., Vadillo, I. and Zwahlen, F. (2001) Evaluation and Validation of Vulnerability Concepts Using a Physically Based Approach. 7th Conference on Limestone Hydrology and Fissured Media, Besançon, 20-22 September 2001, 67-72.
- 20. Perrin, J., Pochon, A., Jeannin, P.Y. and Zwahlen, F. (2004) Vulnerability Assessment in Karstic Areas: Validation by Field Experiments. Environmental Geology, 46, 237-245.
http://dx.doi.org/10.1007/s00254-004-0986-3 - 21. Zwahlen, F. (Ed.) (2004) Vulnerability and Risk Mapping for the Protection of Carbonate (Karst) Aquifers. Final Report (COST Action 620) European Commission, Brussels.