Engineering
Vol. 4 No. 2 (2012) , Article ID: 17416 , 7 pages DOI:10.4236/eng.2012.42009
Stress Concentrations for Slotted Plates in Bi-Axial Stress
School of Engineering and Design, Brunel University, London, UK
Email: David.Rees@brunel.ac.uk
Received July 12, 2011; revised October 2, 2011; accepted October 10, 2011
Keywords: Stress Concentration; Photoelasticity; Isochromatics; Finite Elements; Vertical and Horizontal Slots; Bi-Axial Stress
ABSTRACT
The photo-elastic method has been employed to determine stress concentration factor (SCF) for square plates containing holes and inclined slots when the plate edges are subjected to in-plane tension combined with compression. Analyses given of the isochromatic fringe pattern surrounding the hole provides the SCF conveniently. The model material is calibrated from the known solution to the stress raiser arising from a small circular hole in a plate placed under biaxial tension-compression. These results also compare well with a plane stress FE analysis. Consequently, photo-elasticity has enabled SCF’s to be determined experimentally for a biaxial stress ratio, nominally equal to –4, in plates containing a long, thin slot arranged to be in alignment with each stress axis. The two, principal stresses lying along axes of symmetry in the region surrounding the notch are separated within each isochromatic fringe by the Kuske method [1]. FE provides a comparable full-field view in which contours of maximum shear stress may be identified with the isochromatic fringe pattern directly. The principal stress distributions referred to the plate axes show their maximum concentrations at the notch boundary. Here up to a fourfold magnification occurs in the greater of the two nominal stresses under loads applied to the plate edges. Thus, it is of importance to establish the manner in which the tangential stress is distributed around the slot boundary. Conveniently, it is shown how this distribution is also revealed from an isochromatic fringe pattern, within which lie the points of maximum tension and maximum compression.
1. Introduction
It is well known that small holes and slots raise the stress in loaded plates locally by factors of 3 or 4. Clearly this becomes important to an assessment of fatigue life when, in localised regions of high stress, cyclic loading accelerates the crack initiation process. The various design rules [2,3] require the SCF to be known but often estimates are made for unusual geometries. The problem of crack initiation from holes and slots is important to understand for ensuring the safety of many structures bearing load. The prediction of cyclic life is possible when the stress raiser is quantified with a stress intensity factor. The finite element technique has been used [4-6] to estimate stress concentration factors in various engineering components where fatigue cracks occur. Holes and slots are less severe than pre-existing cracks but are always present in designs involving fittings, sharp radii, connections and attachments [7-12]. Here, in common with much of the early work on quantifying stress raisers [13-15], we shall examine the influence of slots experimentally by the photo-elastic method. Firstly, the technique adopted is verified by two alternative methods: 1) from the analytical solution to the stress concentration around a hole in a bi-axially stressed plate and 2) from a numerical FE simulation. Both methods 1) and 2) can provide the contours of maximum shear stress in the surrounding material which photoelasticity reveals within its isochromatic fringe pattern. The shear stresses are separated into major and minor principal stresses along axes of symmetry and around the notch boundary in providing agreement between the three methods. Thereafter, a slot is arranged to lie parallel to each of the perpendicular stress axes in turn to establish the severity of its concentration experimentally from photoelasticity. The degree of stress concentration (SC) is revealed from locating points of maximum tension and compression around the notch boundary.
Overall, the scope of this study is to provide SCF’s for a slot with aspect ratio of 5 (nominally) in fixed orientations to various in-plane biaxial stress states. Here the present investigation quantifies SCF’s for slots with vertical and horizontal dispositions in a stress field for which tension is combined with compression. The information given provides for the apparent omission of this geometry in the library of published SCF available for a multitude of alternative geometries [3]. The slot orientation effect in plates loaded in biaxial tension is presently under investigation.
2. Experimental
Holes and slots 1.0 mm wide and with a maximum length dimension of 2a = 6.2 mm were milled into the centre of Makralon and araldite CT 200 photoelastic sheets. Two methods of bi-axial loading square testpieces were employed [16]: 1) by installing 75 mm squares of 2 mm thick Makralon diagonally within a shear linkage frame and 2) applying independent, perpendicular forces to the 120 mm sides of 1.25 mm thick, CT 200 squares using hydraulic jacks. For the jacks, the bi-axial stress ratio Q, within the 75 mm square, un-gripped area, was positive and adjustable between 0 (uni-axial tension) and 8.
The shear linkage frame (reported here) was loaded in tension along the square’s vertical diagonal, thereby inducing compression along its horizontal diagonal. Figure 1 shows the square testpiece with its central hole and slot details. These were machined to the tolerances shown from 2 mm Photostress sheet supplied by Budd Inc., USA. The link assembly provided a central stress ratio Q = σx/σy = –3.8 in which the co-ordinates x and y are aligned with the square’s horizontal and vertical diagonals. Q is the negative, central principal stress ratio that applies in the absence of a notch. The compressive stress induced across the horizontal diagonal was increased by the stated ratio (i.e. σx = Qσy = –3.8 σx from the contacts made along the four sloping sides. In the frame four equal length links were allowed to rotate upon their 12 mm diameter end connecting pins. A 2 mm groove machined along the inside of each link provided the register for a 75 mm square, Makralon photoelastic model containing the notch (either a hole or a slot) at its centre. Corners were chamfered for ease of assembly (see Figure 1). Fringe patterns were examined under both plane and circular polariscope arrangements using sodium vapour light. The plane polariscope provides a full stress field around the notch in the form of a combination of isochromatic and isoclinic fringe patterns which reveal, respectively, the principal stress magnitudes and their directions. In the circular polariscope, additional 1/4 wave plates are inserted to remove the isoclinics allowing the isochromatic fringes to appear unobscured. Along an isochromatic fringe the difference between the principal stresses is constant, i.e. it is a line of constant maximum shear stress. Because the principal stress lying normal to a notch boundary is zero, the isochromatic fringe pattern is sufficient to find the greatest concentration in the tangential principal stress around the hole directly. All that this requires is a fringe count around the hole or slot and its conversion to stress using the model material’s fringe stress coefficient. Dividing the greatest stress found from this by the nominal applied stress defines the stress concentration for the particular notch geometry.
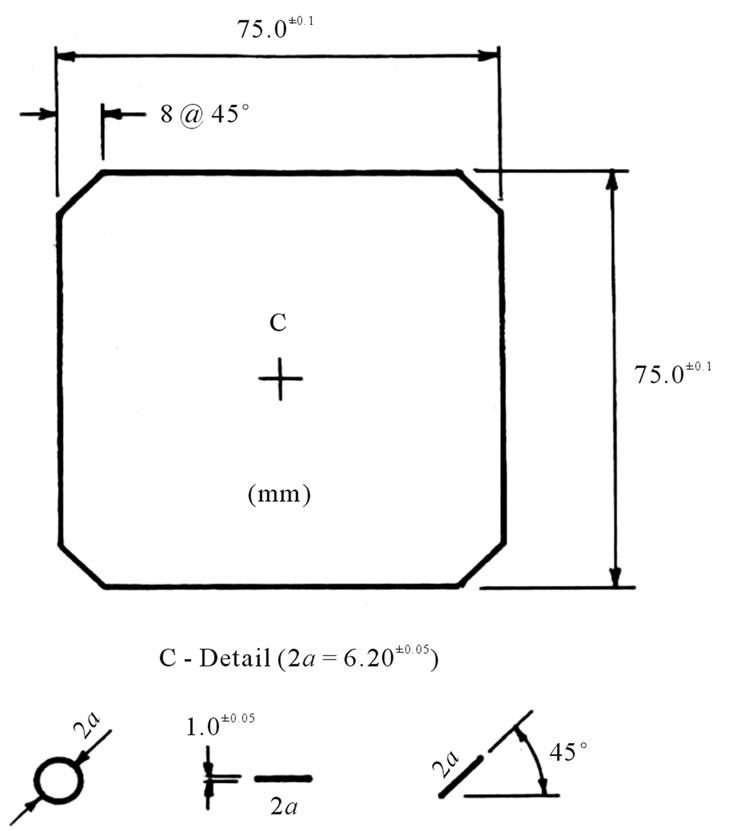
Figure 1. Geometry of slotted plates.
Isochromatic fringe patterns under a series of increasing loads were recorded with a Practica 35 mm SLR camera with bellows attachment for close-ups. Typical, 2 s exposures, at an aperture setting of f5.6 with Kodak 100 ASA film, are reproduced here as line diagrams. The shear frame’s stress ratio Q was found from loading an un-notched aluminium plate with a 0˚/90˚ strain gauge bonded to its centre. It will be seen that a more precise value of Q follows from the classical solution to the stress concentration arising from a hole in a plate under biaxial loading.
There are two coefficients used in photoelasticity to convert the fringe count (N, fringes) into a stress magnitude. The supplier provides a Material Fringe Stress Coefficient f, independent of the sheet thickness. The user adopts a Model Fringe Stress Coefficient F in which thickness is accounted for. Either coefficient is found from a calibration upon strips cut from the sheet in which the fringes are counted within a known stress field, usually from a simple tension test or a beam in four-point loading. In the former method a unit increase in the fringe number corresponds to an alternating light and dark fringe pattern when the tensile stress (= load/section area) is uniform under a purely axial load. A bending calibration is less prone to experimental error but the stress field varies linearly between maximum tension and compression corresponding to (say) a hogging beam’s top and bottom edges. With equal, maximum stress magnitudes the fringes are counted at one edge where the stress is calculated from theory. Normally, the gradient of a plot between calculated stress (in MPa) and the fringes count N (= 1, 2, 3 etc.) provides F directly, from which f = Ft. Here a tension test conducted upon a parallel strip of test material between the polariser and analyser revealed a Material Fringe Stress Coefficient f = 13.9 N/mm/fringe [16]. For a 2 mm thick plate, this gives a Model Fringe Stress Coefficient F = f/t = 6.95 MPa/ fringe. Hence F allows a direct conversion of an isochromatic fringe count at any point in the model to stress. As the latter corresponds, generally, to the difference between principal stresses p and q at a point, the photoelastic technique requires further analyses to separate p from q. Conveniently, no such separation is necessary for fringe counts at points upon boundary points where one principal stress is known to be zero.
3. Analyses
3.1. Photoelasticity
For a model of thickness t, photo-elasticity theory [13-15] gives the magnitude of the difference between the principal stresses p and q
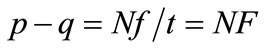 (1)
(1)
where it is seen that the model stress coefficient F = f/t (MPa/fringe) provides a direct conversion from a numerical fringe order value N to the magnitude of the principal stress difference. The special principal stress symbols p and q that appear universally in photoelastic analyses identify here with the hoop and radial stress around a slot boundary and along axes of symmetry.
3.1.1. Hole and Slot Boundary
Counting the fringe order N around a notch boundary allows the major principal (tangential) stress p and the maximum stress concentration S to be found directly from F. This is because the minor principal (radial) stress q is zero normal to the boundary. Equation (1) simplifies to give the boundary’s circumferential (or hoop) stress p = NF where N is counted around the notch boundary starting from the zero-order fringe location. In the Figures 1, 3 and 5 that follow the N = 0 location is shown to mark those boundary points at which there is an interchange between hoop tension and compression.
3.1.2. Axes of Symmetry
To find the stress distribution along the x, y axes of symmetry in the body of the plate, beyond the notch (a hole or slot), equi-spaced points n are taken along each axis. The fringe number N is then counted at radii rn from the centre of the notch, separated by Δr. These symmetry axes coincide with principal stress directions where the shear stress component is absent. For the calculation of p and q it is convenient to convert to polar co-ordinates (r, θ) at each point n upon the xand y-axes so that the principal stress difference becomes:
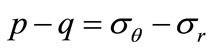 (2a)
(2a)
Using Kuske’s method [1], let σr increase by an amount δσr across a radial increment δr and apply the radial equilibrium equation [17] to positions n = 0, 1, 2,  This gives the gradient in σr as
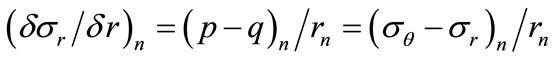 (2b)
(2b)
The incremental change (Δσr)n in σr between adjacent pairs of points n – 1 and n is estimated from the average of the their two gradients times their radial separation:
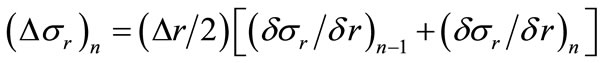 (3)
(3)
By placing n – 1 = 0 at a notch boundary, where σr = 0, the radial stress at “body” positions n = 1, 2,  follows from successive summations:
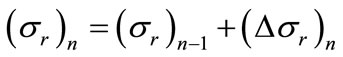 (4a)
(4a)
where (Δσr)n is given in Equation (3). The hoop stress follows from Equations (2a) and (4a) as
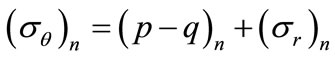 (4b)
(4b)
3.2. Finite Elements
The FE analysis of slotted plates was conducted using the Abaqus code [18]. Plane stress, iso-parametric elements (8-noded, quadratic type) were used to discretise the plate testpiece. The boundary conditions included a fixing of the left-hand side and bottom corners of the testpiece. In order to model the biaxial loading used in the experiment a compressive and a tensile load were applied to the testpiece’s corners in a similar ratio to those applied in the test rig. The Tresca equivalent stresses obtained from the FE analysis compare directly with the isochromatic fringe pattern from a photoelastic model as each provide the magnitude in the difference between the major and minor principal stresses. The sodium vapour light source sharpens the isochromatic fringe compared to the spread found from a white light source. The image emerges as a pattern of lines along which the stress difference is constant from point to point in the model.
4. Results
Recently, a number of solutions have appeared to the SCF’s in plates [19,20] thick cylinders [21], shells [22], valves [23], key-ways [24] rivets [25]. Since there remain no solutions available for the stress distributions in plates containing straight-sided, inclined slots, here we present time-honoured photoelastic analyses of their stress concentration factors. In contrast, we begin with the classical solution to the stress raising effect of a circular hole in a thin plate and compare this with alternative solutions from photoelasticity and finite elements. The good agreement found between the three approaches serves to support the experimental method adopted for each slot analysis and the accuracy of the stress concentration factors it provides.
4.1. Central Hole
4.1.1. Stress Ratio at Hole Boundary
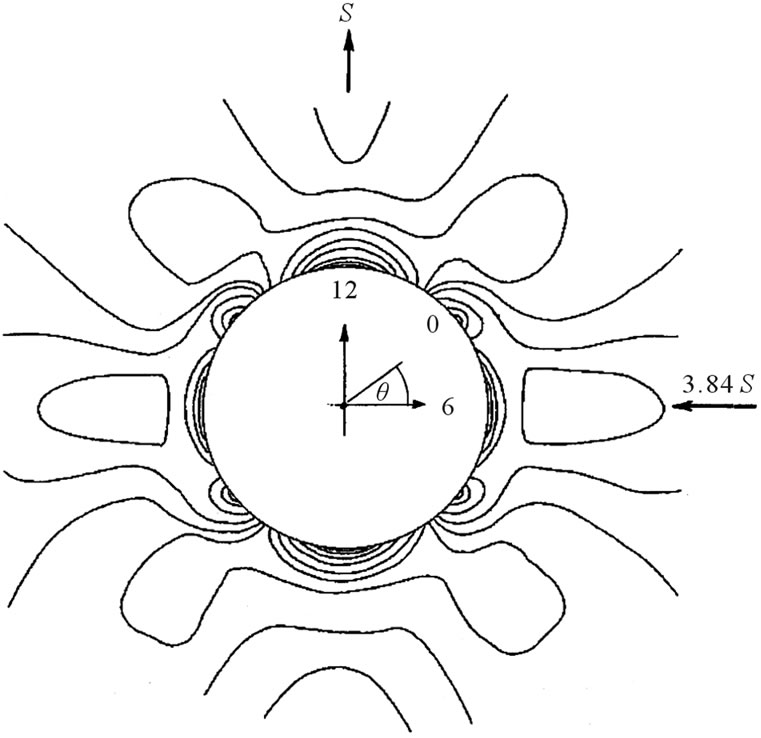
The shear frame’s linkages apply a vertical tensile force in combination with horizontal compressive force to the diagonals of a square plate. Here it needs to be recognised that these remote forces produce compressive and tensile stresses at the respective vertical and horizontal positions upon the boundary of a hole located at the centre of the plate. This means that a hole elongates in the direction of tension putting its North and South points under compression and its East and West under tension. Figure 2(a) shows an isochromatic fringe pattern when a vertical tensile force (the y-direction) is applied to the frame. Here, the fringe count shows a nominal ratio between maximum compression (θ = 90˚) and maximum tension (θ = 0˚) of σ90/σ0 = –2. This hoop stress ratio applies to each angular position within the hole’s boundary. An average stress ratio of σ90/σ0 = –1.83 was found from fringe patterns under numerous loads when fractional order fringes were accounted for. Elasticity theory [26] relates this ratio to the remote biaxial stress ratio Q = σx/σy imposed by the frame:
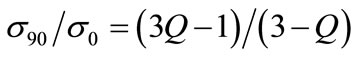 (5)
(5)
when σ90/σ0 = –1.83, Equation (5) shows Q = –3.84. To check Q, an un-notched 2 mm thick aluminium alloy plate replaced the testpiece having 0˚/90˚ strain gauges bonded at its centre in alignment with the plate’s x, y-diagonals. When a state of plane stress is assumed the stress ratio Q at the plate centre becomes [17]:
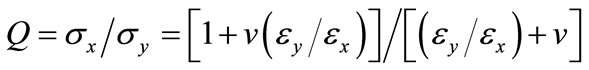 (6)
(6)
Under an increasing vertical load, the 0˚/90˚ strains responded linearly in a constant ratio εy/εx = –0.561, in which εy is positive and εx is negative. Substituting into Equation (6) with v = 1/3 gives Q = –3.53, which is in acceptable agreement with Q found from Equation (5).
4.1.2. Hoop Stress Variation within Hole Boundary
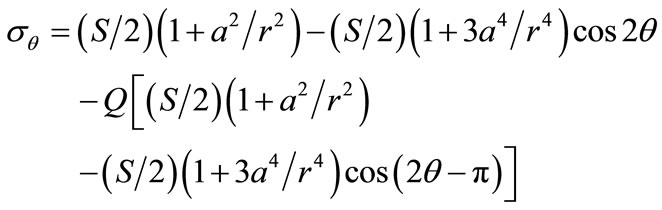
The hoop stress variation measured around the hole is shown in Figure 2(b). It is established quite simply from applying σθ = NF to the fringe count around the hole. The variation found is seen to agree fairly well with the theoretical stress-function prediction [26]:
 (a)
(a)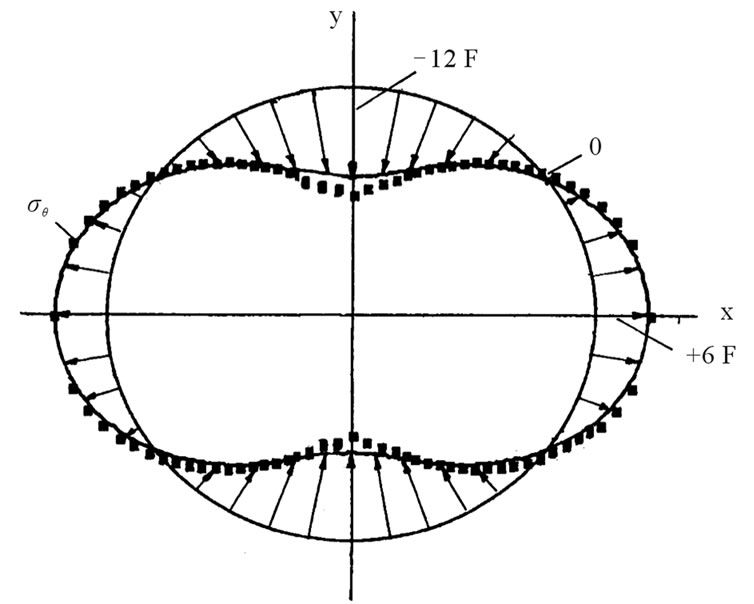 (b)
(b)
Figure 2. (a) Isochromatic fringe pattern around a hole; (b) Boundary hoop stress variation within a hole.
 (7)
(7)
where S = σy is the “applied” tensile stress. The latter is found from dividing the applied load by the area of the plate section through its horizontal diagonal. The “applied”, horizontal compressive stress follows as QS = σx.
4.1.3. Principal Stress Distributions
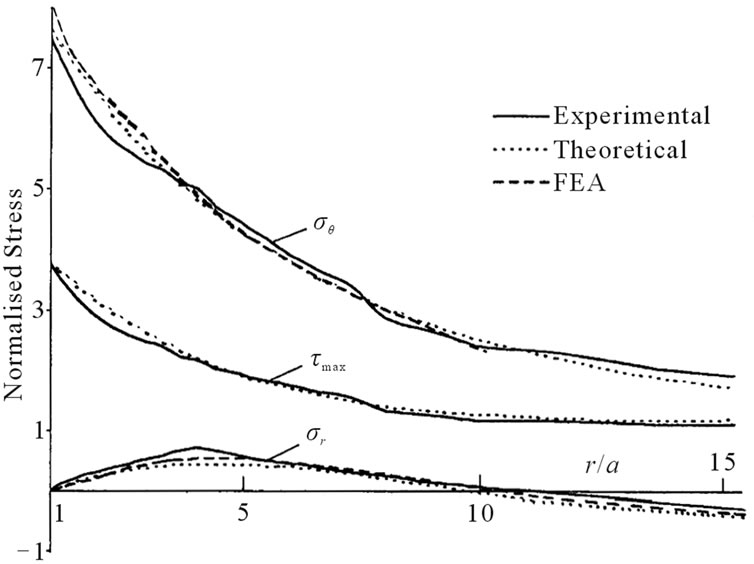
Separating p from q by the method outlined above in para (3.1), provides the principal stresses along the x, y axes of symmetry (Figures 3(a) and (b) apply with a common legend). The experimental distributions shown here agree well with FE predictions and the stress function solution to this problem [17]:
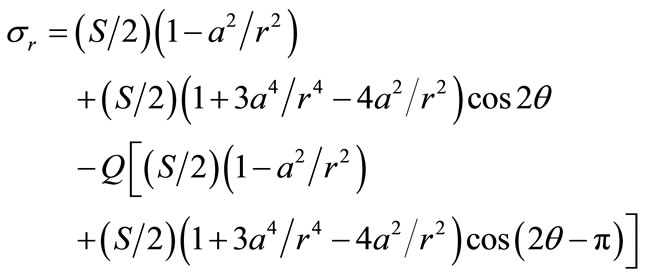 (8a)
(8a)
 (8b)
(8b)
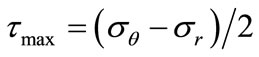 (8c)
(8c)
where a is the hole radius. The stress ordinates in Figures 3(a) and (b) are normalised with the remote stress S to show that two maximum stress concentration factors (SCF) arise at x and y on the boundary under an applied stress ratio Q = –3.84. The greater of these occurs in com-
 (a)
(a)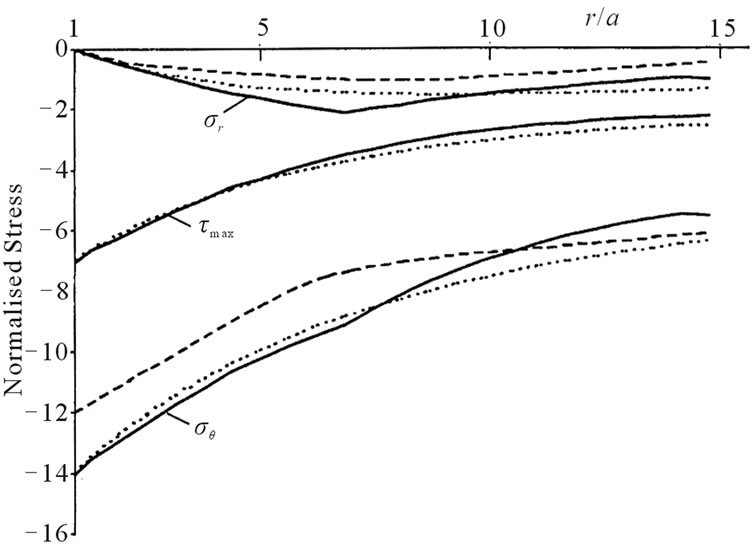 (b)
(b)
Figure 3. (a) S-Normalised stress distributions for hole’s x-axis; (b) S-Normalised stress distribution for hole’s y-axis.
pression with SCF = 14/3.84 = 3.65.
Given its validation from within (a), (b) and (c) above, we may now use photoelasticity to determine stress distributions where a theoretical solution is unavailable. In particular, slots 6.2 mm long × 1 mm wide, in alignment with the yand x-directions, will replace the hole at the testpiece centre. Correspondingly, the following vertical and horizontal slot analyses apply.
4.2. Vertical Slot
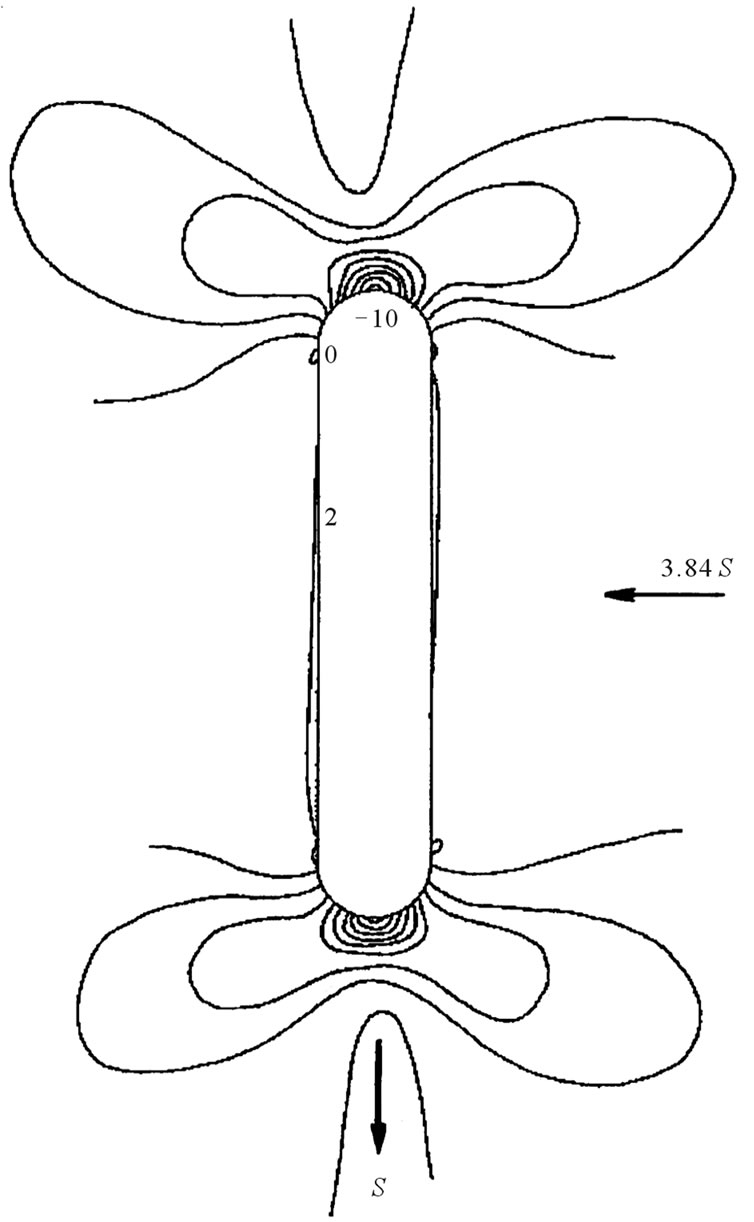
Figure 4(a) shows the isochromatic pattern around a vertical slot subjected to a similar remote biaxial stress ratio Q = –3.84 from loading in the shear frame. The boundary hoop stress variation σθ = NF, as derived from the fringe count N, is shown in Figure 4(b). This reveals a ratio of σ90/σ0 = –5 between the maximum compressive and tensile stresses. Separating the principal stresses beyond the slot, along the more highly stressed y-axis, leads to the distribution shown in Figure 5. Each stress component: radial, hoop and maximum shear, has a distribution similar to the y-distributions for a circular hole in Figure 2(b). Away from the slot ends, stress components fall off rapidly to attain the ratio that prevails in the absence of the notch. The slot magnifies these by a normalised stress concentration factor and here it is seen that, along its y-axis, the slot is more severe than the hole. That is, the greater applied compressive stress is magnified by a factor of SCF = 15.62/3.84 = 4.07 compared to 3.65 for the hole.
4.3. Horizontal Slot
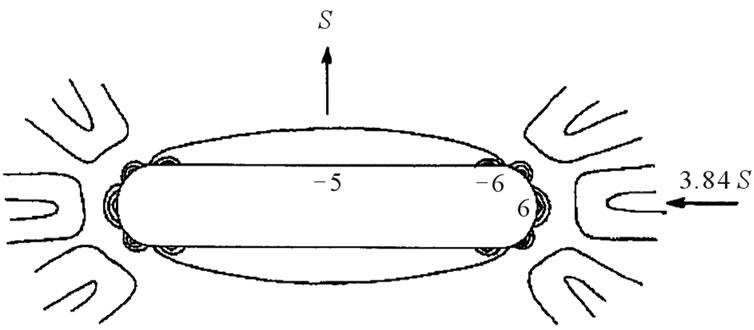
Figures 6(a) and (b) shows the isochromatic fringe pattern around a horizontal slot subjected to Q = –3.84 within the shear frame. A load identical to that applied to the vertical slot was used. The fringe count N reveals the boundary hoop stress variation σθ = NF, as shown in Figure 6(b). Maximum hoop tension σθ = 6F occurs along the x-axis. A maximum compression of equal magnitude occurs along the straight sides close to the point where the end radius begins. Elsewhere, compression along the straight edge is of a lesser magnitude σθ = 5F, giving a tension/compression axis stress ratio of –1.2. Separating the principal stresses beyond the slot ends along the x-axis, leads to the distribution shown in Figure 7. Each of the three stress components shows a normalised distribution, similar to the stress distribution for the x-axis of a hole (see Figure 3(a)). Moreover, the stress concentrations at the x-axis boundary of a hole and at the end of a horizontal slot are comparable. Their SC’s are, respectively: 7.65/3.84 = 2 and 9.37/3.84 = 2.44. However, a comparison between Figures 5 and 7 shows that a slot with a vertical orientation, giving SC = 4.07, is far more severe in concentrating hoop stress within its boundary.
 (a)
(a)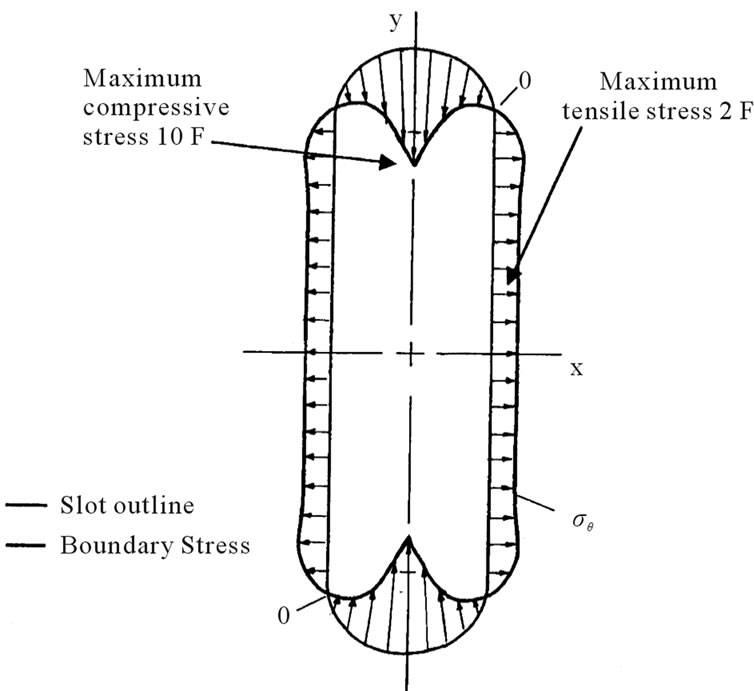 (b)
(b)
Figure 4. (a) Isochromatic fringe pattern around a vertical slot; (b) Boundary hoop stress variation within a vertical slot.
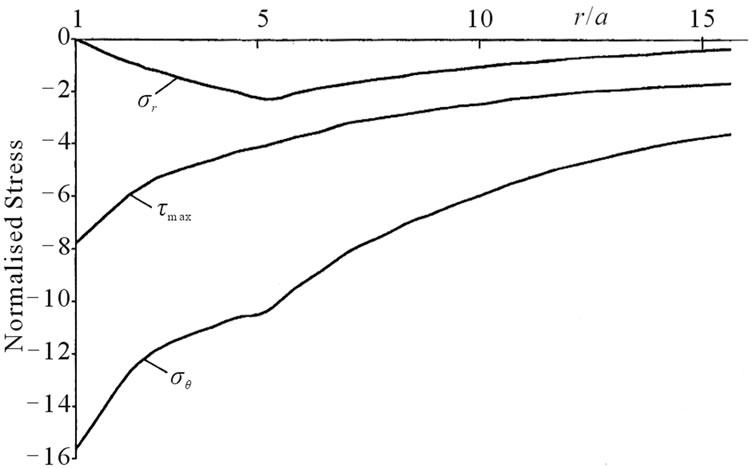
Figure 5. S-Normalised stress distributions for vertical slot’s y-axis.
 (a)
(a)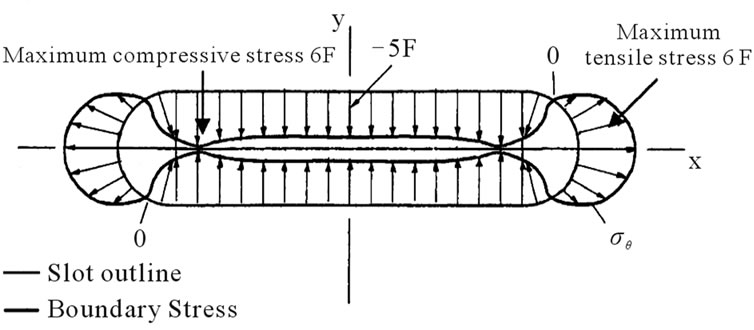 (b)
(b)
Figure 6. (a) Isochromatic fringe pattern around a horizontal slot; (b) Boundary hoop stress variation within a horizontal slot.
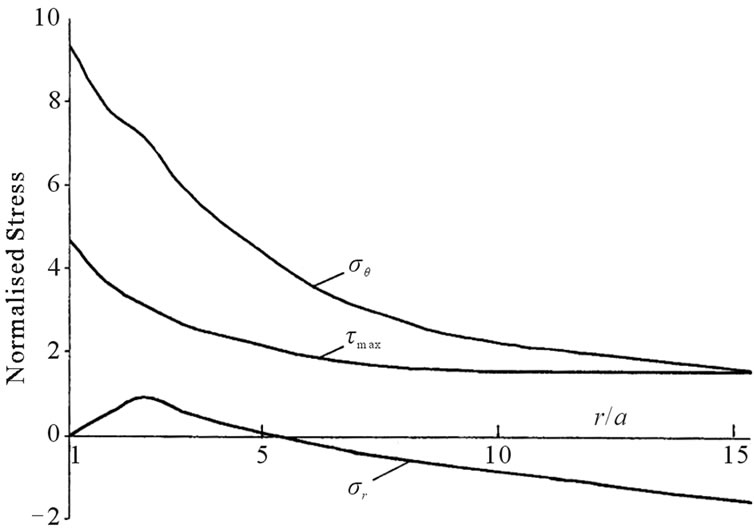
Figure 7. S-Normalised stress distributions for horizontal slot’s x-axis.
5. Conclusion
This photoelastic technique applied here confirms FE predictions where the former has been shown to agree with the analytical solution to the known stress concentration arising from a hole in a plate. The model material Makralon is calibrated previously within the photoelastic bench from the simpler plane geometry of a strip in tension, as used here, or for a beam in four-point bending. Following its validation, this preliminary study shows that photo-elasticity is a useful experimental technique for providing a full stress field around slots subjected to bi-axial loadings. In particular, when slots are aligned with applied stress axes their straight boundaries distribute tangential stress uniformly in tension and compression. A maximum concentration in stress usually occurs within the end radii, their precise positions depending upon the slot orientation.
REFERENCES
- A. Kuske, “Photoelastic Stress Analysis,” Wiley, Hoboken, 1974.
- H. Neuber, “Theory of Notch Stresses,” J. W. Edwards, Ann Arbor, 1946.
- W. D. Pilkey and R. E. Peterson, “Stress Concentration Factors,” 2nd Edition, Wiley, Hoboken, 1997. doi:10.1002/9780470172674
- H. Bahai, “A Parametric Model for Axial and Bending Stress Concentration Factor within API Drill-String Threaded Connectors,” International Journal of Press Vessel and Piping, Vol. 78, No. 7, 2001, pp. 495-505. doi:10.1016/S0308-0161(01)00060-6
- D. Tranxuan, “Optimum Fillet Radius for a Latch,” Computers and Structures, Vol. 46, 1996, pp. 645-650. doi:10.1016/0045-7949(96)00042-9
- L. Susmel and D. Taylor, “Fatigue Design in the Presence of Stress Concentrations,” Journal Strain Analysis for Engineering Design, Vol. 38, No. 5, 2003, pp. 443-452. doi:10.1243/03093240360713496
- ESDU 85045, Stress Concentrations: Interaction and Stress Decay for Selected Cases, London, 1985.
- K. Linda and T. Uemura, “Stress Concentration Factor Formulae Widely Used in Japan,” Fatigue and Fracture of Engineering Materials and Structures, Vol. 19, No. 6, 1996.
- N. T. Younis, “Assembly Stress for the Reduction of Stress Concentrations,” Mechanical Research Communications, Vol. 33, No. 6, 2006, pp. 837-845. doi:10.1016/j.mechrescom.2006.03.007
- R. Ortega, H. Sbuttoni, L. Boccanera, E. Passquali and G. Viau, “Stress Concentration Effect on Industrial Components,” Journal of Failure Analysis and Prevention, Vol. 10, No. 6, 2010, pp. 508-514. doi:10.1007/s11668-010-9380-5
- R. Lovic, S. M. Tipton and J. R. Sorem, “Multi-Axial Stress Concentrations in Filleted Shafts,” Journal of Machine Design, Vol. 123, No. 2, 2001, pp. 300-303.
- C. Walenta, “Finding Stress Concentrations in Brackets,” Machine Design, Vol. 66, No. 23, 1994, pp. 128-135.
- R. B. Heywood, “Designing by Photoelasticity,” Chapman and Hall, London, 1952.
- G. S. Hollister, “Experimental Stress Analysis—Principles and Methods,” Cambridge University Press, Cambridge, 1967.
- A. W. Hendry, “Photoelastic Analysis,” Pergamon, Berlin, 1966.
- S. Taylor, “Photoelastic Examination of Stress Concentration,” Project Report, Brunel University, Brunel, 1999.
- D. W. A. Rees, “Mechanics of Solids and Structures,” Imperial College Press, World Scientific, 2000.
- ABAQUS Standard 5.8 User Manual, HKS Inc., Dallas, 1998.
- M. Mohammadi, J. R. Dryden and L. Y. Jiang, “Stress Concentrations around a Hole in a Radially Inhomogenous Plate,” International Journal of Solids and Structures, Vol. 48, No. 3-4, 2011, pp. 483-491. doi:10.1016/j.ijsolstr.2010.10.013
- J. Rezaeepazhand and M. Jafari, “Stress Concentrations in Metallic Plates with Special Shaped Cut-Outs,” International Journal of Mechanical Sciences, Vol. 52, No. 1, 2010, pp. 96-102. doi:10.1016/j.ijmecsci.2009.10.013
- T. Comlekei, D. Mackenzie, R. Hamilton and J. Woods, “Stress Concentrations at Radial Cress-Bores in Pressurised Thick Cylinders,” Journal of Strain Analysis for Engineering Design, Vol. 42, No. 6, 2007, pp. 461-468. doi:10.1243/03093247JSA251
- Z. Kalenovic, “Investigation of Stress Concentrations in Cylindrical Shells with Polygonal Holes,” Strojarstvo, Vol. 45, No. 1-3, 2003, pp. 25-33.
- E. A. Badr, “Stress Concentration Factors for Pressurised Elliptic Cross-Sections in Blocks,” International Journal of Press Vessel and Piping, Vol. 83, No. 6, 2006, pp. 442- 446. doi:10.1016/j.ijpvp.2006.01.003
- N. L. Pederson, “Stress Concentrations in Keyways and Optimisation of Keyway Design,” Journal of Strain Analysis for Engineering Design, Vol. 45, No. 8, 2010, pp. 593-604.
- A. Bhargava and K. N. Shivakumar, “Three-Dimensional Tensile Stress Concentrations in Countersunk Rivet Holes,” Aeronautical Journal, Vol. 111, No. 1126, 2007, pp. 777- 786.
- S. Timoshenko and J. N. Goodier, “Theory of Elasticity,” McGraw-Hill, Boston, 1970.