Materials Sciences and Applications
Vol.3 No.12(2012), Article ID:25387,4 pages DOI:10.4236/msa.2012.312120
Effect for Inhomogeneity by Pb Substitution on (Bi1-yPby)2Sr2Ca1-xYxCu2O8+δ Single Crystals
![]()
Department of Physics, Kumamoto University, Kumamoto, Japan.
Email: ichikawa@kumamoto-u.ac.jp
Received October 1st, 2012; revised October 30th, 2012; accepted November 28th, 2012
Keywords: Superconductor-Insulator Transition; Inhomogeneity; XRD; WDS
ABSTRACT
Inhomogeneity is one of the most important problems for the investigation of the superconductor-insulator transition. Y and Pb co-doped Bi2Sr2CaCu2O8+δ (PbY-Bi2212) crystals were fabricated by the self-flax method in order to control both carrier density and dimensionality. The Y-content of PbY-Bi2212 crystals was much wide distributed in the same crucible rather than that of only Y doping Bi2212 (Y-Bi2212) crystals. In order to clear the origin of inhomogeneity, crystals were characterized by wavelength-dispersive X-ray spectroscopy (WDS) and X-ray diffraction (XRD). One can estimate the Y-content of cleavage samples from the c-axis lattice parameter obtained by XRD because mainly Y-content affects to c-axis lattice constant for both Y-Bi2212 and PbY-Bi2212 crystals. It found that there are some samples with multi-phases and the ratio of samples with multi-phase for PbY-Bi2212 crystals is larger than that for Y-Bi2212 crystals. The linear relation between Y-content and Pb-content were also found from WDS. Large inhomogeneity of Y-content may be induced from Pb-content inhomogeneity. Transport properties are strongly dependent to Y-content. However they cannot be explained only from the macroscopic chemical compositions of the substitution atom Y and Pb. It may be related to microscopic inhomogeneity.
1. Introduction
The superconductor-insulator transition (SIT) has been intensively studied in homogeneously disordered twodimensional (2D) thin films since the late 1980s [1-3]. In some theory it is expected that the SIT may be the quantum phase transition and the threshold of SIT is related to the universal constant, i.e. the quantum resistance . A lot of attention has been directed towards a clear separation between superconducting and insulating in a sequence of films of different sheet resistances. Experimental works have been investigated about the critical sheet resistances which were compared with
 . So that, the SIT is done experiments for several materials (high Tc superconductors, organic superconductor etc.) and several shape of samples (thick films, polycrystals, singlecrystals etc.).
High-Tc cuprate superconductors (HTSC) are quasi-2D system, and the SIT of them has been reported on many kinds of samples [3]. These reports indicate the existence of a threshold sheet resistance. However not all the threshold sheet resistances were close to Rq. Furthermore several methods to calculate a sheet resistance were used: the sheet resistance per a CuO2 bilayer [4], per individual CuO2 plane [5]. Then, a mechanism of the SIT for HTSCs may not be the same one for 2D thin films.
We have so far investigated the SIT for HTSC thin films and single crystals [6-8]. One of the reasons why we use single crystals is that the SIT was observed on even thick samples. We are interested in the origin of the SIT for thick samples. Then the thickness driven SIT is inappropriate for our study. Extreme huge magnetic field is necessary to study the magnetic field tuned SIT for nondoped HTSCs. The doping controlled SIT may be related to competition between Mott transition (electronelectron interaction) and Anderson transition (disorder). Bi2Sr2CaCu2O8+y (Bi2212) is one of the highest anisotropy systems among HTSCs. Therefore the doping control SIT for Bi2212 single crystals is selected as our research target.
Inhomogeneity is one of the most important problems for studying the doping controlled SIT. We have reported the relation between microscopic inhomogeneous structure and transport properties for SIT [8]. Since superconducting properties relate to dimensionality, it is easily expected that the dimensionality of samples relate to properties of SIT. Therefore we have studied the transport properties of Y and Pb doping Bi2212 crystals. Y substitution is due to the doping level and Pb substitution is mainly due to dimensionality. However it found that Pb substitution drives Y inhomogeneity in our study. In this report the effect of Pb substitution on the inhomogeneity and transport property is studied in order to analyze atomic compositions and to measures transport properties.
2. Experimental
The Y and Pb co-doped Bi2212 crystals used for the present work were grown using a self-flux method in Al2O3 crucibles. Starting materials for the crystal growth were powder Bi2O3, PbO, SrCO3, CaCO3, Y2O3 and CuO, and were weighted out to yield an atomic ratio Bi:Pb:Sr:Ca:Y: . Here x and y are nominal compositions of Y and Pb, respectively. Excess Bi2O3 and PbO acts as a flux for the crystal growth. Those materials was mixed and fired at 800˚C for 48 h. This process was repeated two times. The product were melted at 1100˚C for 5 h, then fast cooled down to 940˚C, then slowly cooled down to about 790˚C - 810˚C at a rate 0.6˚C - 1˚C/h, followed by a furnace cooling down to room temperature. The crystals were removed after breaking the crucible. The crystals were cleaved mechanically. Typical sample size is about 3 × 6 × 0.01 mm3. Hereafter PbY-Bi2212 stands for Y and Pb co-doped Bi2212 crystals, while Y-Bi2212 represents Y only doping Bi2212 crystals.
The c-axis lattice parameter was measured by X-ray diffraction (XRD). The Kα radiation from a copper anode was selected. The temperature dependence of resistivity was measured by dc four-probe method. The real atomic compositions of the resulting crystals were determined by wavelength-dispersive X-ray spectroscopy (WDS).
3. Results and Discussion
Figure 1 shows the real atomic compositions of Y (measured Y-content) determined by WDS as a function of nominal composition of Y, x. Measured Y-content is much larger than nominal content like other groups reports [9] and is distribute even in the same batch. While we have reported the inhomogeneity of the Y-content for Y-Bi2212 crystals [8], Y-content is much wide distribute for PbY-Bi2212 crystal rather than for Y-Bi2212 ones.
All peaks on crystal XRD patterns can be indexed using (00l). Figure 2 shows the relation between c-axis lattice constant and measured Y-content gotten by WDS for PbY-Bi2212 crystals. It is well known that c-axis lattice constant is linearly dependent to Y-content for YBi2212 crystals [9]. From Figure 2 it is found that the similar relation exists not only for Y-Bi2212 crystals but also for PbY-Bi2212 ones.
Samples with single phase were selected in order to plot Figure 2 because we want to find the relation between c-axis lattice constant and Y-content. However, the crystal Pb5Y10a07 is a three-phase sample. Here the sample name Pb5Y10a07 represents the 7th sample cleaved from the 1st batch (represented by “a”) of the following nominal content: Y 10% (x = 0.1) and Pb 5% (y = 0.05). The same hereinafter for sample names. Many cleaved samples were observed multi-peaks for (00l) on XRD spectra. Therefore it is expected that there are multi-phase with different Y-content for these crystals. A typical example for the two-phase sample is shown in Figure 3 which shows a XRD spectra on Pb5Y10a13. There are multi-peaks which correspond to two phases. Existence of multi-phases was confirmed by transport properties (R-T curves) and chemical compositions measured by WDS. Y-content component and existence of multi-phases were estimated by XRD, owing to the convenience of measurement of many cleaved samples.
Figure 4 shows c-axis lattice constant as a function of measured Y-content for PbY-Bi2212 crystals. For WDS a radius of the measured area which corresponds to electron distribution area is several μm. While measured X-ray
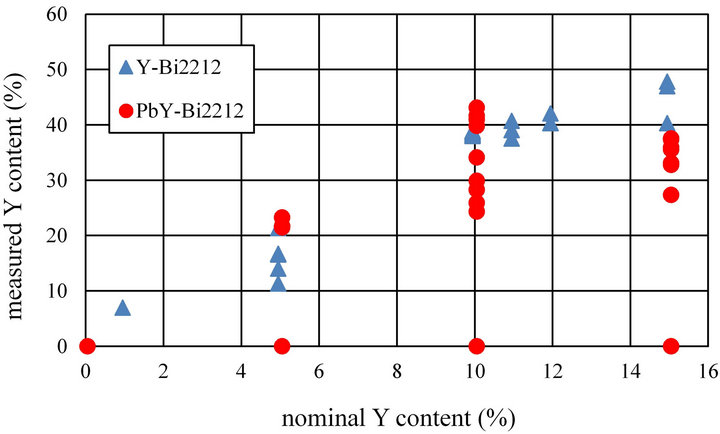
Figure 1. Measured Y compositions as a function of nominal compositions of Y for Y doping crystals (triangles) and Y and Pb doping crystals (circles).
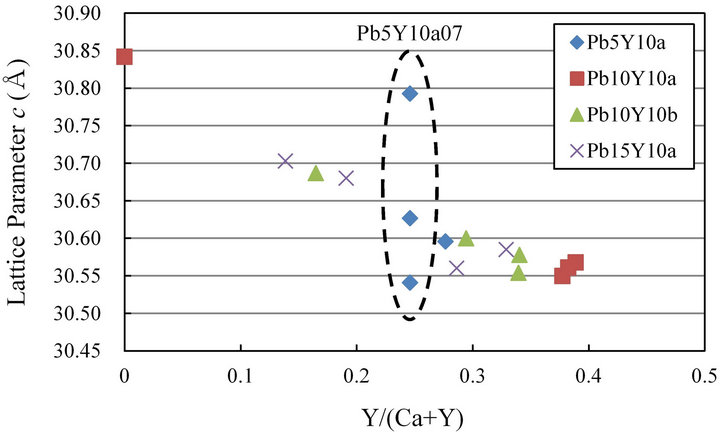
Figure 2. The c-axis lattice constant as a function of measured Y-content obtained by WDS for Y and Pb doping crystals. The sample name Pb5Y10 means that the nominal content of Pb is 5% and the nominal one of Y is 10%. Pb10Y10a and Pb10Y10b were fabricated from different experimental batches.
irradiation area is larger than one for WDS. Then XRD can be estimated Y-content distribution for large area. The ratio of samples with multi-phase for Y and Pb doping crystals is larger than that for Y only doping crystals. The phase with c ~ 30.8 Å is estimated to almost Y free samples estimated from Figure 2. While, there is no Y free samples for Y-Bi2212 crystals. Then large scale inhomogeneity which can be detected by XRD exists for PbY-Bi2212 crystals.
Figure 5 shows the real atom compositions of Pb obtained by WDS as a function of the measured Y-content.
The linear relation between Y and Pb can be recognized from Figure 5. It should be related a charge balance in crystals. However it is only speculative because enough accuracy of oxygen content could not be provided from WDS.
Figure 6 shows the temperature dependence of R/R (280K) in PbY-Bi2212 crystals with nominal composition of Pb = 25%. Both nominal and measured chemical compositions are shown in Table 1. The chemical composition of Y can be checked by the XRD analyses.
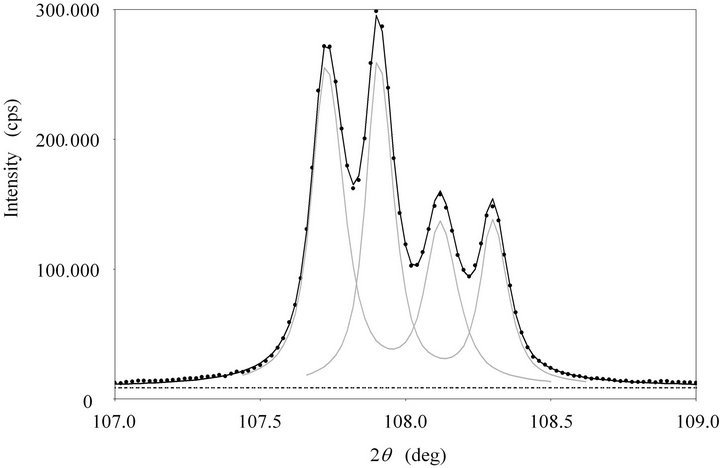
Figure 3. XRD patterns for (0032) reflection of PbY-Bi2212 crystals with multi-phases in Pb5Y10a13. Dots represent the experimental data. Solid line represents the envelop of deconbolution process applied to the pattern. It comes from four peaks and the background (dashed line). Two lower angle peaks from Kα1 and two higher angle peaks from Kα2.
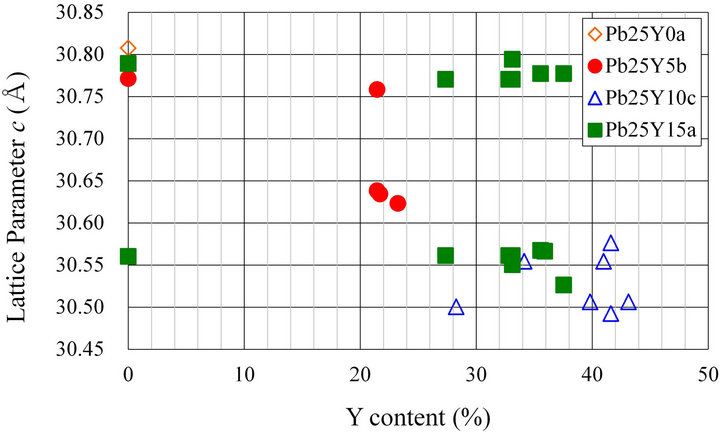
Figure 4. c-axis lattice constant as a function of measured Y-content obtained by WDS for Y and Pb doping crystals.

Figure 5. Measured Pb-content as a function of measured Y-content obtained by WDS.

Figure 6. R/R(280K)-T properties for PbY-Bi2212 crystals with nominal composition of Pb = 25%.

Pb25Y10c06 and Pb25Y10c05 crystals have multi-peaks in XRD spectra. Then, it is reasonable that R-T characteristics have multi-step transitions. Multi-phase samples where multi-peaks were observed on XRD spectra should have large-scale inhomogeneity. Here “large-scale” inhomogeneity means that inhomogeneity can be detected with resolution and sensitivity of X-ray analyses. As mentioned below, however, R-T curves also have multistep transition even on other samples which have no multipeaks on XRD spectra.
The onset temperature of superconducting transition on Pb25Y5a07 crystal is the highest in Figure 6. It is reasonable because no Y spectrum was observed at a measured point on this sample. The c-axis lattice parameter c = 30.77 Å measured by XRD spectra is almost corresponding to Y-free phase. However the R-T curve of this sample has two-step transitions. This behavior indicates that the Pb25Y5a07 sample was constructed more than two phase. While the R-T curve on Pb25Y5a04 has single transition at relatively high Tc value (Tc, onset ~ 91 K, ΔTc = 5 K) even in spite of large Y-content, 23%. A sample with Y content 23% should have relatively low Tc according to Ref. [9]. This sample may be multi-phase and the low Y-content phase may be main phase.
Only single peak was observed on XRD spectra of Pb25Y10c02. However the transport properties show multi-phase properties. After measuring the R-T curve, the sample was broken to two parts. The Y-contents of both parts were measured by WDS and are different, 41% and 34%. It is confirmed that Pb25Y10c02 crystal consists of at least two kinds of phase by WDS, while the proof of a multi-phase was not found from XRD spectra.
In previous work [8] several types ρ-T characteristics was observed for nominal Y-content 10% without Pb samples (x = 0.1, y = 0). The multi-peaks on XRD spectra of these samples were not observed and these samples have almost the same c-axis lattice constant. Also the microscopic inhomogeneity was observed by the transmission electron microscope. Therefore we conclude that the origin of different transport properties may be microscopic structure. In this research it found that there are at least two types of inhomogeneity except for microscopic structure. One is that the large-scale inhomogeneity can be detected by XRD spectra (ex. Pb25Y10c05 and Pb25Y10c06). The other is that the inhomogeneity cannot be detected by XRD analyses. Therefore transport properties for single-phase samples may be related to these microscopic inhomogeneities.
It is estimated that the inhomogeneity on PbY-Bi2212 in this study is larger than one on Y-Bi2212 from both chemical composition measurement and transport properties. Because surfaces of our samples are flat and cannot see any topological structure from a scanning electron microscope observation, it seems that the inhomogeneity is not related to grain structures. It is well known that the distribution of Pb atom in Bi2212 is wide and inhomogeneity. Therefore one can estimate that the linear relation between Y and Pb contents drives the inhomogeneity of Y-content. Therefore the origin of the inhomogeneity on PbY-Bi2212 may be related to the inhomogeneity of Pb-content. To study the SIT on PbYBi2212 it needs to find a fabrication for homogeneity sample of Pb atom.
4. Conclusion
The Y-content of PbY-Bi2212 crystals fabricated by the self-flax method were much wide distributed rather than that of Y-Bi2212 crystals. The multi-phases of some samples were detected by XRD spectra. While, there are samples with multi-phases that cannot be detected by XRD, but by WDS and/or transport properties. Large inhomogeneity of Y-content may be driven from inhomogeneity of Pb atom since the linear relation between Y-content and Pb-content.
REFERENCES
- A. M. Goldman, “Superconductor-Insulator Transitions in the Two-Dimensional Limit,” Physica E: Low-Dimensional Systems and Nanostructures, Vol. 18, No. 1-3, 2003, pp. 1-6. doi:10.1016/S1386-9477(02)00932-3
- A. M. Goldman, “Superconductor-Insulator Transitions,” International Journal of Modern Physics B, Vol. 24, No. 20-21, 2010, pp. 4081-4101. doi:10.1142/S0217979210056451
- V. F. Gantmakher and V. T. Dolgopolov, “Superconductor-Insulator Quantum Phase Transition,” Physics-Uspekhi, Vol. 53, No. 1, 2010, pp. 1-50. doi:10.3367/UFNe.0180.201001a.0003
- K. Semba and A. Matsuda, “Superconductor-to-Insulator Transition and Transport Properties of Underdoped YBa2Cu3Oy Crystals,” Physical Review Letters, Vol. 86, No. 3, 2001, pp. 496-499. doi:10.1103/PhysRevLett.86.496
- Y. Fukuzumi, K. Mizuhashi, K. Takenaka and S. Uchida, “Universal Superconductor-Insulator Transition and Tc Depression in Zn-Substituted High-Tc Cuprates in the Underdoped Regime,” Physical Review Letters, Vol. 76, No. 4, 1996, pp. 684-687. doi:10.1103/PhysRevLett.76.684
- F. Ichikawa, et al., “Magnetoresistance in a Nd2-xCexCuO4 Thin Film below Tc,” Solid State Communications, Vol. 98, No. 2, 1996, pp. 139-142. doi:10.1016/0038-1098(96)00005-1
- K. Makise, et al., “Temperature Dependence of the Hall Angle in Disordered Y1-xPrxBa2Cu3O7-δ Thin Films,” Physica C: Superconductivity, Vol. 388-389, 2003, pp. 337- 338. doi:10.1016/S0921-4534(02)02489-9
- S. Komaki, et al., “Relation between Inhomogeneous Structure and Transport Properties for SuperconductorInsulator Transitions,” Journal of Physics: Conference Series, Vol. 150, No. 5, 2009, Article ID: 052117. doi:10.1088/1742-6596/150/5/052117
- C. Kendziora, et al., “Composition, Structure, and Electrical Properties of Bi2Sr2Ca1-yYyCu2O8: A Single-Crystal Study,” Physical Review B, Vol. 45, No. 22, 1992, pp. 13025-13034. doi:10.1103/PhysRevB.45.13025