Journal of Modern Physics
Vol.4 No.1(2013), Article ID:26491,6 pages DOI:10.4236/jmp.2013.41001
First Observation of Acceleration of Electrons by a Laser in a Vacuum
1University of California at Los Angeles, Los Angeles, USA
2Fudan University, Shanghai, China
Email: *xding@bnl.gov
Received September 20, 2012; revised October 23, 2012; accepted October 31, 2012
Keywords: Vacuum Laser Acceleration; Laser Phase Velocity; VLA
ABSTRACT
Using the BNL Accelerator Test Facility we have shown that a tightly focused laser on a vacuum can accelerate an electron beam in free space. The electron beam had energy of 20 MeV and the CO2 laser had energy of about 3 Joule. In the readout of the experiment we detect a clear effect for the laser beam off and on. The size of the effect is about 20% and is reproducible over many laser and beam shots. This is a proof of principle and the data are fully consistent with the CAS theory. The results of this experiment may have an impact on the LASER fusion method.
1. Introduction
The acceleration of a free electron by a laser is a longtime goal of acceleration science. In free space a plane wave laser is unable to accelerate an electron according to the 1979 Lawson-Woodword theorem [1-3]. In order to accelerate electron a process that goes the a2 (QED) must be used [4,5]. With today’s powerful lasers it is possible to observe these a2 effects. One concept is the Capture Acceleration Scenario (CAS) [6-9] proposed by Prof. Ho from Fudan University. This method uses a tightly focused laser beam in a special place where the field phase velocity is relatively low. In fact a channel for the electron is created that may be useful for other science such as guiding an electron beam into a special region.
This project has been proposed to Brookhaven National Laboratory—Accelerator Test Facility and approved. This is a collaboration between UCLA high energy group (PI: Prof. David Cline) and BNL-ATF. BNL-ATF is one of the few facilities that can provide both high quality electron beam and high intensity laser beam. Simulation research work and hardware design have been done in accordance to BNL-ATF’s real experimental condition [10,11]. The simulation results predict that vacuum laser acceleration phenomena can be observed with ATF’s diagnostic system.
In this letter we will show a demonstration of the acceleration of an electron by a laser. The experiment was carried out at the Accelerator Test Facility at Brookhaven National Laboratory. A high quality laser photo cathode initiated beam of low emittance is accelerated to 20 MeV and a CO2 laser is focused and brought into contact with the electron beam. The resulting electron beam passes through a magnet spectrometer and the results are recorded with a fast camera.
2. Underlying Physics
We use Gaussian-Hermit (0,0) mode to describe the laser field [6-9]. The phase function will be:
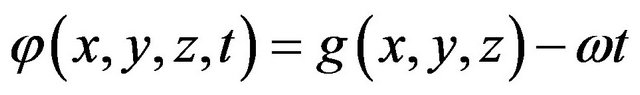 (1)
(1)
where 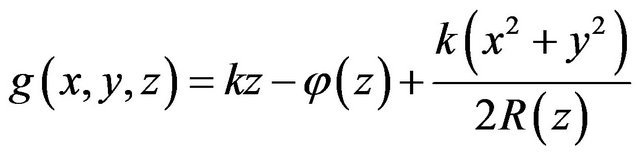 is the phase front. The phase velocity along a certain trajectory J must satisfy the equation:
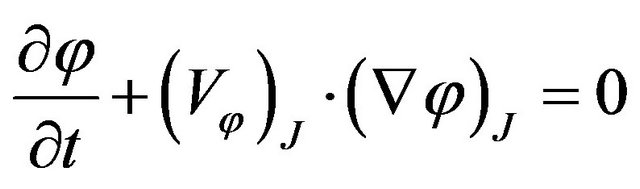 (2)
(2)
where  and
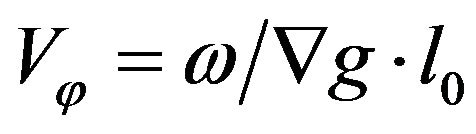
and  are the phase gradient and the phase velocity respectively along the electron trajectory. Therefore we derive the phase velocity formula as:
 (3)
(3)
where  is the unit vector along the certain direction. Then we have
 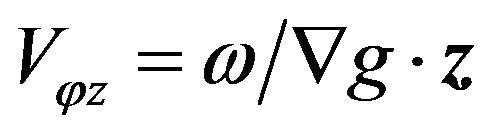 for the phase velocity along the laser propagation direction-axis z; and
 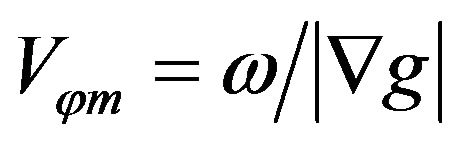 for the phase velocity along the gradient direction on electron trajectory during interaction. Obviously
  provides the lowest phase velocity. Figure 1 represent the minimum velocity
  distribution on y = 0 plane. In the Figure 1 we can see that on the z-axis along propagation (x = 0) direction the phase velocity is no less than c, especially in the central focus spot (z = 0) the phase velocity is much higher than c. In this area, electrons will experience high phase slippage with the laser field and gain no energy.
Also in Figure 1, however, there appear to be regions where the phase velocity is quite low, lower than c. These regions are located at both sides of the laser profile line w(z) and centered at focus spot (x = z = 0) and extend a few w0-length in transverse direction and a few Rayleigh Lengths in longitudinal direction. This feature exists in a focused laser beam because, unlike a plane wave, different wave fronts have different radii of curvature. In the gradient direction of phase front, the phase velocity of the laser beam reaches minimum. In Equation (1), it comes from the phase factor 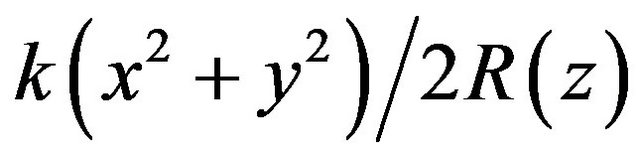 —the diffraction effect. Therefore if the electron is injected in a proper position, the transverse force can keep it moving along the trajectory close to the laser profile. Thus the electron will experience the low phase velocity and the phase slippage would be slow enough so that the electron can be captured in the acceleration phase and continue being violently accelerated.
3. VLA Prediction with ATF Current Experimental Conditions
The current ATF’s CO2 laser system delivers peak energy at 5 J; pulse length 5 ps, 1 ps, 500 fs; focus spot around 50 μm to beam lines in experimental hall. Therefore the laser intensity could be  .
.
ATF’s electron beam system provides a high quality electron beam with low emittance and it routinely operates at energy above 40 MeV to avoid strong spacecharge effects. ATF has two SLAC-type S-band linac sections. Basically there are two solutions to obtain a lower-energy beam: one is to adjust the first linac section
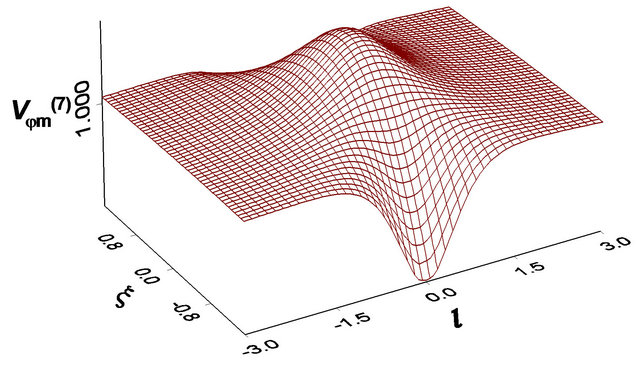
Figure 1. The minimum phase velocity distribution on y = 0 plane, spot waist  ,
,  ,
,  , where
  is the laser waist size and
  is the Rayleigh length.
phasing in acceleration with a larger accelerating gradient but phasing the second linac section in deceleration to obtain a lower energy; and the other is to adjust both linac sections phasing in acceleration but with a lower accelerating gradient. PARMELA code was used first to simulate beam energy spectrums for 20 MeV. And it was successfully tuned to the end of the beam line at 20 MeV beam energy.
The VLA effect at the ATF conditions is non linear— therefore a detailed computer simulation is required [6-9]. This simulation was initially set up in collaboration with the Fudan Group [12].
Laser intensity is another key factor to perform this VLA mechanism. Due to the limited subluminous phase velocity distribution, high laser intensity is required to accelerate electrons in a short distance to catch up the matching phase velocity.
In simulation the electron beam enters along the same direction as the laser beam on the z-axis and encounters the laser beam at the laser focus spot. The simulation results are shown in Figure 2(a). We only show the simulation of e-beam 168 microns. Figure 2(b) represents the final electron beam energy spread after interacting with laser. Figure 2(a) is the case of laser off; the electron beam doesn’t experience any field.
We use Gaussian regression to analyze the energy distribution. Figure 2 illustrates the simulation results based on the given parameters of BNL-ATF real experimental condition. By comparing Figures 2(a) and (b), we can observe that the electron beam energy spread increases. Here σ is the standard deviation of Gaussian distribution, e.g. ±σ covers 68% events and ±2σ covers 95% events of the distribution. We define energy spread ratio as ΔE/E0, where ΔE is the width of energy spread of ±2σ, and E0 is the energy expectation value in Gaussian distribution (the center energy value). On Figure 2 it shows that the energy spread ratio expands to 3.3% from the initial 1.78% after interacting with laser beam. ATF’s current spectrometer and diagnostic system can distinguish 0.1% accuracy and tell 0.05% accuracy. The changes of energy spread between “laser on” and “laser off” can be measured by the spectrometer on the beam line. The original e-beam is at 20 MeV and ~1.78% energy spread. And the final e-beam energy spread is still centered around 20 MeV. However the energy spread increases to around ~3.3%, which gives about ~550 keV. The maximum energy loss and gain could be up to ~±1.0 MeV. When the laser intensity increases, there will be more significant effect, studied in our previous simulation [10,11]. At higher laser power we expect rapid acceleration of the electron beam. At larger values of the laser intensity the acceleration rapidly increases with intensity. These effects can be seen in Reference [11].
We show the detailed simulation of the result on beam
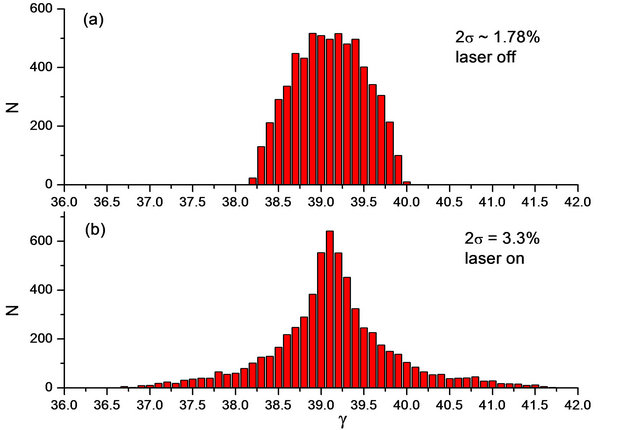
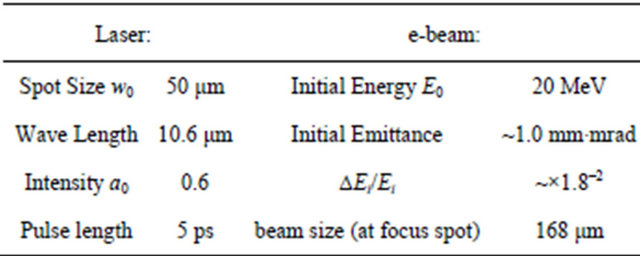
Figure 2. Electron beam particles distribution versus energy spread. (a) shows the result of laser off, (b) shows the result of laser on case. The parameters see Table 1.
Table 1. Actual BNL-ATF experiment condition parameters for simulation.
energy spread with the laser on in Figure 2(b). We have put all the current parameter of the experiment into our simulation. Other differences can also be seen in the laser off/laser on events.
This is consistent with our theory and proves the signal of net energy exchange coming from laser acceleration mechanism. This proof-of-principle experiment is the first stage of the project and it is assigned on beam line #1 at BNL-ATF. Note that the accelerated beam width is asymmetrical as we would expect.
4. The Experimental Set-Up at the ATF
In Figure 3 the layout of the experiment design is shown. Target parts (3) and (4) are the pinhole and Germanium plate respectively. The pinhole is used for electron-beam and laser beam alignment. On beam line #1 at ATF, one He-Ne laser is used to simulate electron beam transporting and another He-Ne laser is used simulate the CO2.
With the iris at the downstream position we use a pinhole and the two local He-Ne lasers to achieve alignment. The Germanium plate is used for synchronization. An electron-beam going through the Germanium plate will generate plasma, which blocks the CO2 laser beam. By measuring the signal on the detector (7) we can achieve synchronization to ps. After alignment and synchronization are achieved the optics setup outside vacuum chamber will be disabled for interaction measurement. The yellow parallel lines denote the initial incoming CO2 laser beam.
The CO2 laser enters from the downstream window and then goes backward along the beam line by being reflected by the downstream flat mirror (1) in the chamber. And parabolic mirror (2) will focus the incoming CO2 laser at the interaction spot and reflect the CO2 laser again to propagate forward the same direction as electron beam. After interacting, the e-beam is directed out of the interaction vacuum chamber downstream on beam line #1. There is a dipole positioned right after the chamber downstream can bend the e-beam by 90 degrees to guide the output electron-beam to the spectrometer which then can measure the energy spread of the output e-beam. The major interaction area is only about several centimeters (a few Rayleigh lengths).
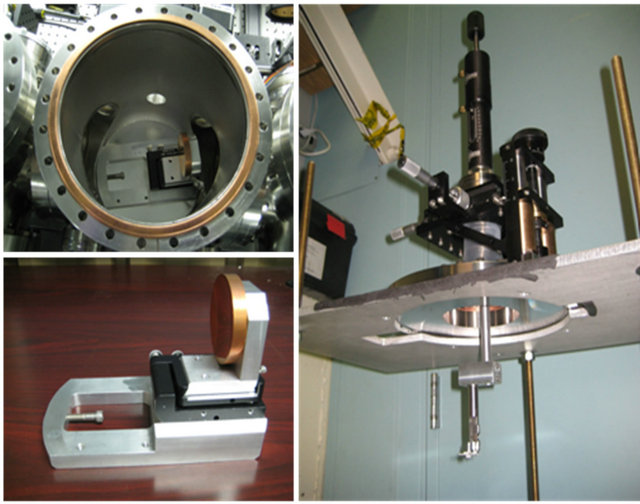
Figure 4 shows the experiment devices, set up on beam line #1. The upper-left in Figure 4(a) is the vacuum chamber for interaction. The lower-left in (a) is the parabolic mirror with a 2 mm hole, used for reflecting and focusing laser. The parabolic mirror sits in the vacuum chamber as we can see in the upper-left in Figure 4(a). The right side of Figure 4(a) is the target of pinhole and Germanium plate mounted on the flange which will be installed in vacuum chamber in the upper-left in Figure 4(a). The flange can adjust the target (the pin-hole
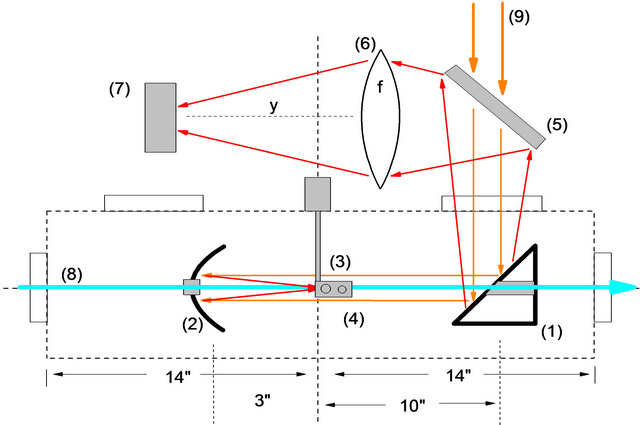
Figure 3. Experiment design and diagnostic system. It will be on Beamline #1, (1) Flat mirror #1 with small hole, reflecting CO2 laser; (2) Focus parabolic mirror #2 with small hole, short focus length f = 3”; (3) and (4) The pinhole and Germanium plate for alignment and synchronization; (5) 45˚ Beam splitter for alignment and diagnostic; (6) and (7) outside vacuum chamber detector setup for beam synchronization; (8) electron beam; (9) CO2 beam.
 (a)
(a)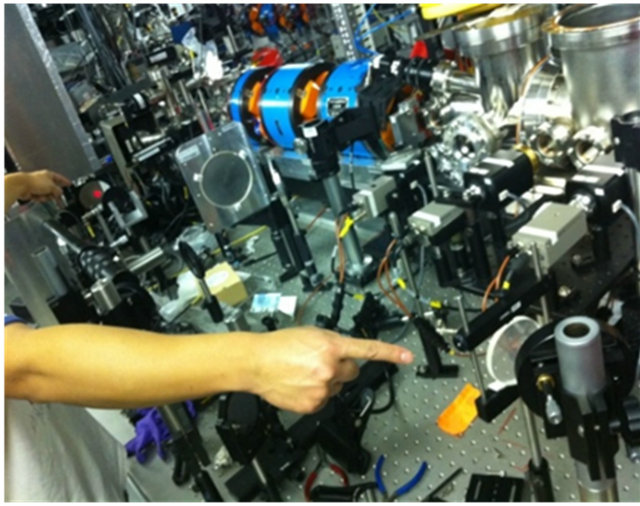 (b)
(b)
Figure 4. Experiment devices and setups. Upper-left in (a) is the vacuum chamber for interaction; the lower-left in (a) is the parabolic mirror with 5 mm hole for electron-beam transporting, with focus length 3, sitting in the chamber (upper-left in (a)); the right side in (a) is the target of pinhole and Germanium plate mounted on the flange, which will be installed in the vacuum chamber; (b) is the outlook of beam line #1 and optics setup table.
and Germanium) in three directions. The pinhole will be used for alignment and Germanium will be used for synchronization. The 3-D adjustment of the flange will be used to control the shifting. And the whole target will be completely retracted during experiment, after alignment and synchronization. The parabolic mirror is mounted on an adjustable stage, facing the direction of downstream. As we described in Figure 3, the incoming CO2 laser will be placed opposite the beam line transporting direction. The parabolic mirror will reflect CO2 back to guide it to the same direction of beam line transporting and focus CO2 in 3”, the position of the target. The 2 mm hole in the parabolic mirror will be set to the same height as the e-beam in order to let the e-beam go through the mirror. Figure 4(b) shows the outlook of the beam line #1 setup and optics setup for guiding CO2 laser outside the chamber.
5. Experimental Data
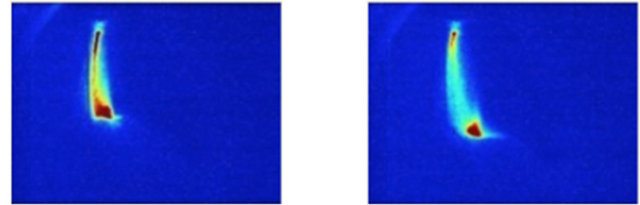
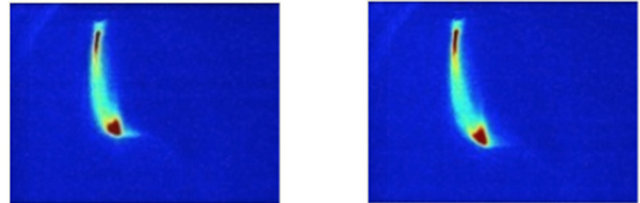
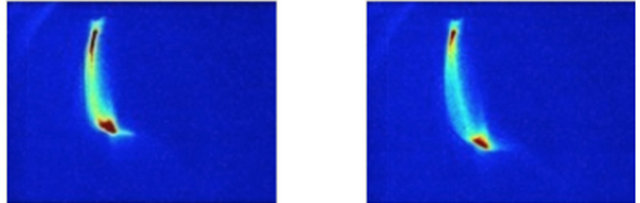
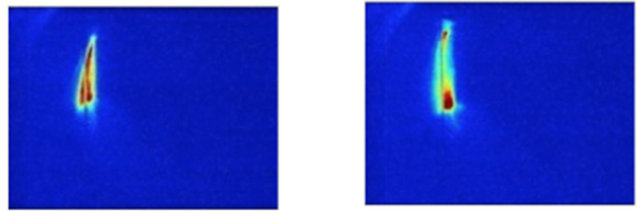
During March 2012 the experiment was carried out at the ATF. The CO2 laser pulse was delivered around 30 shots. The peak power of CO2 laser pulse was relatively weak at the first 10 shots around 1 J; and remained stable at 3 J for the rest 20 shots, for which we took snapshots on the spectrometer downstream. Every snapshot is a pair of laser-off and laser-on. Both laser beam and e-beam have pulse duration of 5 ps and the synchronization resolution is close to 1 ps. Through the entire experiment process, we scan laser-pulse and e-beam pulse offset by 1 ps at every shot in order to optimize the overlap of laser-beam and electron beam during interacting. Transversely both laser beam and electron beam are focused and aligned via a 200 micron pinhole. The laser beam size is 40 microns and electron beam size is about 100 microns. As for each snapshot pair, the first frame was taken for laser on according to synchronization setup; the second frame was taken 2 - 3 seconds later without changing electron beam configuration. As shown in Figure 5, each row of two frames represents one snapshot-pair of laser on (on the right side) and laser off (on the left side) with unchanged configuration. Here we only demonstrate four pairs of snapshots. The same effect is seen in most of the 20 high intensity shots.
The energy spread of the beam was increased as expected in the Figure 2 simulation result. From Figure 5, a significant energy spread increase can be obviously observed and it is consistent with the simulation of the experiment. All 30 snapshot-pairs present two important homogenous features:
1) Electron beam profile shape remains stable/unchanged for two snapshots in one set with 2 seconds latency.
2) Energy spread always increases with cases of laser on. There is no one exception through the whole experiment where it decreases.
From these two important homogeneous features, we can conclude that the interaction between electron beam and laser beam in vacuum is only reason increases energy spread distribution, and causes acceleration and deceleration on both energy spread ends simultaneously. This conclusion is consistent with our simulation results.
Though the results’ optimization varies because of both synchronization setup and alignment defects, it doesn’t impact the underlying physics principle—electrons/charged particle can have net exchanged with intense focused laser beam.
In our previous work [6-9] we pointed out that vacuum laser acceleration scheme is linear after the threshold of laser intensity around a0 ≈ 5 (CAS model); and is nonlinear under the case that laser intensity less than this threshold. The CAS method implies that there is a channel that the electrons are captured into and it yields high acceleration gradient. However the non-linear interaction model presents symmetric property of the acceleration and deceleration. In this scheme, the electron bunch meets the entire laser pulse, 2, therefore, half gets accelerated and half gets decelerated.
This paper is for proof-of-principle discovery on vacuum-laser-driven-electron-acceleration. This could possibly
Spectr_after_018 Spectr_laser_018
Spectr_after_019 Spectr_laser_019
Spectr_after_027 Spectr_laser_027
Spectr_after_030 Spectr_laser_030 Laser off Laser on
Figure 5. Pictures of the beam momentum spread after the spectrometer taken with the laser off (left column) and the laser on (right column). The length of the beam image reveals the energy spread of the beam. The experiment recorded 30 shots. 20 shots were high intensity and showed effects of the laser on/laser off difference. We show 4 shot examples here. Pictures are taken from spectrometer on Beam Line #1 at BNL-ATF.
be useful for LASER fusion applications. The electron beam could be accelerated and guided into a pellet to provide ionization in the pellet that may damp instabilities. We have been in contact with the National Ignition Facility (NIF) group at LLNL and may propose an experiment there to test this concept.
6. Conclusion
We have carried out an experiment at the BNL Accelerator Test Facility to demonstrate that a tightly focused laser on a vacuum can accelerate an electron beam in free space. The electron beam had energy of 20 MeV and the CO2 laser had energy of about 3 Joule. In the readout of the experiment we detect a clear effect for the laser beam off and on. The size of the effect is about 20% and is reproducible over many laser and beam shots. This is a proof of principle and the data are fully consistent with the CAS theory.
7. Acknowledgements
This work was supported by the US Department of Energy under award number DE-FG02-92ER40695 (UCLA). Thanks to the collaboration and support from Fudan University, Shanghai, China and Brookhaven National Laboratory Accelerator Test Facility, Upton, New York. We wish to thank Igor Pogorelsky, Karl Kusche, Mikhail Fedurin, and Yusuke Sakai for their help. We thank Robert Palmer for his support of this experiment and discussions and Caludio Pellegrini for discussions.
REFERENCES
- P. M. Woodward, “A Method of Calculating the Field over a Plane Aperture Required to Produce a Given Polar Diagram,” Journal of the Institution of Electrical Engineers, Vol. 93, No. 10, 1947, pp. 1554-1558.
- J. D. Lawson, “Lasers and Accelerators,” IEEE Transactions on Nuclear Science, Vol. 26, No. 3, 1979, pp. 4217-4219. HUdoi:10.1109/TNS.1979.4330749U
- R. B. Palmer, “A Laser-Driven Grating Linac,” Part Accel, Vol. 11, 1980, pp. 81-90.
- M. Baig, “Phase Transitions in Lattice QED,” Nuclear Physics B—Proceedings Supplements, Vol. 42, No. 1-3, 1995, p. 654. HUdoi:10.1016/0920-5632(95)00340-FU
- C. Bula, et al., “Observation of Nonlinear Effects in Compton Scattering,” Physical Review Letters, Vol. 76, 1996, pp. 3116-3119. HUdoi:10.1103/PhysRevLett.76.3116U
- J. Pang, Y. K. Ho, et al., “Subluminous Phase Velocity of a Focused Laser Beam and Vacuum Laser Acceleration,” Physical Review E, Vol. 66, No. 6, 2002, Article ID: 066501. HUdoi:10.1103/PhysRevE.66.066501U
- J. X. Wang, et al., “Electron Capture and Violent Acceleration by an Extra-Intense Laser Beam,” Physical Review E, Vol. 58, No. 5, 1998, pp. 6575-6577. HUdoi:10.1103/PhysRevE.58.6575U
- L. J. Zhu, et al., “Violent Acceleration of Electrons by an Ultra-Intense Pulsed Laser Beam,” Physics Letters A, Vol. 248, No. 6, 1998, pp. 319-324. HUdoi:10.1016/S0375-9601(98)00685-9U
- Q. Kong, et al., “Conditions for Electron Capture by an Ultraintense Stationary Laser Beam,” Physical Review E, Vol. 61, No. 2, 2000, pp. 1981-1984.
- L. Shao, D. Cline, X. P. Ding, et al., “Simulation Prediction and Experiment Setup of Vacuum Laser Acceleration at Brookhaven National Lab-Accelerator Test Facility,” Nuclear Instruments and Methods in Physics Research Section A, Vol. 701, 2013, pp. 25-99.
- L. Shao, D. Cline, X. P. Ding, et al., “Vacuum Laser Acceleration at BNL-ATF,” Proceedings of PAC09, Vancouver, 4-8 May 2009, pp. 3022-3024.
- L. Shao, “Research on Vacuum Laser Acceleration and Proof-Of-Principle Experiment,” Ph.D. Dissertation, University of California at Los Angeles, Los Angeles, 2012.
NOTES
*Corresponding author.