Advances in Bioscience and Biotechnology
Vol.4 No.3A(2013), Article ID:29270,8 pages DOI:10.4236/abb.2013.43A054
Attachment of Escherichia coli to fine sediment particles within construction sediment basins
![]()
Biosystems Engineering, Clemson University, Clemson, USA
Email: etempel@g.clemson.edu, privett@clemson.edu, calvins@clemson.edu, jhayes@clemson.edu
Received 2 January 2013; revised 5 February 2013; accepted 15 February 2013
Keywords: E. coli; Sediment; Sediment Basins; Erosion; Stormwater; Runoff; Construction
ABSTRACT
The conventional best management practice of sediment basins may create a reservoir for pathogenic bacteria. The fine particles that enter these basins have been shown to provide protection for bacteria; the small pores of clays and silts minimize predators and block sunlight. Therefore, while these basins decrease sediment loadings to water bodies downstream, they may introduce harmful levels of pathogenic bacteria into surface waters. In addition to causing human health risks, high bacteria levels alter natural biological makeup of downstream ecosystems. This paper describes the attachment of Escherichia coli to various particle sizes in construction site sediment basins. Five sediment basins, located in Anderson, South Carolina were sampled after rain events to explore trends that exist between various particle sizes and E. coli densities. Results provide evidence to suggest that sediment basins are a reservoir for pathogenic bacteria. Data showed that most E. coli attached to smaller particles with diameters less than 0.004 mm. These particles do not settle out of the water column quickly and are often passed through the basin during intense storms. Consequently, high levels of bacteria are passed to downstream waters. This research provides considerable evidence that the clays and silts within man-made construction basins can cause detrimental effects to South Carolina surface waters. With this knowledge, better stormwater management practices may be developed with the goal of remediating impaired surface waters of South Carolina.
1. INTRODUCTION
Stormwater has become a major contributor of nonpoint source pollution across the country [1]. The United States Environmental Protection Agency (USEPA) amended the Clean Water Act in 1987 to regulate stormwater runoff quality [2]. Therefore, South Carolina Department of Health and Environmental Control (SC DHEC) requires stormwater pollution prevention plans and calculations to be submitted for review for construction projects that disturb more than one acre. Additionally, Nonpoint Discharge Elimination System (NPDES) permits must be obtained for construction projects that disturb more than one acre [3].
Sediment basins are the traditional method for reducing sediment loads leaving a construction site. It is known that sediment carries chemical and biological pollutants that attach to sediment particles [2]. Additionally, sediment itself acts as a pollutant that can cause much physical damage to stream channels by reducing water clarity, altering the stream flow, and altering aquatic habitats. As a result, sediment can have toxic effects on aquatic biota [4]. Sediment ponds are designed to allow sediment from stormwater on construction sites to settle out of the water column before the water is discharged downstream, so that these effects can be minimized.
According to SC DHEC (SC R. 61-9), sediment ponds must be designed to achieve the least of 80 percent sediment removal efficiency or less than 0.5 mL/L of settleable solids for 2-year and 10-year design storms [3]. However, fine clay particles that do not settle out of the water column often carry the largest concentrations of pathogenic bacteria. A study done on survivability of bacteria associated with different particle sizes revealed that fecal indicator bacteria such as Escherichia coli in the water column were most associated with particle sizes less than 0.05 mm in diameter [2]. This diameter size includes both silt and clay particle sizes.
In recent years, the use of sediment basins has been questioned as research reveals that sediment in these basins may be a reservoir or even a source for pathogenic bacteria [2]. Indicator bacteria levels are often 10 to 10,000 times greater in the sediment layer than the water column above [5]. Therefore, as sediment is brought into the water column from turbulence during rain events or windy conditions, it introduces high levels of pathogenic bacteria into the water column. These events produce water quality conditions that do not meet USEPA suggested levels upon discharge into surface waters. A study on the effectiveness of structural best management practices (BMPs) revealed that rainstorms caused a surge in bacteria concentration at their discharge points. This surge is due to the resuspension of sediment particles in the water column [2].
Additionally, studies have shown that E. coli and other fecal indicator bacteria persist in sediment for extended time periods because the fine sediment particles provide protection from sunlight and predators. The smaller pore spaces of fine particles are predicted to provide better protection for the bacteria, as predators are not able to fit into the pores [6].
The fate of bacteria is also determined by regional and site-specific conditions, including the correlation of high fecal coliform densities in increased sediment loads of South Carolina Piedmont streams [7]. Jolley’s study also found that indicator bacteria attached to suspended sediment and remained viable following deposition. To specifically describe indicator bacteria fate in construction basins, Sawyer [4] conducted further research within these basins. Results of the study revealed that E. coli densities were elevated at the outlets of the basins compared to the inlets, and that the likely cause of raised E. coli densities was due to resuspension of the sediment within basins.
Following the research of Sawyer, this study analyzed the densities of the indicator bacteria, E. coli with respect to particle size in sediment basins. This analysis revealed the particle size and depth that will most likely contain E. coli and also revealed the ability of sediment basins to contain E. coli during turbulent conditions such as rain events. Sediment size was analyzed by wet sieve analysis and pipette analysis, and bacteria enumeration was achieved using the US EPA approved Colilert enzyme substrate assay system.
Because bacteria are tied to fine sediment particles, and due to the easy resuspension of these fine particles during rain events, further measures must be taken to increase the ability of sediment basins to capture these fine particles [4]. By capturing the suspended silts and clays, bacteria will also likely be captured. It is important to further study the fate of bacteria in sediment basins as they associate to sediment, so that more effective design criteria and regulations can be made with respect to construction activities.
The studies linking bacteria to sediment occur in a wide variety of settings. This project will specifically link bacteria to sediment that is a direct result of runoff into sediment basins and will further support the research of Sawyer [4]. In South Carolina, the quality of the discharge exiting the pond is not required to be recorded. Therefore, high levels of pollutants, including bacteria may be commonly present in the discharge. Bacteria behavior of E. coli within sediment basins and construction activities will be further explained by this study.
1.1. Goals and Objectives
The goal of this project is to better understand the particle size that most likely contains the highest levels of E. coli within sediment basins. Therefore, a relationship between particle sizes and E. coli density is to be established. If this goal can be fulfilled, E. coli behavior within sediment ponds can be better understood. An understanding of indicator bacteria and sediment particle size relationship will allow better stormwater management and design to be implemented.
1.2. Importance of Bacteria-Sediment Relationship Research
The 2008 SC DHEC listing of impaired water bodies has listed 1050 water body impairments in South Carolina’s rivers, streams, and lakes. These impairments include water quality exceedances of bacteria, heavy metals, and other biological and chemical impairments. Approximately one third of these impairments are due to high levels of fecal coliform bacteria [8]. These exceedances correspond to previous USEPA recommended safe levels for recreational waters; however, currently, the USEPA recommends E. coli to be used as an indicator in place of fecal coliform. Such impairments are thought to increase risk of gastrointestinal illness in recreational users.
Poor water quality due to fecal contamination not only increases risk of health illness, but may have a negative impact on South Carolina’s economy by decreasing tourism and closing coastal shellfish beds. These activities are a large part of South Carolina’s economy; water quality improvement can therefore improve economic conditions for the state. Additionally, as water quality degrades the cost to treat drinking water increases.
In 2001, diseases caused by five major fecal bacterial pathogens in the United States resulted in an economic loss of approximately 6.9 billion dollars. Across the nation, decreased water quality due to fecal contamination has caused economic losses due to sick leave, medical costs, and lowered tourism [9]. It is imperative to understand the fate and transport of fecal bacteria such as E. coli in nature—its secondary host—so that measures can be taken to prevent illness-causing concentrations from appearing in recreational waters.
If sediment basins are in fact a reservoir or source of E. coli and other fecal bacteria, these BMPs may actually be contributing to the impairment of South Carolina surface waters. The primary need for sediment basins must be addressed—these basins are designed to prevent the accelerated loss of storage capacity, increase in navigational obstructions, and lowered aesthetic values of downstream water bodies. However, another method may need to be employed to reduce sediment loss as sediment basins are not effective and likely degrade water quality in other respects [10].
In addition to high levels of E. coli in basin discharge, studies have revealed that erosion from the sediment basin itself and resuspension of sediment during rain events accounts for approximately 50 percent of sediment loss from sediment basins. Millen et al. [10] noted that sediment particles smaller than 0.075 mm were completely mixed during the inflow/dewatering event caused by rainstorms.
1.3. Site Description
Data collection was performed on five construction basins in Anderson, SC (Figure 1). These sites were permitted for land disturbance activities. Soils on the sites are predominately of the Cecil series, a moderately to well-drained clay loam topsoil with a predominantly clay subsoil. By conducting eroded particle size distributions, it was found that sand, silt, and clay particles and aggregates range from 50 to 80 percent, 15 to 45 percent, and 5 to 35 percent, respectively in the eroded material from each site. The historical yearly rainfall average is 125 cm and the historical average temperature is 16.4 degrees Celsius [4]. All sites were given a code in order to preserve their anonymity. Site information including soils and basin geometries were found using the site plans and stormwater calculations provided by the City of Anderson. The following sections give information for each site.
1.3.1. CH-1 Sediment Basin
Constructed in 2007, CH-1 sediment basin is located on a site containing 4.9 hectares disturbed soil. This basin drains 2.3 hectares of the site. Dominant soil is Cecil sandy loam with a hydrologic soil group “B” and original land use was forest. This development is intended to
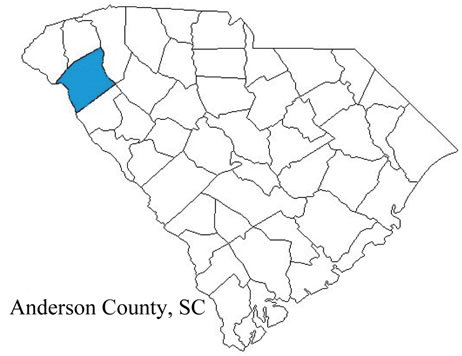
Figure 1. Anderson county location map.
have single/multifamily housing. The 2-year, 24-hour storm capacity is 1246 m3 with peak outflow of 0.04 m3/s, and its 10-year, 24-hour storm storage capacity is 2144 m3 with peak outflow of 0.15 m3/s. The maximum surface area of the pond is 1448 m2. Lastly, design trapping efficiency is 84.47 percent for the design storm. City of Anderson provided this information for all sites.
1.3.2. CH-2 Sediment Basin
The CH-2 sediment basin is approximately three years old and is located on the same site containing 4.90 disturbed hectares. This basin drains 2.6 hectares of the site. The 2-year, 24-hour storm capacity is 1127 m3 and the 10-year, 24-hour storm storage capacity is 2053 m3. Peak flowrates for 2 and 10-year events are 0.04 m3/s and 0.14 m3/s. Maximum surface area of this pond is 1793 m2. This pond has a design trapping efficiency of 87.04 percent for a design storm. Similar to CH-1, native soil was Cecil series, and original land use was forest.
1.3.3. DHC Sediment Basin
DHC sediment basin drains a tract that contains 1.17 disturbed hectares and is approximately three years old. Land was open grass prior to development. Primary soils on this property are Cataula, Hiwassee, and Cecil, and soil group is “B”. Basin volume for a 2-year, 24-hour storm is 937 m3 with a peak flow of 0.02 m3/s, and basin volume for a 10-year, 24-hour storm is 2145 m3 with a peak flow of 0.04 m3/s. Because the disturbed site was less than 2.02 hectares (5 acres), no trapping efficiencies were calculated. Dewatering time was 0.98 days for a 2-year storm and 1.36 days for a 10-year storm.
1.3.4. BC-1 Sediment Basin
BC-1 sediment basin is less than a year old and drains 4.78 disturbed hectares. Soils are dominantly Cecil with Hiwassee and Madison series, also. Soils are classified in hydrologic soil group “B”. Land use on this site prior to development was wooded with heavy brush. This pond has a 2-year, 24-hour storm capacity of 780 m3 with a peak flow of 0.025 m3/s. The 10-year, 24-hour storm capacity is 1232 m3 with a peak flow of 0.05 m3. Maximum surface area of the pond is 1217 m2. Trapping efficiency is 84.5 percent for a design storm.
1.3.5. WHE Sediment Basin
WHE sediment basin is less than one year old and drains 1.58 hectares disturbed land. Land was previously developed for an elementary school. Primary soil on site is Cecil sandy loam. The 2-year, 24-hour storm capacity is 173 m3 with a peak flow of 0.03 m3/s. The 10-year, 24-hour storm capacity is 329 m3 with a peak flow of 0.012 m3/s. Maximum surface area is 636 m2. Trapping efficiency calculations were not performed on this pond.
This basin is ideal for rain data collection as it has only one inlet and one outlet.
2. PROCEDURES
2.1. On-Site Sampling Procedures
Sediment sampling took place over the course of 8 months. Sampling for this project began in August 2010 and concluded in March 2011. Therefore, results under summer and winter conditions were gathered and analyzed. However, most samples were collected from January, 2011 to March, 2011.
To determine E. coli levels with respect to sediment size, sediment samples were taken by dividing basins into three transects—inlet, middle, and outlet—and skimming the bottom of each transect with a polyethylene dipper on the left, right and middle of each transect (Figure 2).
Sediment from each transect was transferred into a bucket which had been triple-rinsed. From the bucket, basin sediment was placed into 500 mL sterile bottles for further analysis.
2.2. Correlation of E. coli Density to Sediment Size by Pipette Analysis
E. coli concentration with respect to particle size was evaluated by taking sediment samples from representative basin transects and separating the particles by size with pipette analysis (Figure 3). Pipette analysis was conducted for each sediment sample before sieve analysis in order to prevent the bacteria from being washed from particles, into solution.
The soil-water mixture was poured into a 500 mL graduated cylinder. The sample was gently mixed to prevent particle-bacteria separation; immediately after, pipette analysis began. A 25 mL pipette was used to extract solution containing a specific particle size based on Stokes Law. A potential source of error in this procedure includes incorrect association of bacteria with particle size due to gentle mixing that may not have sufficiently separated particles. However, gentle mixing was required in order to prevent bacteria from separating from particles into the water column.
Once suspension had been drawn, it was directly trans-
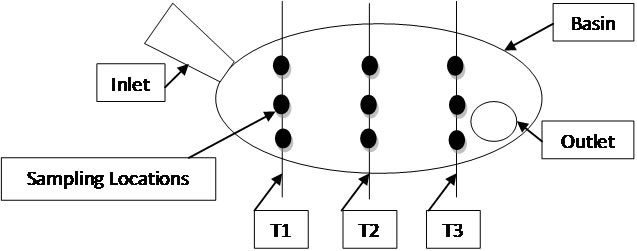
Figure 2. Plan view of transect schematic for sampling.
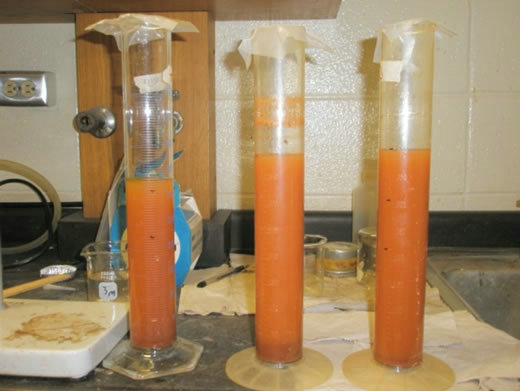
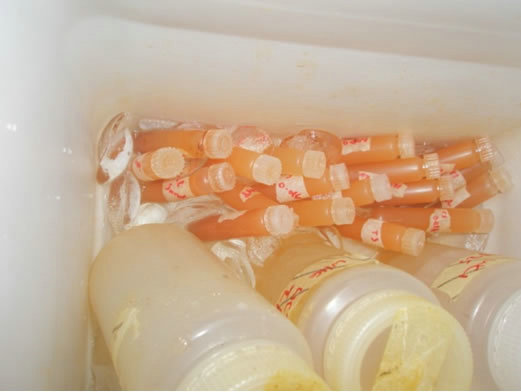
Figure 3. Pipette analysis procedure photographs. Above, cylinders containing basin transect samples; below, transport bottles.
ferred into an autoclaved 10 mL sealable Nalgene bottle and transferred to the lab for bacteria enumeration [11]. The remaining 15 mL was released into a disposable aluminum tin used for constructing eroded particle size distribution. These were dried at 105 degrees Celsius for 24 hours and weighed so that the amount of E. coli could be quantified on a per-gram-of-sediment basis. Figures following show 500 mL cylinders used for pipette analysis and transport bottles that were placed on ice while in transition from the soil lab to the bacteria lab.
After pipette analysis was complete, a sample of settled sand mixture was taken from the bottom of the cylinder for enumeration, in order to obtain E. coli densities within the sand. Once this sample was taken, a sieve analysis (see procedure below) was performed on sand portion in order to form a complete eroded particle size distribution.
2.3. Sieve Analysis
Two 18 L buckets and sieve openings of sizes 2.00 mm, 1.18 mm, 0.425 mm, 0.15 mm, and 0.075 mm were used for sieve analysis. After pipette analysis, each sample was poured through a stack of sieves. If needed, more water was used to aid in passage of the particles through each sieve. Samples were then dried for 24 hours at 105 degrees Celsius and weighed in order to construct an eroded particle size distribution chart and to quantify E. coli densities for each particle size.
2.4. Bacteria Enumeration
Laboratory initial steps for bacteria enumeration were begun within 6 hours of sample collection using the Colilert enzyme substrate assay system developed by IDEXX Laboratories. This system allows a most probable number of bacteria to be found for each sample. The system was used in compliance with Standard Method 9223 B [11]. The Colilert method uses a patented substrate technology to detect E. coli. A nutrient indicator called MUG in the proprietary substrate is metabolized by the E. coli enzyme, β-galactosidase. As the MUG was metabolized by the β-galactosidase, fluorescence was produced. Most other coliforms do not have this enzyme and therefore did not interfere with E. coli growth [12].
3. RESULTS AND DISCUSSION
To find the relationship, if any between particle size and E. coli density, density of E. coli was found for each particle size range by means of pipette analysis. Particle size ranges observed include (diameter, d > 0.075 mm), (0.075 mm > d > 0.062 mm), (0.062 mm > d > 0.031 mm), (0.031 mm < d < 0.016 mm), (0.016 mm > d > 0.008 mm), (0.008 mm > d > 0.004 mm), and (d < 0.004 mm). Figure 4 shows E. coli density range for each particle size in a box and whisker plot. This plot allowed outliers to be determined.
The 25th percentile is a value such that 25 percent of all measurements fall below that value, and 75 percent will fall above that value. The 75th percentile is a value such that 75 percent of all measurements fall below that value, and 25 percent fall above that value. The 25th percentile and 75th percentile are called the lower and upper quartiles, respectively. Inner quartile range is the difference between upper and lower quartiles. Extreme statistical outliers were considered to be those values above the sum of the upper quartile value and three times the inner quartile range. Extreme outliers were calculated for the each data set and were eliminated from the statistical analysis. No extreme low outliers existed for the data sets.
Extreme statistical outliers in the data set were attributed to the nature of the procedures, including that clumping of bacteria may have occurred due to the fact that sediment mixtures could only be gently mixed before pipette analysis. Because the goal of the pipette analysis was to determine density of E. coli attached to each particle size, vigorous shaking and other particle dispersion techniques were not used, for concern that these techniques would detach bacteria from particles and invalidate results. Therefore, E. coli density values that were statistically shown to be extreme outliers were omitted from results as clusters of various particle sizes were suspected to be present in those samples. Table 1 provides the raw and modified results for each transect. Table 2 provides the E. coli densities for particle size as percentage of total E. coli with outliers removed.
After outliers were removed from the data selection and E. coli density for each particle size was shown as a percentage of total E. coli for the sample, the data set was fit using Excel® to a trend line to prove that a logarithmic relationship occurs between particle size and E. coli density. The results of this logarithmic fit may be viewed in Figure 5.
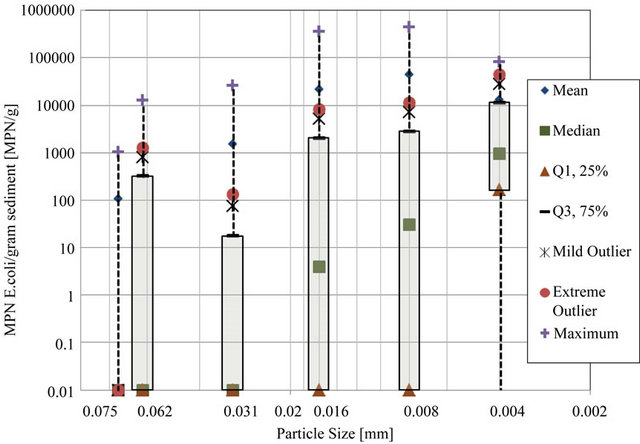
Figure 4. Log transformed E. coli density box and whisker plot.
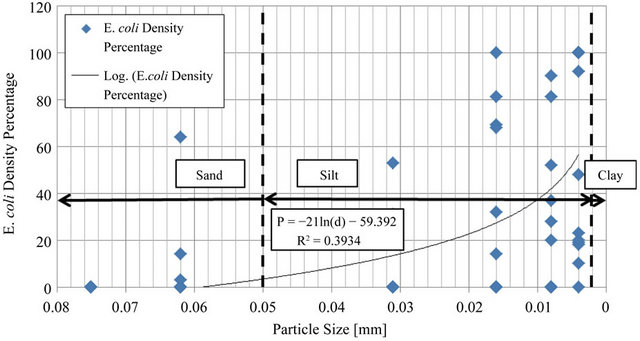
Figure 5. Line fit plot of E. coli percentage as a function of particle size.
Table 1. Raw data for E. coli density with respect to particle sizea.
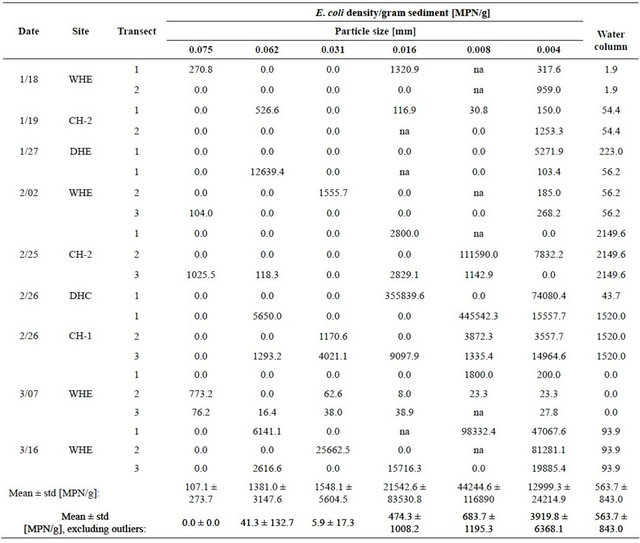
aA value of 0 means that there was no E. coli detected for that sample range or that the subtraction of E. coli from the previous sediment size range was equal or greater than the sample. The note “na” means that no sediment of that particular range was detected; therefore, no E. coli could be present.
Table 2. E. coli densities for particle size as percentage of total E. coli, outliers removed.
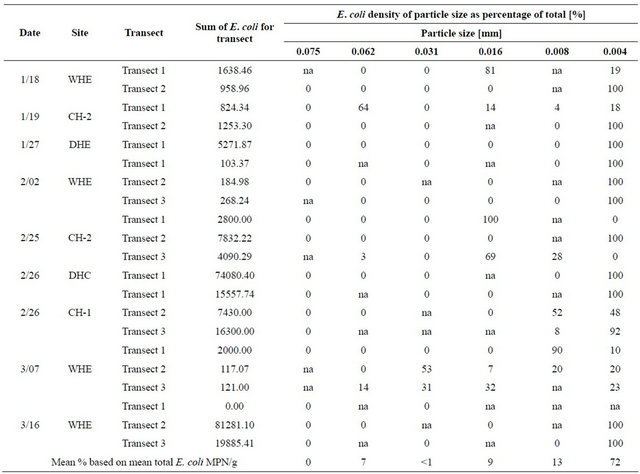
The high percentage of E. coli density attached to the particle size range d < 0.004 mm produced an R2 value of 0.39. The R2 value reveals that 39% of the variability in E. coli density within sediment can be attributed to the particle size of the sediment. Also, by performing a hypothesis test for the correlation coefficient, there is sufficient evidence to show that E. coli density does increase with decreasing particle size (P < 0.001). These data were displayed as percents to remove variability of differing E. coli densities that occurred from basin to basin.
4. CONCLUSIONS
The goal of this research was to better describe overall attachment of E. coli to sediment within sediment basins. Despite variation in results due to E. coli net die off and clustering, clear relationships were found among data. The overall goal was met, and the following conclusions can be made from results.
1) Although the fluctuating nature of bacteria produced an R2 value of 0.39 in results, the prediction that E. coli densities are inversely proportional to particle size as was confirmed by the data. Particle sizes less than 0.004 mm often contain the highest levels of bacteria accounting for an average over 72 percent;
2) E. coli is attached to fines present within the water column that are not sufficiently trapped during rain events. The result is that basin discharge may exceed the US EPA limit of 126 cfu/100mL for a 5-sample geometric mean as well as the single 235 cfu/100mL grab sample for recreational use;
These conclusions give reason to take further steps to polish E. coli research as it pertains to attachment to silts and clays. This research has proven that E. coli is preferentially associated particle sizes less than 0.004 mm. However, clays as classified by AASHTO are those particle sizes less than 0.002 mm. Because the settling time needed to extract clays (<0.002 mm) is over 4 hours, the six hour window for E. coli processing did not allow this size range to be collected by pipette analysis when transport of samples and the enumeration processing time was taken into account. Therefore, further research would enhance results to pinpoint whether E. coli prefer particle sizes less than 0.002 mm.
The results of this research indicate that sediment basins are reservoirs for bacteria. Since there are a large number of impaired water bodies due to high fecal coliform levels, reevaluation of sediment basins as a best management practice is encouraged. These man-made systems are contributing to unnaturally high levels of indicator bacteria in South Carolina surface waters. If removed, E. coli and other bacteria would not accumulate and be resuspended and released during rain events. Alternatives or additions to these basins might include the following features:
• Grassed buffers;
• Baffles at the inlet;
• More complete and immediate stabilization of sediment basin itself;
• Coagulation products such as polyacrylamide (PAM);
• Addition of organic matter such as leaf litter.
From sampling experience, lower turbidity (which has been shown to lower E. coli densities) existed for basins that were better stabilized with tall grass or contained leaf litter that possibly acted as sediment retardation mats and microbial predator habitat. Further research is needed on alternative techniques to determine the effectiveness, benefits, and disadvantages of each. One limitation of this research includes a limited scope of the geographic regions sampled. A second limitation was while this research has proven that E. coli is preferentially associated particle sizes less than 0.004 mm. However, clays as classified by AASHTO are those particle sizes less than 0.002 mm. Because the settling time needed to extract clays (<0.002 mm) is over 4 hours, the six hour window for E. coli processing did not allow this size range to be collected by pipette analysis when transport of samples and the enumeration processing time was taken into account. Therefore, further research would enhance results to pinpoint whether E. coli prefer particle sizes less than 0.002 mm. and the range of sediment.
5. ACKNOWLEDGEMENTS
Funding was provided by the South Carolina Certified Erosion Prevention and Sediment Control Inspection Program. Permission to access ponds was allowed by the City of Anderson and Anderson County School District 5.
REFERENCES
- Davies, C.M. and Bavor, H.J. (2000) The fate of stormwater-associated bacteria in constructed wetland and water pollution control pond systems. Journal of Applied Microbiology, 89, 349-360. doi:10.1046/j.1365-2672.2000.01118.x
- Zhang, X. and Lulla, M. (2006) Distribution of pathogenic indicator bacteria in structural best management practices. Journal of Environmental Science and Health Part A, 41, 1421-1436. doi:10.1080/10934520600753971
- South Carolina Department of Health and Environmental Control (2005) Stormwater Management BMP Handbook. http://www.scdhec.gov/environment/ocrm/docs/BMP_Handbook/BMP_Handbook.pdf
- Sawyer, C.B. (2009) Characterization of Escherichia coli related to construction site sediment basins. Ph.D. Thesis, Clemson University, Clemson.
- Craig, D.L., Fallowfield H.J. and Cromar, N.J. (2002) Enumeration of faecal coliforms from recreational coastal sites: Evaluation of techniques for the separation of bacteria from sediments. Journal of Applied Microbiology, 93, 557-565. doi:10.1046/j.1365-2672.2002.01730.x
- Burton, G.A., Gunnison, D. and Lanza, G.R. (1987) Survival of pathogenic bacteria in various freshwater sediments. Journal of Applied and Environmental Microbiology, 53, 633-638.
- Jolley, L.W. (2005) The interactions of indicator bacteria and sediments in fresh water streams. Ph.D. Thesis, Clemson University, Clemson.
- South Carolina Health and Environmental Control (2008) The state of south Carolina’s 2008 integrated report, part I: Listing of impaired waters. http://www.scdhec.gov/environment/water/tmdl/docs/tmdl_08-303d.pdf
- Ishii, S. and Sadowsky, M.J. (2008) Escherichia coli in the environment: Implications for water quality and human health. Microbes and Environment, 23, 101-108. doi:10.1264/jsme2.23.101
- Millen, J.A., Jarret, A.R. and Faircloth, J.W. (1997) Experimental evaluation of sedimentation basin performance for alternative dewatering systems. Transactions of the ASAE, 40, 1087-1095.
- American Public Health Association (2005) Standard methods for the examination of water and waste water. 21st Edition, American Public Health Association, Washington DC.
- IDEXX (2011) Scientific basis: How colilert works. http://www.idexx.com/view/xhtml/en_us/water/colilert.jsf#Science