Advances in Bioscience and Biotechnology
Vol.3 No.3(2012), Article ID:19879,12 pages DOI:10.4236/abb.2012.33025
Molecular dynamics simulations of a DNA photolyase protein: High-mobility and conformational changes of the FAD molecule at low temperatures
![]()
1Laboratory of Radiation Biology, Joint Institute for Nuclear Research, Dubna, Russia
2Dubna University, Dubna, Russia
3Institute of Nuclear Physics, Tashkent, Uzbekistan
4Department of Mechanical Engineering, Keio University, Yokohama, Japan
Email: *mirzo@jinr.ru
Received 4 February 2012; revised 23 March 2012; accepted 19 April 2012
Keywords: Molecular Dynamics Simulations; DNA Photolyase; Conformation Change; FAD; MTHF; DNA
ABSTRACT
A molecular dynamics (MD) simulation is performed on a DNA photolyase to study the conformational behavior of the photoactive cofactor flavin adenine dinucleotide (FAD) inside the enzyme pocket. A DNA photolyase is a highly efficient light-driven enzyme that repairs the UV-induced cyclobutane pyrimidine dimer in damaged DNA. In this work, the FAD conformational and dynamic changes were studied within the total complex structure of a DNA photolyase protein (containing FADH–, MTHF, and DNA molecules) embedded in a water solvent. We aimed to compare the conformational changes of the FAD cofactor and other constituent fragments of the molecular system under consideration. The obtained results were discussed to gain insight into the light-driven mechanism of DNA repair by a DNA photolyase enzyme—based on the enzyme structure, the FAD mobility, and conformation shape.
1. INTRODUCTION
One of the most common lesions of living organisms induced by the UV irradiation of DNA—causing a number of harmful effects, such as growth delay, mutagenesis, and cell death—is a photoreaction of pyrimidine bases [1]. In particular, thymine dimers (T<>T, cyclobutane pyrimidine dimers (CPDs)) could be formed after photon absorption by a thymine monomer, followed by its excitation state and subsequent reaction with an adjacent thymine molecule. Another type of DNA damage is the formation of the pyrimidine-pyrimidone (6-4) photo-product (T[6-4]T) [1-3]. Both of these lesions are repaired by DNA photolyases—enzyme proteins with similar structures and reaction mechanisms. The DNA photolyase enzyme repairs UV-induced DNA damage by splitting the ring of the predominant photoproduct—the cis,synCPD—into the corresponding pyrimidine monomers [1- 7]. Thus, DNA photolyase is also a DNA repair enzyme.
Photolyases are monomeric proteins of 450-550 amino acids and two noncovalently bound chromophore cofactors (in Figures 1(a) and (b)), the top and side views of the protein are shown, respectively). One of the cofactors is always FAD (flavin adenine dinucleotide; Figure 1(c)), and the second is either MTHF (methenyltetrahydrofolate; Figure 1(d)) or 8-HDF (8-hydroxy-7,8-didemethyl-5-deazari-boavin). The latter, MTHF or 8-HDF, acts as a photoantenna and transfers excitation energy to the catalytic FADH- cofactor through non-radiative Forster resonance energy transfer (FRET)—via a dipole—dipole coupling between folate and flavin [1-12]. It is worth noting that the unique FAD-binding domain with its high degree of sequence identity in the environment forms a family of highly homologous photolyase/cryptochrome proteins. From bacteria to mammals, these two types of proteins carry out distinct functions: photolyase harnesses blue light energy to break bonds and repair UV photoproducts in DNA; and cryptochrome is a sensor of environmental light-regulating circadian entrainment in animals and plants [11].
The FAD is an essential cofactor for both specifically binding to damaged DNA and catalysis. The second chromophore (MTHF or 8-HDF) is not necessary for catalysis and has no effect on specific enzyme—substrate binding. The conformational behavior of the FAD molecule is very important for understanding the functional and structural properties of the DNA repair protein

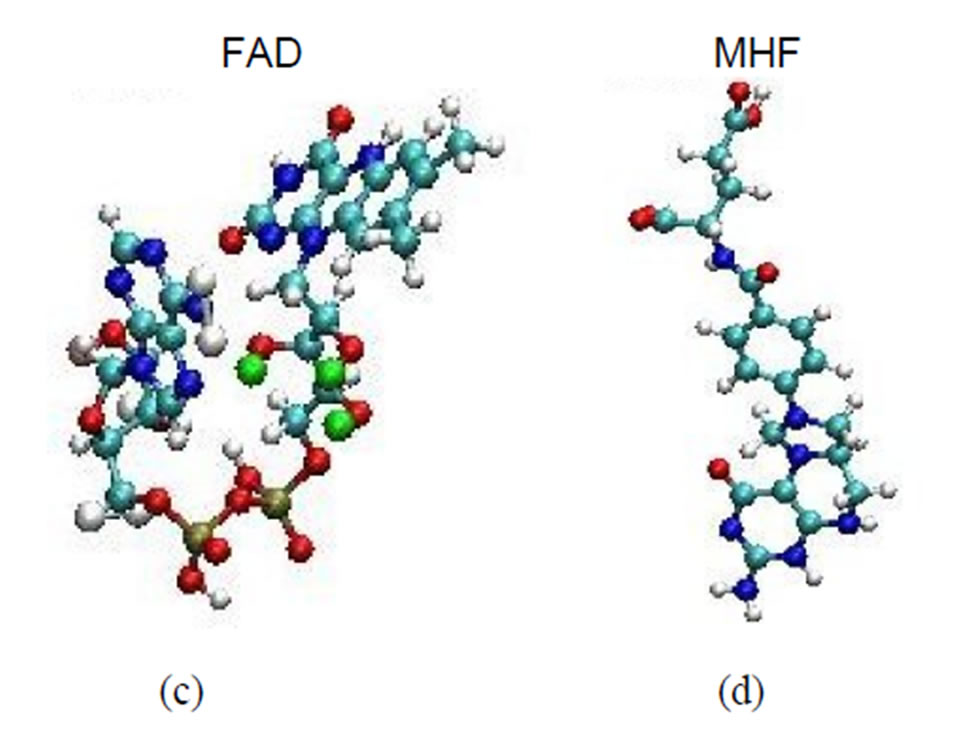
Figure 1. The ribbon structures of a DNA photolyase protein ((a) Top view; (b) Side view) with two cofactors and the DNA chain are shown. The FADH- (center; FAD) and MTHF (top; MHF) cofactors and DNA (right) are shown as spherical balls. Below, the structures of FADH- and MTHF are shown separately (c) and (d). E. coli photolyase is composed of two well-defined domains: an N-terminal (residues 1 - 131) and a C-terminal (residues 204 - 471), which are connected to one another with a long interdomain loop (residues 132 - 203).
photolyase. Knowing the FAD actual conformation can provide insight into the light-driven DNA repair by the DNA photolyase enzyme.
The conformational peculiarities of the photoactive cofactor FAD were the subject of special interest and were investigated in several studies [9-16]. The X-ray structure analysis of DNA photolyase reveals the Ushaped conformation of the FAD molecule [3]. Based on the molecular dynamics (MD) method, the FAD structure conformation was studied in the gas phase and water in [9-13]. It was found that the FAD molecule could have both “open” I-shaped and “closed” U-shaped conformations. The FAD conformation behavior correlates with DNA photolyase mobility, which is a problem of modern research. In paper [3], using crystal structure coordinates of the substrate-free enzyme from Escherichia coli, docking a thymine dimer to the photolyase catalytic site was studied. The molecular dynamics of the system was estimated, and the electron-transfer matrix element between the lowest unoccupied molecular orbitals of flavin and the dimer was calculated. The crystal structure of a DNA photolyase reported in [4] was found to bind to duplex DNA, which is bent by 50˚ and forms a synthetic CPD lesion. This CPD lesion is flipped into the active site and split thereby into two thymines by synchrotron radiation at 100K. In [5], two photolyase-related proteins —PhrA and PhrB—were found to exist in the phytopathogen Agrobacterium tumefaciens. It was shown experimentally [6] that photoreactivation prevents UV mutagenesis in a broad range of species. Studies of the Cry-DASH proteins from bacteria, plants, and animals [7] show that they are all actually photolyases with a high degree of specificity for cyclobutane pyrimidine dimers in ssDNA. Despite being tightly wrapped in apo-GOx by non-bonded interaction forces, including vdW forces, and the electrostatic interaction [8], the FAD molecule still exhibits great mobility in the apo-GOx tunnel. A number of structural parameters, including distances, angles and dihedrals, were introduced in this study to describe the fine structure features and evaluate the mobility of FAD. In [10], the extended FAD molecule also shows a mobility gradient between the very rigid flavin (the mean value of áBñ = 8.7 Å2) and the more mobile adenine (the mean value of áBñ = 16.2 Å2). The entire active center is particularly well ordered, with temperature factors around 10 Å2.
In the present work, the FAD conformational and dynamic behaviors were studied in the whole DNA photolyase enzyme structure. Unlike the earlier works mentioned above, our study simulates the complex structure of the DNA photolyase protein, containing FADH-, MTHF and DNA molecules, and embedded in different water solvent baths. Based on the molecular dynamics (MD) simulation, we aimed to compare the conformational changes of the FAD cofactor with the constituent fragments of the molecular system under consideration.
2. MATERIALS AND METHODS
All simulations were performed with the AMBER (versions 8 to 11) MD software package for studying biomolecules [17,18]. The molecular complex of the DNA photolyase protein (containing FADH- and MTHF) and DNA molecules placed in its vicinity were solvated with two water models (Table 1 and Figures 2(a), (b)). Correspondingly, two calculation methods (no-cutoff and cutoff algorithms) were employed. In a periodic simulation, the electrostatic interactions were treated with the Particle Mesh Ewald (PME) algorithm [17-20]. Non-

Table 1. The parameters of water solvation models and calculation methods for the electrostatics interactions.
 (a)
(a) (b)
(b)
Figure 2. The DNA photolyase protein, containing cofactors FADH- (FAD) and MTHF (MHF) and DNA molecule, solvated by periodic (a) and non-periodic (b) water baths.
periodic MD simulation involved cutoff algorithm. The Cornell et al. all-atom force field was used in the MD simulations [21,22]. To build the Amber parameter/topology input files for the protein, FADH- (FAD), MTHF (MHF) (Tables 2 and 3), and DNA molecules, the LEaP basic preparation program was used. The atomic charges were provided by the AM1-BCC charge model of the Antechamber program; the combinations of CHARMM and “general Amber force field (GAFF)” parameters provide the charges closely to the data from [9]; for creating the missing force field parameters, the Parmchk program was used. All systems were solvated with TIP3P molecules [23] produced in a rectangular (periodic) and spherical (non-periodic) water baths. The temperature was kept constant by using the Berendsen algorithm [24]. Only bond lengths involving hydrogen atoms were constrained using the SHAKE method [25]. The results of simulations and images of the simulated proteins were analyzed using the RasMol [26], MOLMOL [27], and Visual Molecular Dynamics (VMD) [28] software.
MD Protocol
It should be stressed that we mainly focused on a lowtemperature regime. We have simulated the behavior of the molecular system under consideration at temperatures T = [50 - 250] K, where the protein, DNA, and water structures remain close to a crystalline state (which is far enough from the liquid phase).
Below, an example of the MD protocol for the periodic PME-NVT simulation is presented:
Potential function:
ntf = 1, ntb = 1, igb = 0, nsnb = 1, ipol = 0, gbsa = 0, iesp = 0, dielc = 1.0, cut = 10.0, intdiel = 1.0, scnb = 2.0, scee = 1.2.
Molecular dynamics:
nstlim = 10000, nscm = 2, nrespa = 1, t = 0.0, dt = 0.001.
Berendsen temperature regulation:
temp0 = 200.0, tempi = 0.0, tautp = 0.2.
SHAKE:
ntc = 2, jfastw = 0, tol = 0.00001.
Ewald parameters:
verbose = 0, ew_type = 0, nbflag = 1, use_pme = 1 Box X = 103.066, Box Y = 83.512, Box Z = 96.459 Alpha = 90.0, Beta = 90.0, Gamma = 90.0 NFFT1 = 108, NFFT2 = 90, NFFT3 = 100 Cutoff = 10.0, Tol = 0.100E–04 Ewald Coefficient = 0.27511.
3. RESULTS AND DISCUSSION
The dynamical changes were traced within a long-nano-
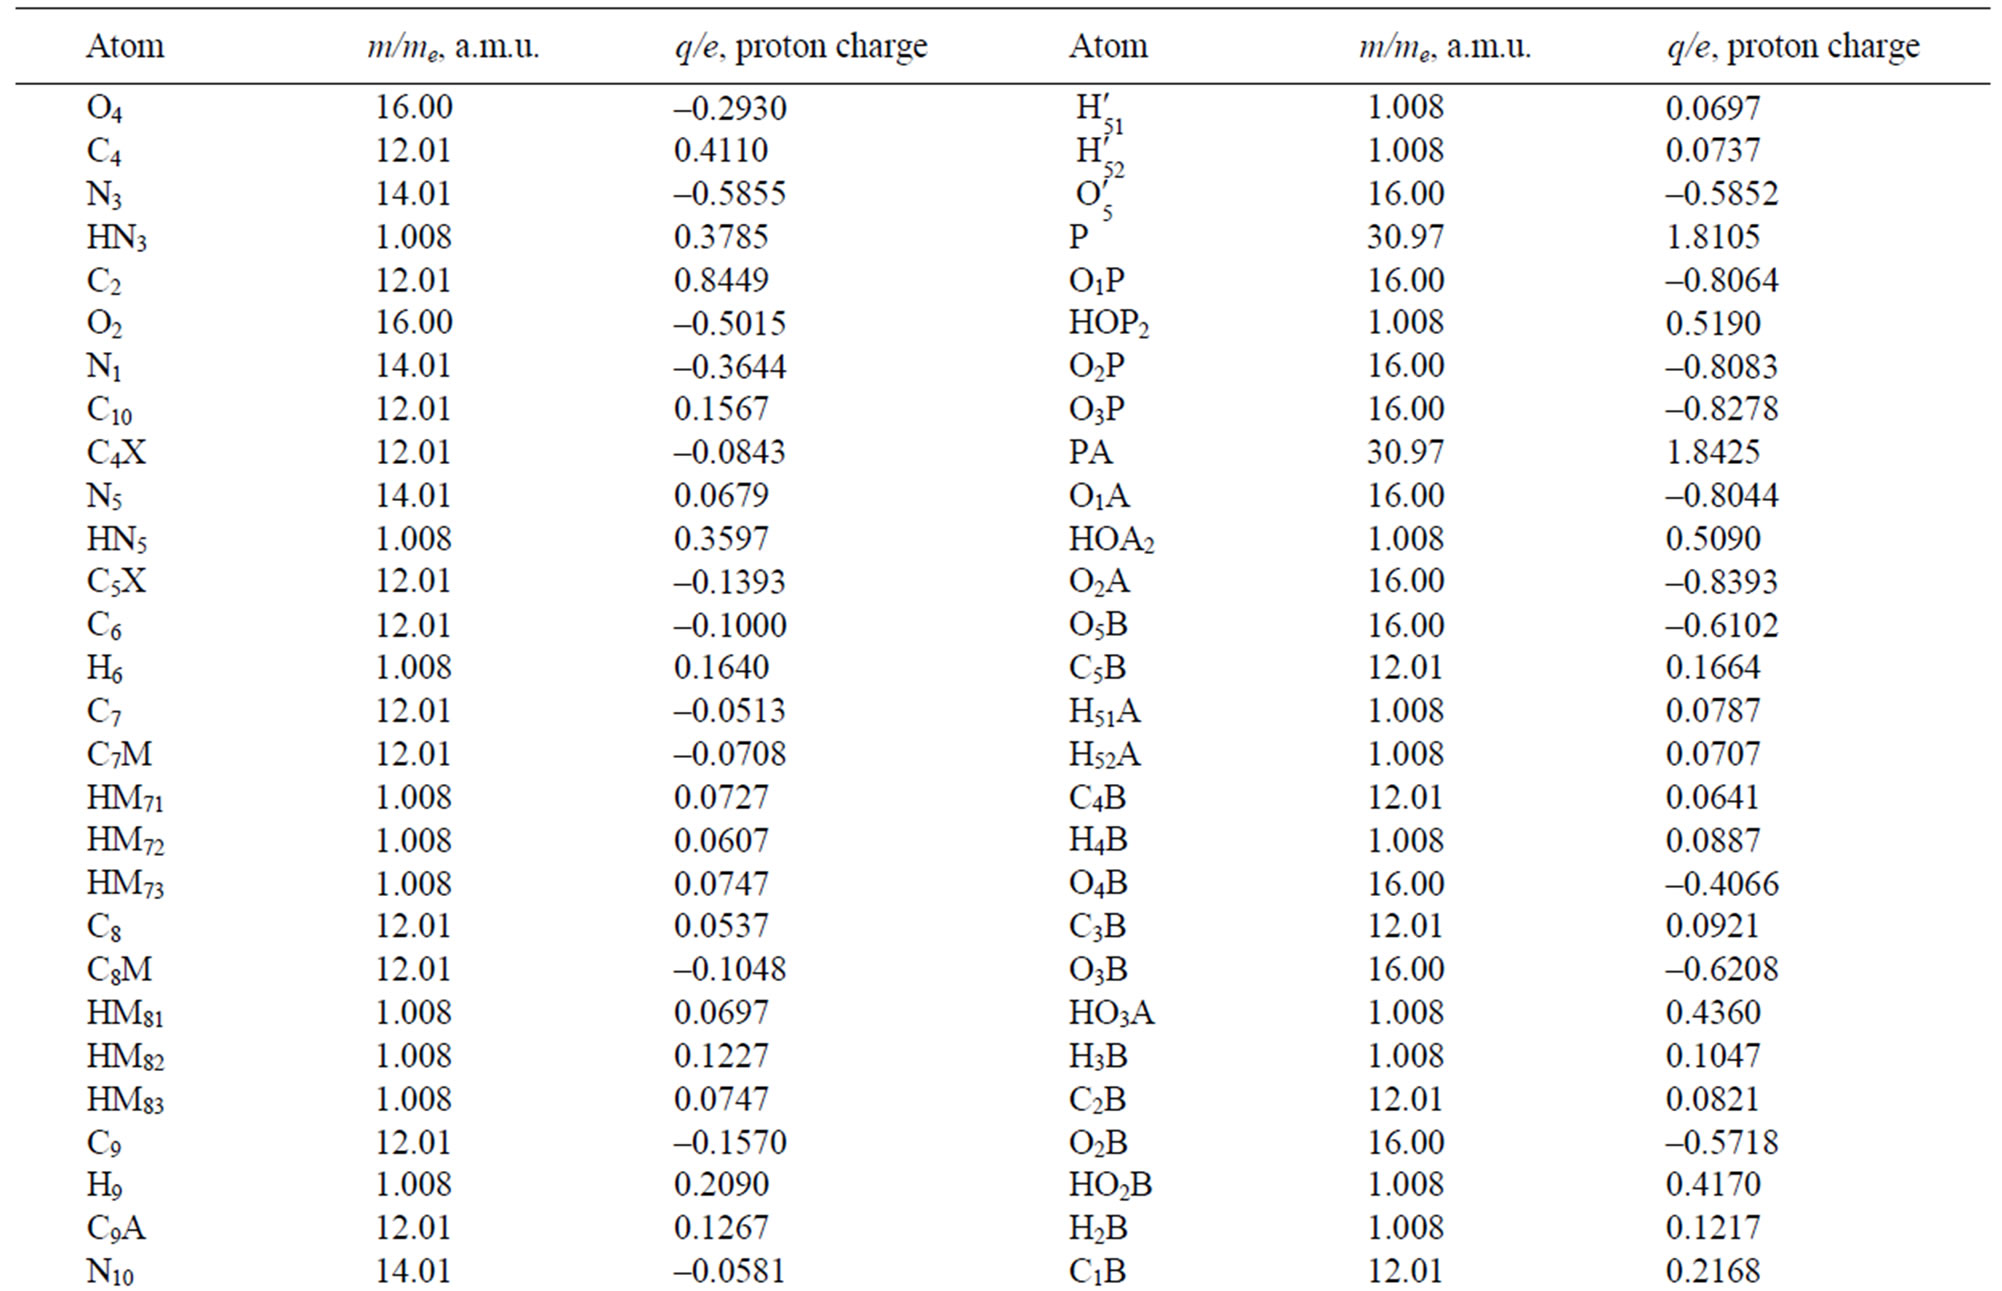
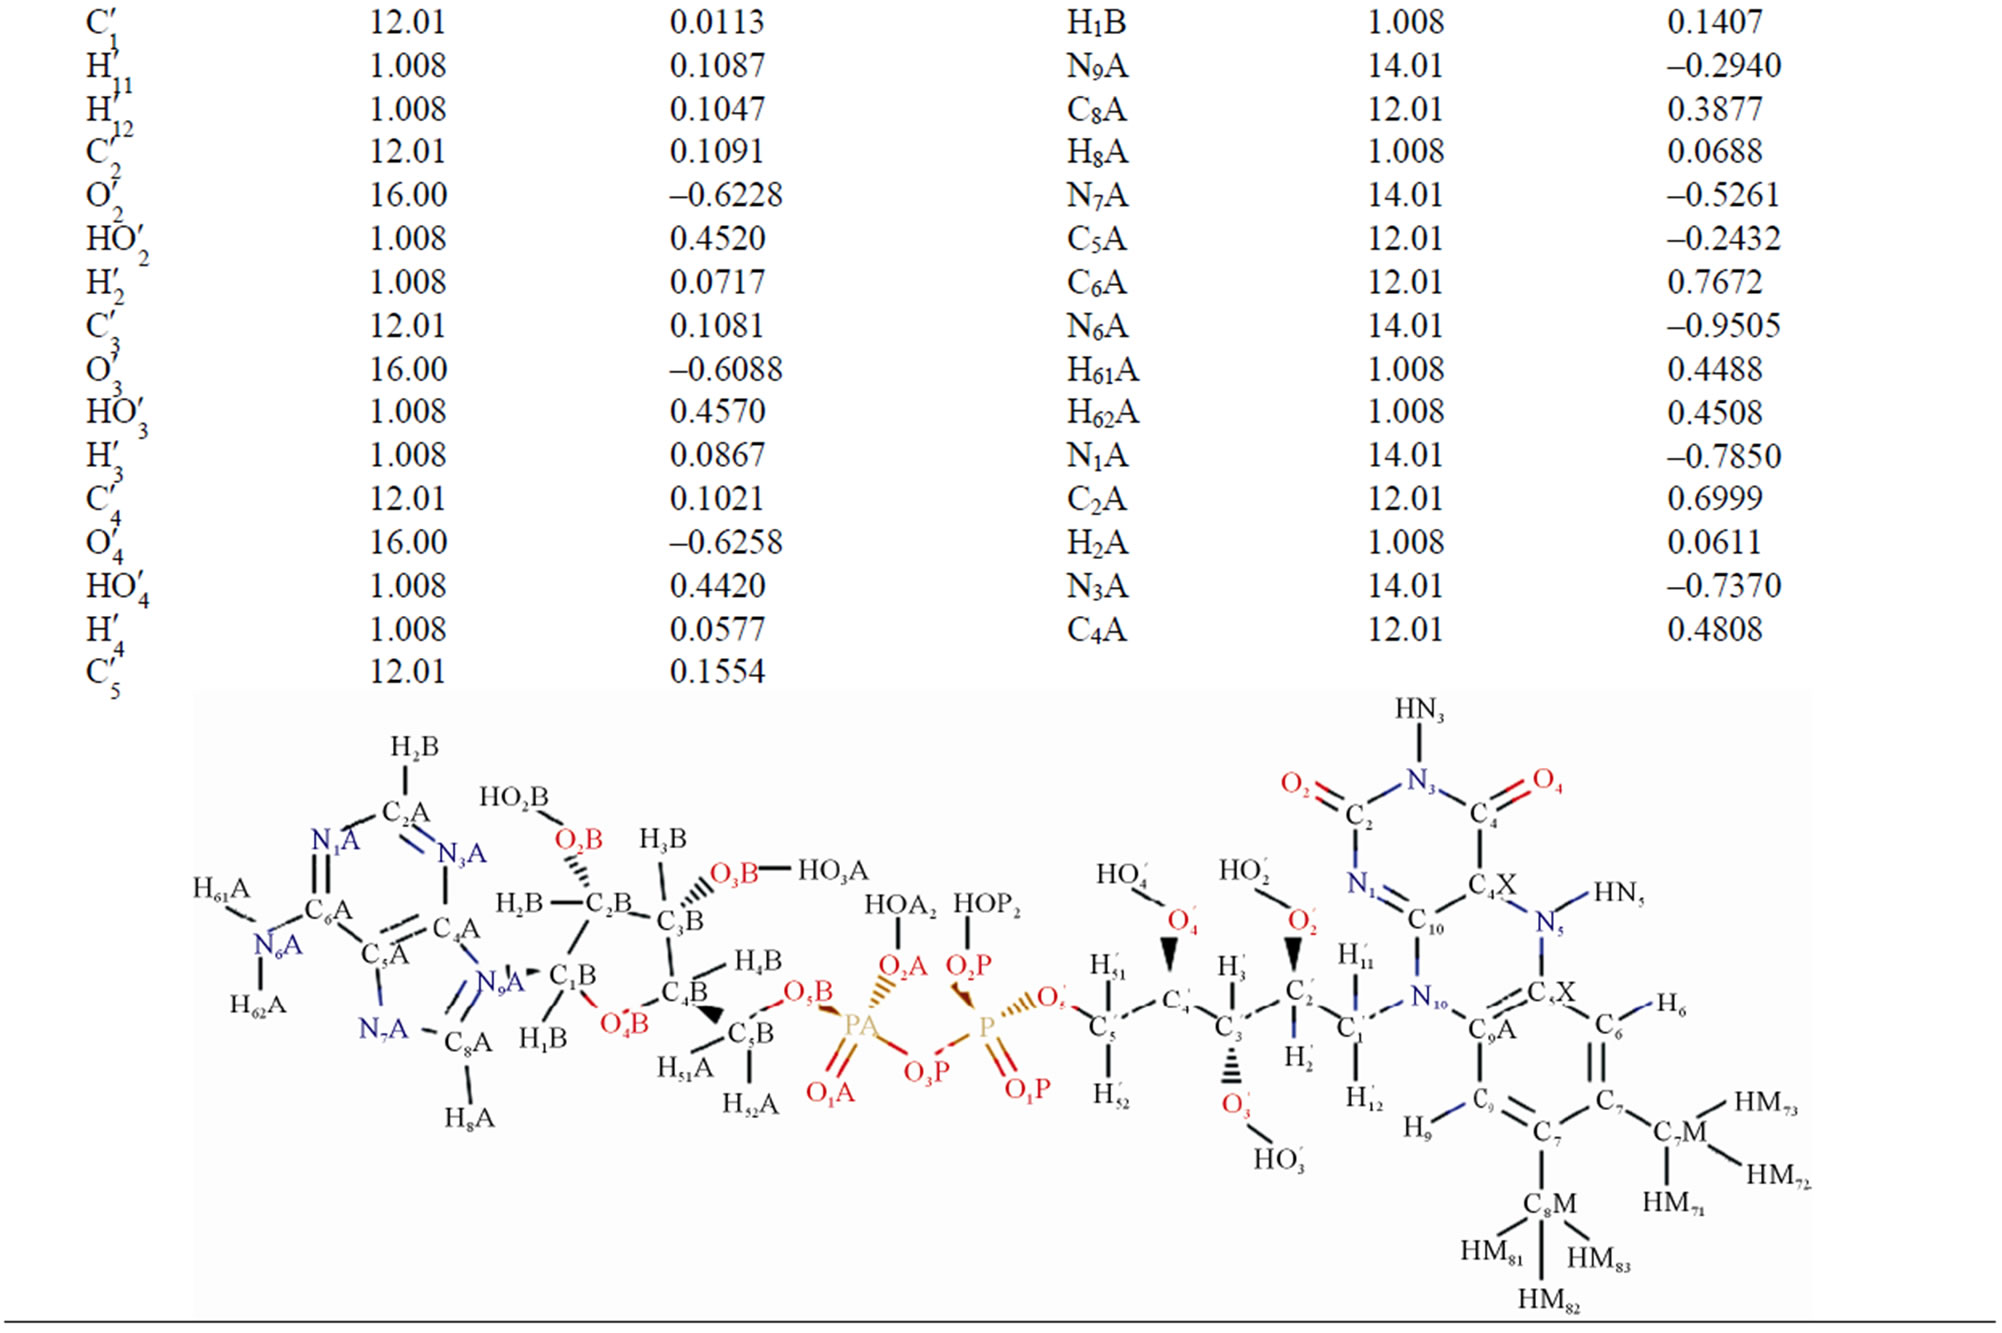
Table 2. The masses and charges of FADH- (FAD) molecule with its schematic diagram.
second time scale in the molecular system under consideration: a photolyase enzyme, two cofactors (FADH- and MTHF) fitted into the pocket, and DNA chain located in the vicinity of the enzyme; surrounded by water mole-
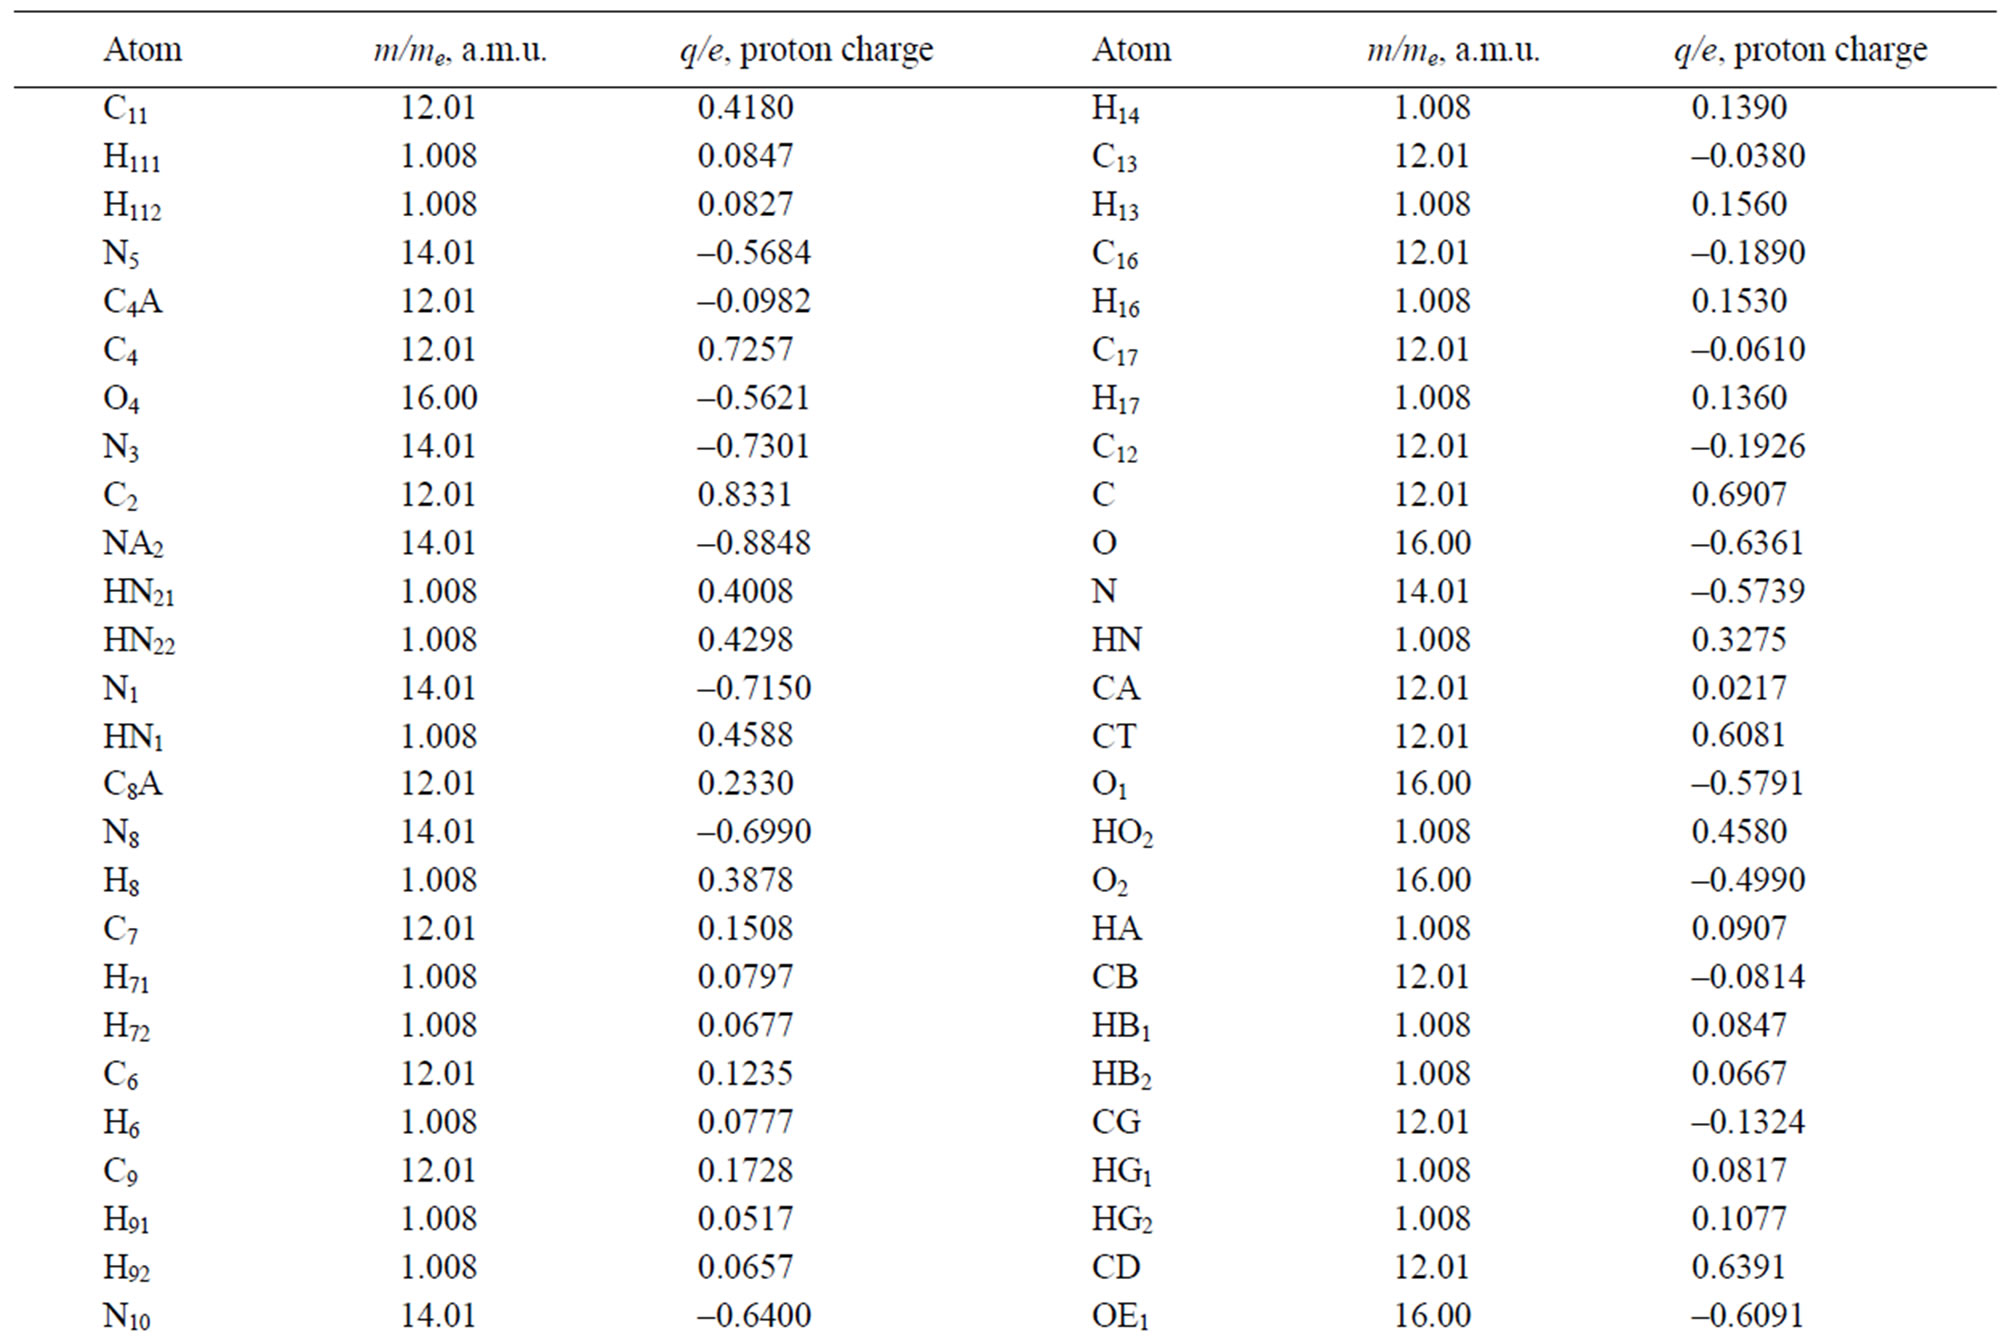

Table 3. The masses and charges of MTHF (MHF) molecule with its schematic diagram.
cules filling up the entire system as shown in Figures 2(a) and (b). To compare the conformational changes of the components of the simulated system, we introduced four distances as shown in Figure 3.
Several amino acid residues as shown in Figure 3 are located in the protein regions interacting with the FADH- (FAD), MTHF (MHF) and DNA molecules; so the behavior of d1 - d4 (t) will demonstrate their relative positional changes with time.
First, a diagram of the distance between the ASN108 protein amino acid residue and MTHF molecule (Figure 4) is presented. We have estimated the distances between the carbon atom (CD) of the MTHF molecule and other heavy atoms: the nitrogen (N) atom, two carbon (CA,
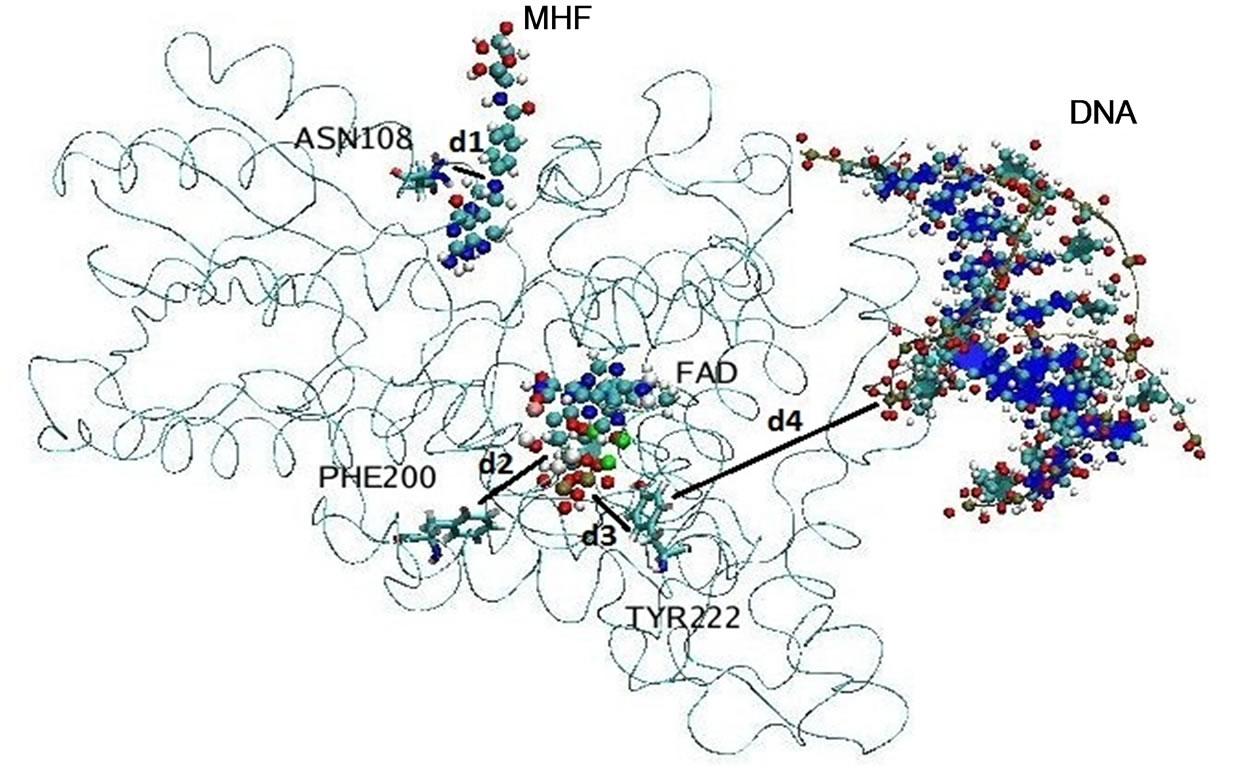
Figure 3. The location of the components of the simulated molecular system (the ribbon structure denotes the photolyase enzyme; spherical balls—FADH- (FAD) and MTHF (MHF) cofactors; and ribbon and balls—the DNA chain). Four distances d1 - d4 were introduced to compare the positional changes of different parts of the system during long-nanosecond dynamics.

Figure 4. d1 distance diagram showing the positional changes between the ASN108 amino acid residue and MTHF (MHF) molecule during dynamical changes.
CB), and oxygen (O) atoms of the ASN108 amino acid residue. Figure 4 shows that during a long dynamics simulation, the d1 distance [MHF-ASN108] does not change visibly.
The initial distances were as follows:
d1 [MHF(CD) – ASN108(N)] = 12.1 Å,
d1 [MHF(CD) – ASN108(CA)] = 11.8 Å,
d1 [MHF(CD) – ASN108(CB)] = 12.0 Å,
d1 [MHF(CD) – ASN108(O)] = 13.4 Å.
All the d1 vary negligibly around their initial values. In other words, at low temperatures the MTHF molecule remains frozen inside the enzyme’s pocket during the whole simulation period.
Next, Figures 5 and 6 show diagrams of the d2 [FAD–
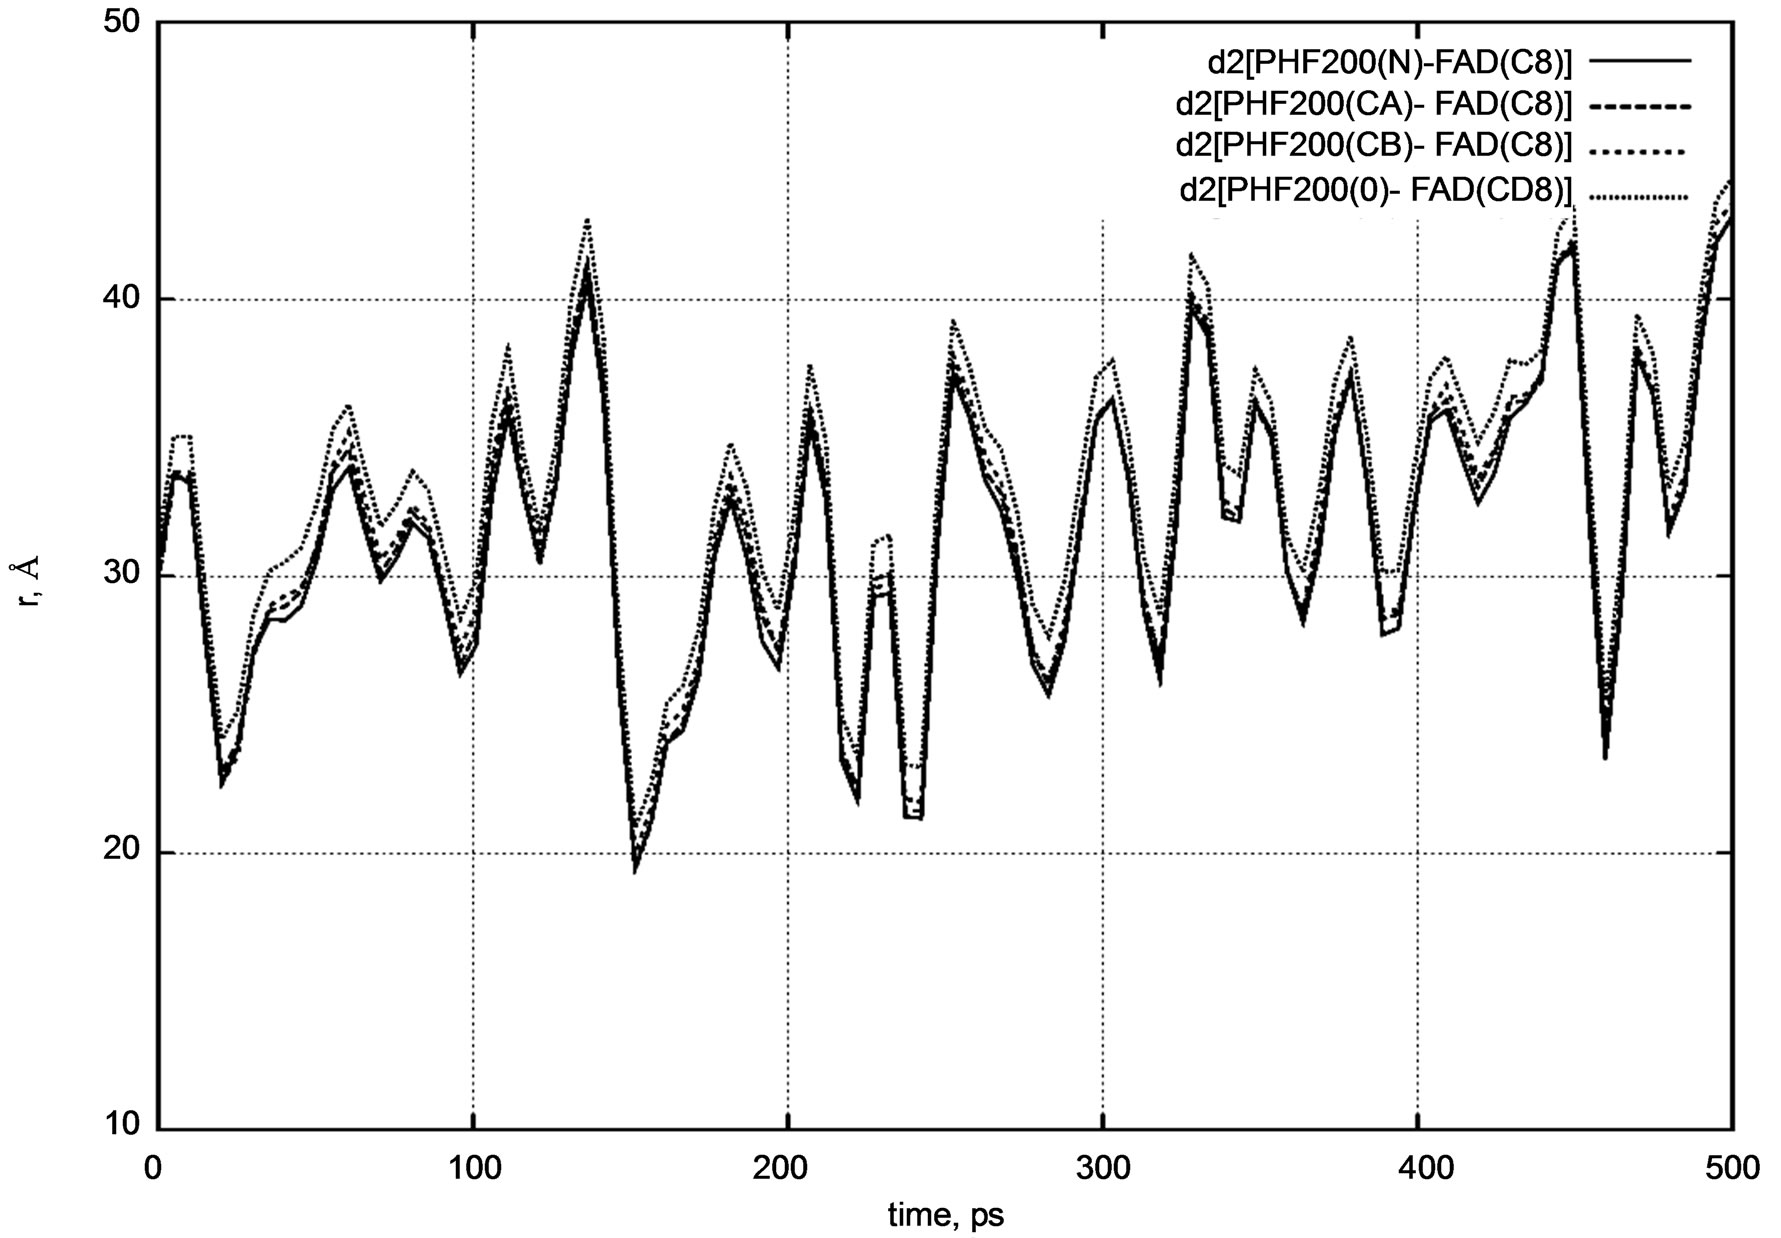
Figure 5. d2 distance diagram showing the positional changes between the PHE200 amino acid residue and FADH- (FAD) molecule during a long nanosecond MD simulation.
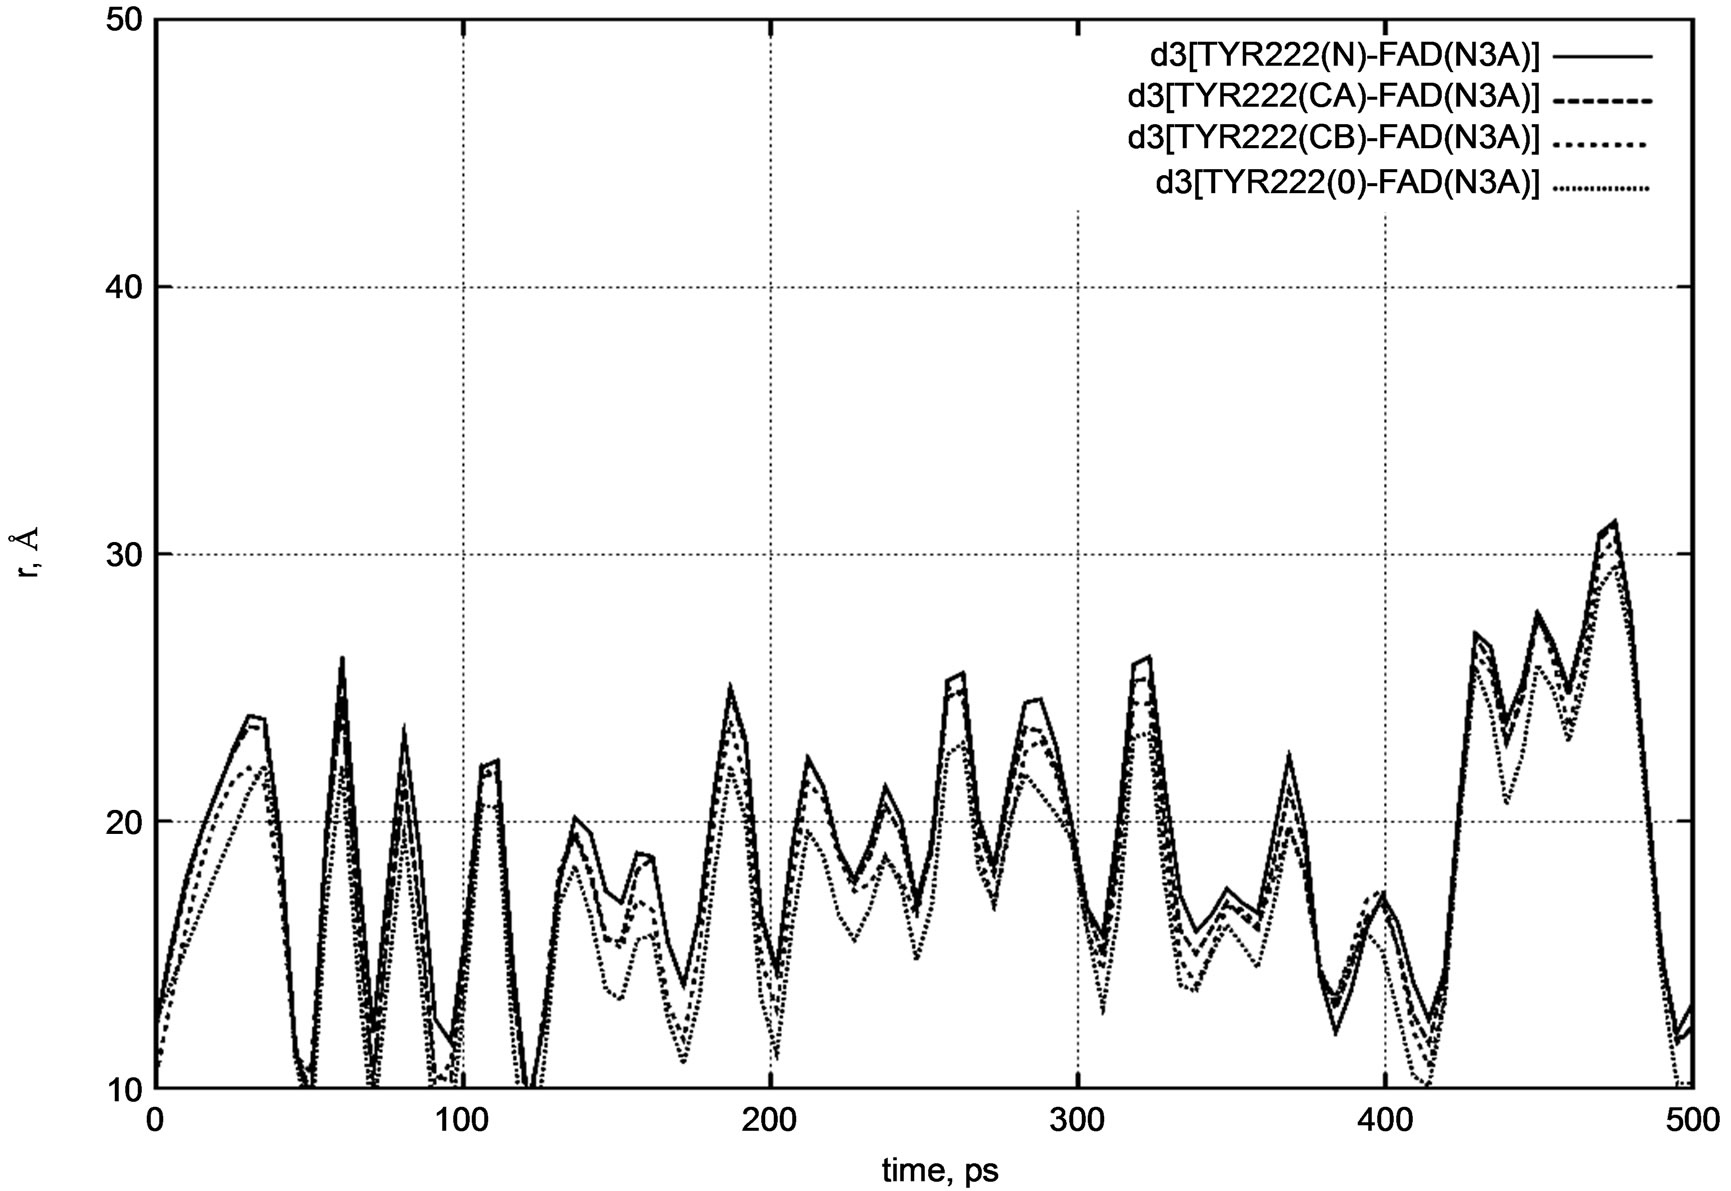
Figure 6. d3 distance diagram showing the positional changes between the TYR222 amino acid residue and FADH- (FAD) molecule during a long nanosecond MD simulation.
PHE200] and d3 [FAD – TYR222] distances for the positional changes of the PHE200 and TYR222 amino acid residues relative to the FADH- molecule. The PHE200 and TYR222 residues symmetrically surround the FADH- molecule on two sides. For PHE200, we calculated the distances between the carbon atom (C8) of FADH- and the nitrogen (N) atom, two carbon (CA, CB), and oxygen (O) atoms.
The initial distances were as follows:
d2 [FAD(C8) – PHE200(N)] = 30.0 Å,
d2 [FAD(C8) – PHE200(CA)] = 29.7 Å,
d2 [FAD(C8) – PHE200(CB)] = 29.8 Å,
d2 [FAD(C8) – PHE200(O)] = 31.1 Å.
Similarly, for the TYR222 residue we calculated the distances between the nitrogen atom (N3A) of FADH- and the same atoms as for PHE200.
The initial distances were as follows:
d3 [FAD(N3A) – TYR222(N)] = 12.3 Å,
d3 [FAD(N3A) – TYR222(CA)] = 12.2 Å,
d3 [FAD(N3A) – TYR222(CB)] = 10.0 Å,
d3 [FAD(N3A) – TYR222(O)] = 12.6 Å.
Both distance diagrams in Figures 5 and 6 clearly show the oscillating behavior of the FAD molecule. In other words, FAD mobility inside the enzyme’s pocket looks very high. The DNA photolyase itself (viz., PHE200 and TYR222 amino acid residues) shows negligibly small vibration as the system temperature is still low.
Next, we calculated the positional changes of the DNA chain, which is located in a close contact region with the photolyase protein. Figure 7 presents a d4 distance diagram [DNA – TYR222] for the TYR222 amino acid residue position relative to the DNA molecule.
The initial distances were as follows:
d4 [DNA(P) – TYR222(N)] = 37.4 Å,
d4 [DNA(P) – TYR222(CA)] = 38.5 Å,
d4 [DNA(P) – TYR222(CB)] = 38.2 Å,
d4 [DNA(P) – TYR222(O)] = 40.1 Å.
From Figure 7 it is easy to see that the DNA position relative to the protein segment (viz. TYR222) does not change visibly during a long period of dynamical changes. The distance diagram in Figure 7 also supports our previous observations.
The distance diagrams are summarized separately in Figure 8. The comparisons of the d1 - d4 (t) dynamics indicate different relative mobility and positional changes of the DNA photolyase fragments. The structural behavior of the DNA photolyase (with FAD and MTHF cofactors) simulated at the temperatures T = 50 K, 100 K, 150 K, 200 K, and 250 K unambiguously shows a high mobility of the FAD molecule inside the enzyme’s pocket. At the simulated temperatures, protein parts (MTHF and the DNA chain) as well as water molecules have very low dynamic mobility and show a slow structural movement. At the same time, even starting from low temperatures, the FAD molecule demonstrates relatively fast dynamics and undergoes rapid structural
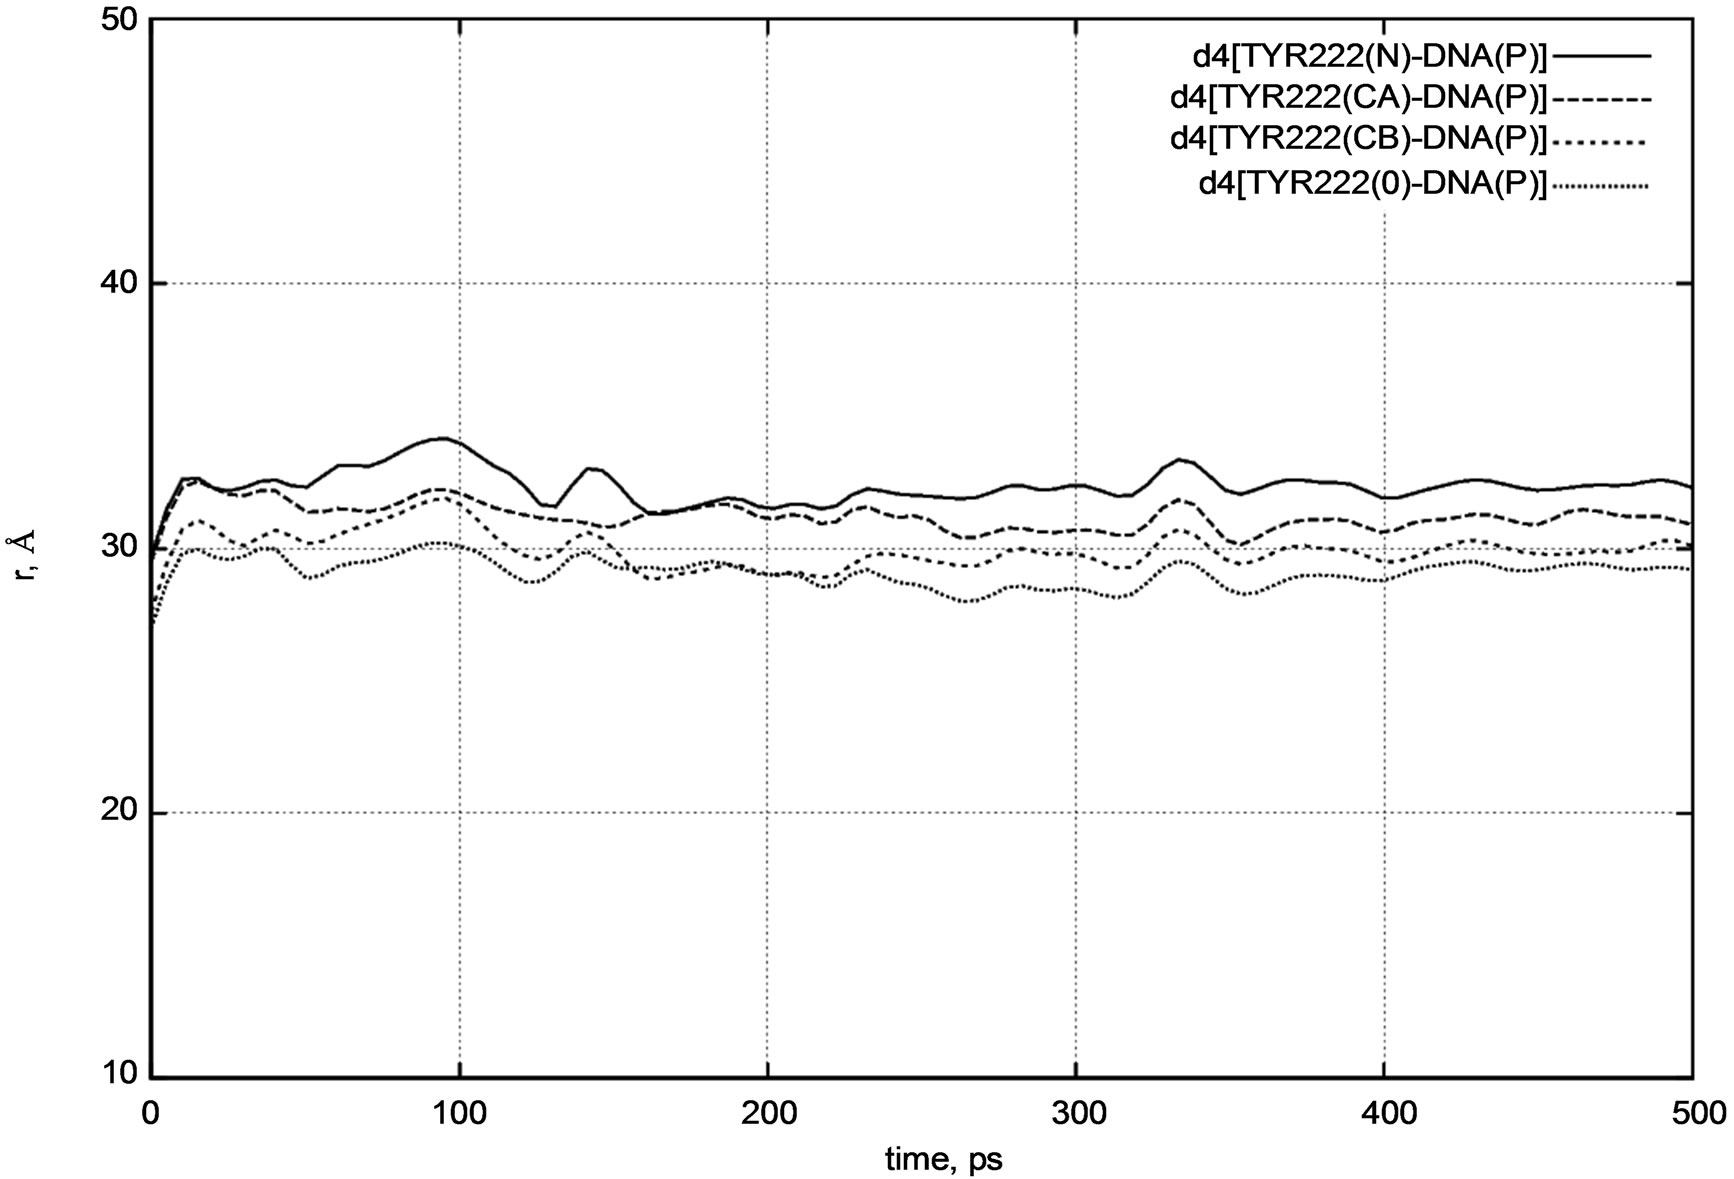
Figure 7. d4 distance diagram showing the positional changes of the TYR222 amino acid residue and DNA molecule.

Figure 8. d1 - d4 distance diagram showing the positional changes in the photolyase protein molecular complex interacting with the DNA chain.
changes. It is worth noting that in [14] a similar structural behavior of the FAD molecule at low temperatures was observed for another type of a protein complex, namely, for Fre—the NAD(P)H:flavin oxidoreductase. In more detail, the average positions of the nearby TYR35, TYR72, TYR116, and FAD were compared in [14]. Figure 1 [14] shows that the atomic trajectories and center-to-center distances between three TYR residues and the FAD isoalloxazine ring also indicate high FAD high mobility at low temperatures.
In Figure 9, the dynamic molecular surfaces of the MHF, DNA, and FAD molecules are compared. It is clear that the MTHF and DNA molecules undergo negligible configuration changes; MTHF and DNA remain in a frozen state at a low temperature. At the same time, the FAD configuration changes periodically throughout the simulation period, tending from the “closed” U-shaped to the “open” I-shaped one (Figure 9: from top to bottom). Such FAD configuration behavior looks like “butterfly motion” [9,14]. It should be stressed that the transition from the U-shaped configuration, the FAD’s original one revealed by X-ray structure analysis, to the I-shaped configuration results in the FAD molecule not being allowed to stay more inside the enzyme pocket. Obviously, the DNA photolyase enzyme cannot properly locate FAD’s I-shaped configuration and keep FAD at a binding site.
The FAD chromophore binding inside the DNA photolyase pocket has many similarities with 11-cis retinal chromophore in opsin proteins [29-35]. Opsins are expressed in rods and cones in the back (outer) part of the retina; photolyase/cryptochrome proteins are expressed in the front (inner) part of the retina. Opsins initiate phototransduction by cis-trans isomerization of retinal by light; the transition from 11-cis to all-trans puts 11-cis retinal out of the protein binding. Thus, all-trans retinal behaves like I-shaped FAD and cannot be allowed to stay any longer inside the chromophore pocket. On the other hand, the FAD chromophore, as its form changes from the “closed” U-shaped to the “open” I-shaped, should also leave the protein. Thus, two photosensory systems in mammals—the 3D visual system and the circadian photosensory system, are correlated by their chromophores. We should note that for the opsin + retinal photoreceptors, the signal phototransduction mechanism is already known; for the cryptochromes (circadian photoreceptors with the folate (MTHF) and flavin (FAD) chromophores), the phototransduction mechanism is still unknown [1].
4. CONCLUSION
MD simulations were performed on the DNA photolyase
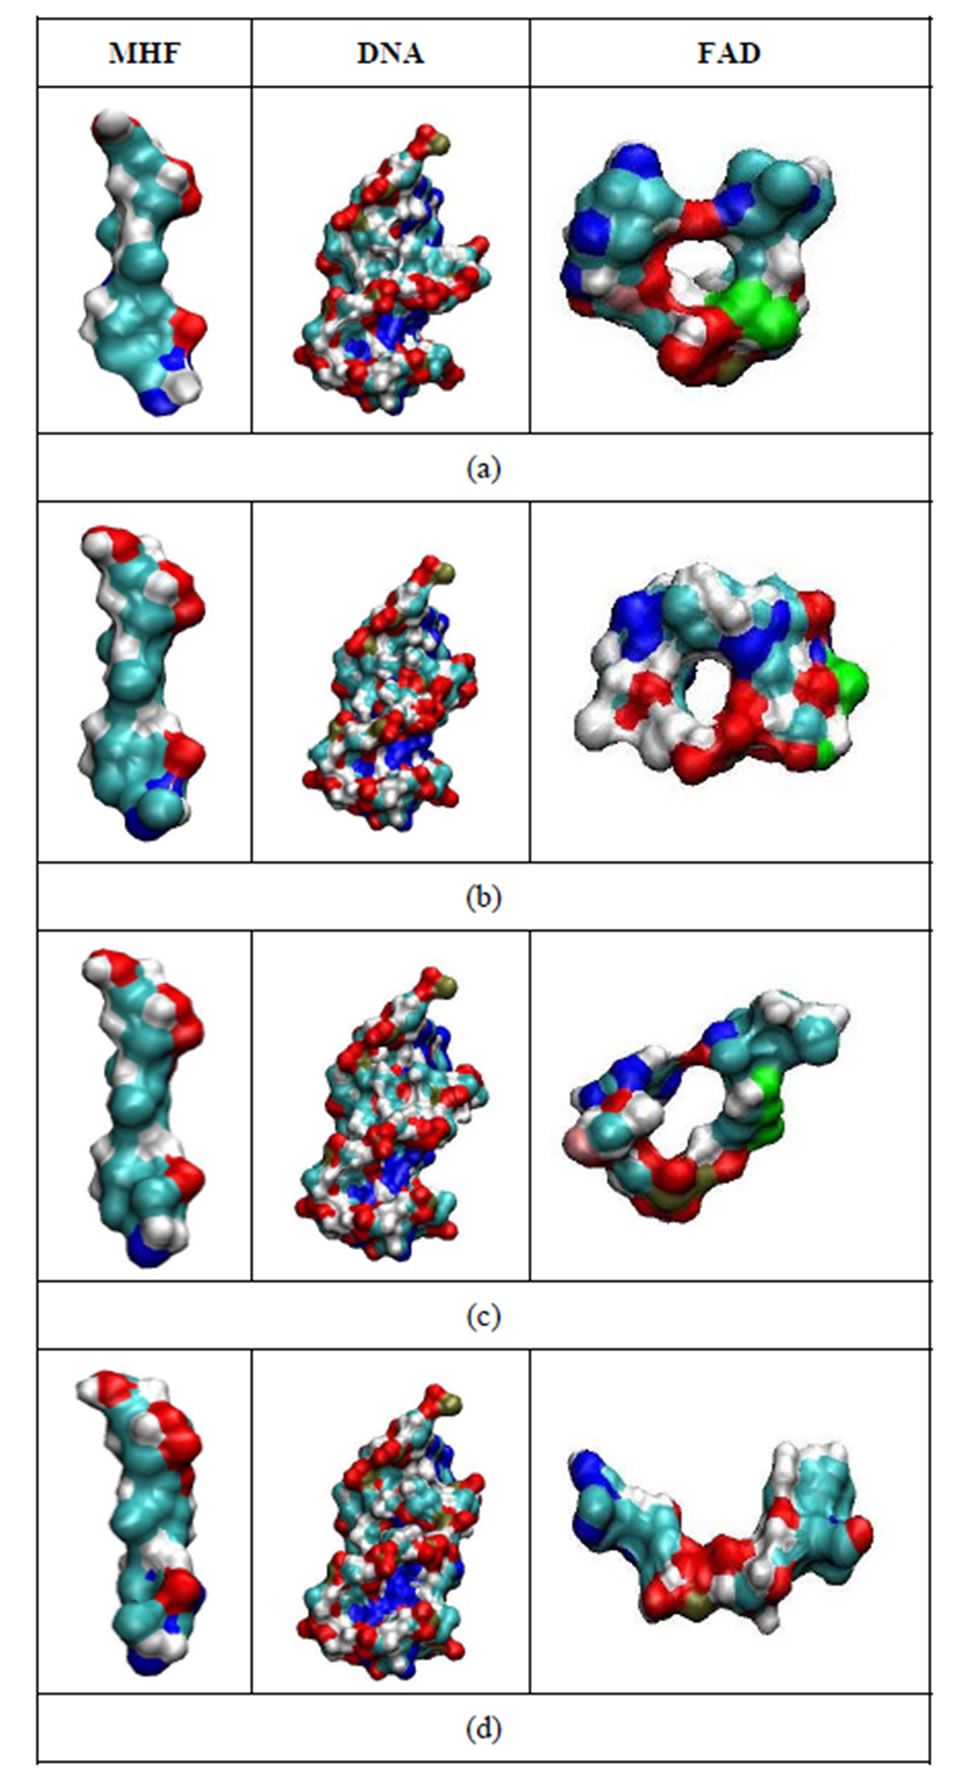
Figure 9. The configurational shapes of the MTHF (left; MHF), DNA (middle) and FADH- (right; FAD) molecules at t = 0 (a); 200 ps (b); 300 ps (c) and 500 ps (d) states of the relaxed DNA photolyase protein.
enzyme structure with two chromophore cofactors (FADH- and MTHF), which are required for the enzyme functioning. FAD is essential for both specific binding to damaged DNA and catalysis. In a long nanosecond scale, dynamical changes were traced in a molecular system consisting of the photolyase enzyme, FAD and MTHF cofactors fitted into the enzyme’s pocket, and a DNA chain located in the vicinity of the enzyme; the system was solvated with different water models. The structural behavior of the DNA photolyase (with FAD and MTHF cofactors) were simulated at low temperatures from T = 50 K to 250 K. The distance diagrams for the key fragments of the DNA photolyase were built, and the comparison of the positional dynamics indicates different relative mobility. The FAD molecule has relatively high mobility inside the enzyme’s binding pocket. The dynamic molecular surfaces of the MHF, DNA, and FAD molecules reveal transition of the FAD conformation from a “closed” U-shaped to an “open” I-shaped one. Such behavior of FAD inside the DNA photolyase enzyme can be an important factor for this enzyme binding to UV-damaged DNA and the following DNA repair mechanism. Similarities were discussed between the two photosensory systems: the visual pigment rhodopsin providing 3D vision and the photolyase/cryptochrome proteins responsible for the circadian function. Their structure correlations were found to be based on the similarities between the FAD chromophore binding inside the DNA photolyase pocket and 11-cis retinal binding inside the opsin’s chromophore center.
5. ACKNOWLEDGEMENTS
This work has been performed within a research collaboration between JINR (Russia) and Keio University (Japan). The work has been supported in part by the Grant in Aid for the Global Center of Excellence Program to the Center for Education and Research of Symbiotic, Safe and Secure System Design from Japan’s Ministry of Education, Culture, Sport, and Technology. The MD simulations have been performed using computing facilities, software, and clusters at JINR, Russia (CICC); RIKEN, Japan (RICC); and the Yasuoka Laboratory at Keio University, Japan. We thank Prof. Vladimir Korenkov (LIT, JINR) for providing us with computer time at CICC and Prof. Evgeny Krasavin (LRB, JINR) for his encouraging support. The authors would like to specially thank Mr. Sergei Negovelov (JINR) for technical assistance and helpful comments.
REFERENCES
- Sancar, A. (2003) Structure and function of DNA photolyase and cryptochrome blue-light photoreceptors. Chemical Reviews, 103, 2203-2237. doi:10.1021/cr0204348
- Tamada, T., Kitadokoro, K., Higuchi, Y., Inaka, K., Yasui, A., de Ruiter, P.E., Eker, A.P. and Miki, K. (1997) Crystal structure of DNA photolyase from Anacystis nidulans. Nature Structural & Molecular Biology, 4, 887-891. doi:10.1038/nsb1197-887
- Antony, J., Medvedev, D. and Stuchebrukhov, A. (2000) Theoretical study of electron transfer between the photolyase catalytic cofactor FADH– and DNA thymine dimmer. Journal of American Chemical Society, 122, 1057-1065. doi:10.1021/ja993784t
- Mees, A., Klar, T., Gnau, P., Hennecke, U., Eker, A.P.M., Carell, T. and Essen, L.-O. (2004) Crystal structure of a photolyase bound to a CPD-like DNA lesion after in situ repair. Science, 306, 1724. doi:10.1126/science.1101598
- Oberpichler, I., Pierik, A., Wesslowski, J., Pokorny, R., Rosen, R., Vugman, M., Zhang, F., Neubauer, O., Ron, E., Batschauer, A. and Lamparter, T. (2011) A photolyaselike protein from Agrobacterium tumefaciens with an ironsulfur cluster. PLoS ONE, 6, e26775. doi:10.1371/journal.pone.0026775
- Lucas-Lledó, J.I. and Lynch, M. (2009) Evolution of mutation rates: Phylogenomic analysis of the photolyase/ cryptochrome family. Molecular Biology and Evolution, 26, 1143-1153. doi:10.1093/molbev/msp029
- Selby, C.P. and Sancar, A. (2006) A cryptochrome/ photolyase class of enzymes with single-stranded DNAspecific photolyase activity. PNAS, 103, 17696-17700. doi:10.1073/pnas.0607993103
- Liu, F., Ye, X.-S., Wu, T., Wang, C.-T., Shen, J.-W. and Kang, Y. (2008) Conformational mobility of GOx coenzyme complex on single-wall carbon nanotubes. Sensors, 8, 8453-8462. doi:10.3390/s8128453
- Hahn, J., Michel-Beyerle, M.-E. and Rösch, N. (1998) Conformation of the flavin adenine dinucleotide cofactor FAD in DNA-Photolyase: A molecular dynamics study. Journal of Molecular Modeling, 4, 73-82. doi:10.1007/s008940050133
- Karplus, P.A. and Schulz, G.E. (1987) Refined structure of glutathione reductase at 1.54 Å resolution. Journal of Molecular Biology, 195, 701-729. doi:10.1016/0022-2836(87)90191-4
- Thompson, C.L. and Sancar, A. (2002) Photolyase/cryptochrome blue-light photoreceptors use photon energy to repair DNA and reset the circadian clock. Oncogene, 21, 9043-9056. doi:10.1038/sj.onc.1205958
- Verma, P.K. and Pal, S.K. (2010) Ultrafast resonance energy transfer in bio-molecular systems. The European Physical Journal D, 60, 137-156. doi:10.1140/epjd/e2010-00107-7
- Park, H.-W., Kim, S.-T., Sancar, A. and Deisenhofer, J. (1995) Crystal structure of DNA photolyase from Escherichia coli. Science, 268, 1866. doi:10.1126/science.7604260
- Luo, G.B., Andricioaei, I., Xie, X.S. and Karplus, M., (2006) Dynamic distance disorder in proteins is caused by trapping. Journal of Physical Chemistry B, 110, 9363- 9367. doi:10.1021/jp057497p
- Wang, Y., Gasper, P.P. and Taylor, J.S. (2000) Quantum chemical study of the electron-transfer-catalyzed splitting of oxetane and azetidine intermediates proposed in the photoenzymatic repair of (6 - 4) photoproducts of DNA. Journal of American Chemical Society, 122, 5510. doi:10.1021/ja992244t
- Masson, F., Laino, T., Rothlisberger, U. and Hutter, J. (2009) A QM/MM investigation of thymine dimer radical anion splitting catalyzed by DNA Photolyase. Chemical Physics and Physical Chemistry, 10, 400-410.
- Pearlman, D.A., Case, D.A., Caldwell, J.W., Ross, W.R., Cheatham, T.E., DeBolt, S., Ferguson, D., Seibel, G. and Kollman, P. (1995) AMBER, a computer program for applying molecular mechanics, normal mode analysis, molecular dynamics and free energy calculations to elucidate the structures and energies of molecules. Computer Physics Communications, 91, 1-41. doi:10.1016/0010-4655(95)00041-D
- Case, D.A., Cheatham, T., Darden, T., Gohlke, H., Luo, R., Merz, K.M. Jr., Onufriev, A., Simmerling, C., Wang, B. and Woods, R. (2005) The Amber biomolecular simulation programs. Journal of Computational Chemistry, 26, 1668-1688. doi:10.1002/jcc.20290
- Essmann, U., Perera, L., Berkowitz, M.L., Darden, T., Lee, H. and Pedersen, L.G. (1995) A smooth particle mesh Ewald method. Journal of Chemical Physics, 103, 8577-8592. doi:10.1063/1.470117
- Kholmurodov, K., Smith, W., Yasuoka, K., Darden, T. and Ebisuzaki, T.J. (2000) A smooth-particle mesh Ewald method for DL_POLY molecular dynamics simulation package on the Fujitsu VPP700. Journal of Computational Chemistry, 21, 1187-1191. doi:10.1002/1096-987X(200010)21:13<1187::AID-JCC7>3.0.CO;2-7
- Ponder, J.W. and Case, D.A. (2003) Force fields for protein simulations. Advances in Protein Chemistry, 66, 27- 85. doi:10.1016/S0065-3233(03)66002-X
- Cornell, W.D., Cieplak, P., Bayly, C.I., Gould, I.R., Merz, K.M. Jr., Ferguson, D.M., Spellmeyer, D.C., Fox, T., Caldwell, J.W. and Kollman, P.A. (1995) A second generation forth field for the simulation of proteins and nucleic acids. Journal of American Chemical Society, 117, 5179-5197. doi:10.1021/ja00124a002
- Jorgensen, W.L., Chandrasekhar, J. and Madura, J.D. (1983) Comparison of simple potential functions for simulating liquid water. Journal of Chemical Physics, 79, 926- 935. doi:10.1063/1.445869
- Berendsen, H.J.C., Postma, J.P.M., van Gunsteren, W.F., DiNola, A. and Haak, J.R. (1984) Molecular dynamics with coupling to an external bath. Journal of Chemical Physics, 81, 3684-3690. doi:10.1063/1.448118
- Ryckaert, J.P., Ciccotti, G. and Berendsen, H.J.C. (1997) Numerical integration of the Cartesian equations of proteins and nucleic acids. Journal of Computational Physics, 23, 327-341. doi:10.1016/0021-9991(77)90098-5
- Sayle, R.A. and Milner-White, E.J. (1995) RasMol: Biomolecular graphics for all. Trends in Biochemical Sciences, 20, 374-376. doi:10.1016/S0968-0004(00)89080-5
- Koradi, R., Billeter, M. and Wuthrich, K. (1996) MOLMOL: A program for display and analysis of macromolecular structure. Journal of Molecular Graphics, 4, 51- 55. doi:10.1016/0263-7855(96)00009-4
- Humphrey, W., Dalke, A. and Schulten, K. (1996) VMD —Visual molecular dynamics. Journal of Molecular Graphics, 14, 33-38. doi:10.1016/0263-7855(96)00018-5
- Mirzadegan, T., Benko, G., Filipek, S. and Palczewski, K. (2003) Sequence analyses of G-protein-coupled receptors: Similarities to rhodopsin. Biochemistry, 42, 2759-2767. doi:10.1021/bi027224+
- Gether, U. and Kobilka, B.K. (1998) G protein-coupled receptor. The Journal of Biological Chemistry, 273, 17979- 17982. doi:10.1074/jbc.273.29.17979
- Palczewski, K., Kumasaka, T., Hori, T., Behnke, C.A., Motoshima, H., Fox, B.A., Le Trong, I., Teller, D.C., Okada, T., Stenkamp, R.E., Yamamoto, M. and Miyano, M. (2000) Crystal structure of rhodopsin: A G proteincoupled receptor. Science, 289, 739-745. doi:10.1126/science.289.5480.739
- Okada, T., Sugihara, M., Bondar, A.-N., Elstner, M., Entel, P. and Buss, V. (2004) The retinal conformation and its environment in rhodopsin in light of a new 2.2 Å crystal structure. Journal of Molecular Biology, 342, 571-583. doi:10.1016/j.jmb.2004.07.044
- Salgado, G.F.J., Struts, A.V., Tanaka, K., Fujioka, N., Nakanishi, K. and Brown, M.F. (2004) Deuterium NMR structure of retinal in the ground state of rhodopsin. Biochemistry, 43, 12819-12828. doi:10.1021/bi0491191
- Teller, D.C., Okada, T., Behnke, C.A., Palczewski, K. and Stenkamp R.E. (2001) Advances in determination of a high-resolution three-dimensional structure of rhodopsin, a model of G-protein-coupled receptor (GPCRs). Biochemistry, 40, 7761-7772. doi:10.1021/bi0155091
- Kholmurodov, Kh.T., Feldman, T.B. and Ostrovskii, M.A. (2007) Molecular dynamics of rhodopsin and free opsin: Computer simulation. Neuroscience and Behavioral Physiology, 37, 161-174. doi:10.1007/s11055-007-0164-7
NOTES
*Corresponding author.

