Modern Economy
Vol.5 No.4(2014), Article ID:44520,13 pages DOI:10.4236/me.2014.54027
CSR Actions and Financial Distress: Do Firms Change Their CSR Behavior When Signals of Financial Distress Are Identified?
Arjola Mecaj, María Isabel González Bravo
Department of Business Administration, University of Salamanca, Salamanca, Spain
Email: arjolam@usal.es, lola@usal.es
Copyright © 2014 by authors and Scientific Research Publishing Inc.
This work is licensed under the Creative Commons Attribution International License (CC BY).
http://creativecommons.org/licenses/by/4.0/


Received 6 February 2014; revised 6 March 2014; accepted 13 March 2014
ABSTRACT
Many studies have focused on the relation between financial and economic performance of firms and their actions on corporate social responsibility (CSR). However, few of them analyze CSR actions of firms facing decline. The purpose of this paper is to analyze if a recognized situation of financial distress has an impact on CSR strategies and modifies the attitude of a set of firms towards responsible behavior. We use CSR information of healthy and distressed US firms, during the years 2001-2007, to evidence feasible changes in CSR attitudes induced by distress position. The results show that healthy firms present changes in all the year windows analyzed while distressed firms tend to increase their concern valuation or reduce their strength valuation one year after identifying the symptoms of economic and financial weaknesses. However, these differences do not occur in all the dimensions of CSR, when considered separately.
Keywords:Corporate Social Responsibility, Financial Distress, Multidimensional Scaling, Wilcoxon Test, Mann-Whitney Test

1. Introduction
The accounting information evidencing certain financial distress situation constitutes a relevant alert signal when the investors assess the survival status of a firm. When a crisis situation comes about during the lifecycle of a firm, it is fundamental to maintain the support and trust of the shareholders. Prahalad and Hamel [1] consider that good corporate social behaviors can assure firm’s future success enhancing the support and the confidence of the stakeholders. In this line, we can raise the following question: Can responsible behavior act as a mitigation factor of the firms’ ongoing concern when certain financial distress situation takes place? If CSR investment creates firm reputation for stakeholders, allowing to contribute on the honesty and reliability of the firm [2] [3] , then it can mitigate the image offered by the deteriorated financial statements and add financial value to the firm.
Several studies have shown that social responsible companies are well valued by the market [4] -[9] . Investment in responsible behaviors can be understood as a “product” offered to investors, some of which are willing to buy although it may imply a reduction in the present value of cash flow or obtain less profit compared to non-responsible firms [10] . These firms receive the support of investors in return as reward of the value attributed to the actions that satisfy stakeholders.
CSR practices have an added value in assessing the future of the firm in terms of competitiveness, efficiency and even survival, making the companies more attractive to investors [11] . Information related to responsible behavior of companies complements the financial information, allowing valuing a firm from a wider perspective. CSR actions would modify the expectations generated from the financial data of a firm by the returns or detriments derived from socially responsible actions [7] . If this change of expectations is assumed, it can be considered that in front of negative messages from the financial statements, the information about responsible behaviors contains that complementary feature. In fact, some studies [12] [13] associate CSR with distress risk of a firm, attesting a robust negative relationship between the two concepts. However, a clear demonstration on the fact that CSR investment reduces the distress risk could not be established.
Some researches affirm that firm’s historical financial performance contributes to the current CSR investments, according to the reverse-causality relationship between both terms [14] [15] . This approach has been supported by considering that good financial results allow redirecting excessive resources towards social activities. This means that good financial performance derives in social responsible practices, thus, influencing CSR profiles. However, it can be questioned to what extent poor financial performance could incentivize the managers towards these practices as a way to add confidence to the value of the firm. In this sense, Goss [13] affirms that CSR investments are like good managers practices, which imply an investment in the future results of financially distressed firms. This approach supports the line followed by Lee et al. [16] , when considering that firms make use of CSR as a legitimate instrument to influence the perceptions of stakeholders. In this same line, Ho and Taylor [17] consider the existence of incentives to emit social information by the firms showing a poor performance, and encounter a significant and negative relationship between social and environmental information and profit results.
The purpose of this study is to analyze if a recognized situation of financial distress has an impact on CSR strategies and modifies the attitude of a set of firms towards responsible behavior. To achieve this objective, we selected a sample of healthy and distressed US firms, classified according to the fulfillment of certain distress conditions widely used in the literature, during the years 2001 to 2007.
2. CSR Profiles and Financial Distress
2.1. Diminishing the Perceived Risk Approach
Various research defend that CSR practices reduce the perceived risk of a firm [11] [18] -[23] . Strengthening the corporate image, by increasing the reputation towards the stakeholders, mitigates the risk such that responsible behavior is converted to better discount rate and lower cost of capital [11] [16] [20] [22] [24] . This advantage in the cost of funding is evidenced in studies such as Goss [12] where poor CSR performing firms support higher debt costs. Firms are no strangers to this relationship given that, as Devinney [21] affirms, one of the reasons why firms and their managers are involved in CSR initiatives is the impact on the risk.
Firms facing some kind of financial distress situation transmit risks to investors, who will be cautious in the moment they contribute funds to the company. CSR actions could help mitigate the perceived financial risk by modifying the future expectations and image of the firm by acting on what we may call liability risk and the risk of economical-vulnerability.
Regarding liability risk, and according to the social-sanction theory, a firm misbehaving within de norms and mores of the societies in which they operate are sensible to claims and social demands [21] . CSR actions ensure the fulfillment of social responsibilities managing the legal and reputational risk [25] [26] , associated to losses that would occur towards a non-responsible behavior [27] [28] and minimizing transaction cost and potential conflicts with stakeholders [29] . The increase or decrease of this possible future responsibility risk is discounted by investors when valuing a firm. The ethical behavior becomes an intangible asset which will be used in the investors’ valuation so that they will be penalized or rewarded depending on their perception [9] . The market attractiveness of socially acceptable behavior is evidenced by Iannou and Serafeim [30] , who investigate how investment analysts perceive CSR strategies carried out by the companies and how they react to these strategies by issuing investment recommendations. The ethical investments approach, selecting firms according to social and environmental practices besides financial data [9] [31] is also representative of this approach. On the other side, the penalty of the market to those firms not valued positively in social indexes [32] produces negative effects on investors’ predictions of future earnings. This adverse behavior of investors towards the risk of liability is easily verified in the market reaction to certain “greening” behaviors as authors Cormier and Magnan [33] , Konar and Cohen [5] , Hassel et al. [34] or Wahba [35] suggest. This fact can be explained by the positive relation that exists between environmental liability cost and negative reputation and the relation of these latter with profitability [36] .
Moreover, the risk of economical-vulnerability is related to the capacity of a firm to align with its environment. Fittest firms have greater chance to survive in a continuing competitive context by constantly adapting themselves to the environment. Socially responsible practices permit the improvement of competitive power of a firm, creating opportunities to generate economic benefits and differentiate the company form its competitors [20] [37] . Well performing firms become less vulnerable to afford adverse situations or decline phases, reducing the risk of not overcoming these situations. In this way, CSR practices generate cost reduction, increase employees’ productivity, generate profit by product diversity, increase sales and generate brand value, building a stronger performing firm [5] [11] [28] [29] [36] [38] -[40] . Additionally, certain CSR programs are drivers of customer satisfaction [15] and produce positive effects on customers’ attitude towards a product [41] , allowing an identification with the firm which converts to an important support to it [42] [43] . To wager on client support means to bet for the future. For a firm facing a situation of financial distress this bet could be a signal of warranty of the weak financial statements, allowing that a bad economic performance could be restored.
If investors are cautious in the presence of the financial risk of a firm, the mitigating factors of an a priori unattractiveness for the investors are determined by the possible effects that a CSR investment could have on firm’s performance [6] . We could expect that managers of financially distressed firms could be incentivized to perform greater efforts in CSR behaviors in order to mitigate the bad financial results, securing the trust and support of stakeholder when the survival of the firm could be compromised. Based on the above approach, we propose the following general hypothesis:
H1: Despite of the associated costs, distressed companies tend to invert, or maintain their investment in CSR actions in order to compensate their weak financial image.
In particular, deriving from this first hypothesis, we will also test:
H1.1: Despite of the associated costs, distressed companies tend to invert, or maintain their investment in those CSR actions that have a direct repercussion on profit generation, so that they can restore their delicate economic situation.
2.2. Cost-Reduction Approach
The nonexistence of a consensus on the research focusing on the relationship between financial performance and corporate social performance allows assessing the existence of a bidirectional relation between these two concepts. In this way, an increase in social performance could be also interpreted as a discretional activity that is financed when the firm has an excess of funds, that is, a good financial performance given by revenues that exceed expenses [14] [44] . Under this approach lies the consideration that socially responsible activities imply a non-necessary cost for a firm’s activity. Following the cost-concerned theory, responsible actions imply costs that reduce the possible profit of a company [45] and this fact does not contribute to enhancing the shareholder value [16] . This negative consideration of investment in CSR will be reflected in a lower market value of firm, as shareholder expectative on future returns decreases [46] [47] . This hypothesis is in line with the results obtained by Lo and Sheu [9] which indicate that investors can be reluctant towards CSR actions of a firm if they consider that these actions increase operational and production costs and decrease sales. These shareholders consider CSR actions as an unnecessary agency cost in spite of increasing the image of the company [48] [49] .
This issue is more obvious in some of the dimensions of the social responsible behaviors, which involve economic outlays with an immediate impact on the income, making it difficult to estimate the possible impact on the generation of future profits. This is the case of, for instance, environmental actions, which, according to Palmer et al. [50] some firms are not willing to undertake as they do not want to sacrifice their profits for the environmental protection. These actions will cause the firm to incur in certain costs which will not be rewarded by investors, so that they have to be considered by the managers when valuing this strategy [35] . In this direction, Hassel et al. [34] obtain results that evidence that better valued firms on an environmental point of view, are not the better valued firms by investors.
In the short run, the politics that wager on responsible social and environmental behavior increase the costs, and as a consequence, influence in a direct way the financial results [51] . In the long run, these responsible actions result in opportunity cost as they imply redirecting resources of crucial areas of a firm, as well as a greater effort of managers [52] , leading to questioning the repercussion on the firm’s viability [14] . Because of this indirect repercussion on profits, as well as on firm’s health and value, this opportunity cost should be better analyzed in those firms that face a situation of financial distress.
The selection of the investment in responsible behavior strategy will be determined based on its cost/benefit. As Mackey et al. [10] specify the managers will change their social behavior policy, once the costs of supply and demand of this performance have been valued by the market. In this sense, Cheung et al. [24] indicate that environmental policies increase the costs and reduce profitability, but robust social policies strengthen reputation and image, allowing an improvement in firms overall value.
In front of the cost ranges associated to different alternatives, we propose that:
H2: Companies in distress will redirect their CSR performance, mitigating in lines that further deteriorate their statements, and will invest in non-costly actions that permit maintaining stakeholders’ support.
3. Data, Variables and Methodology
Before you begin to format your paper, first write and save the content as a separate text file. Keep your text and graphic files separate until after the text has been formatted and styled. Do not use hard tabs, and limit use of hard returns to only one return at the end of a paragraph. Do not add any kind of pagination anywhere in the paper. Do not number text heads—the template will do that for you.
Finally, complete content and organizational editing before formatting. Please take note of the following items when proofreading spelling and grammar:
We used a sample of US firms derived from Compustat database matched with Kinder, Lyndenberg and Domini’s database (KLD), gathering both economic-financial and CSR information. The analysis was made during the period 2001-2007, building 5 block scenarios, each of them comprising a three year window, allowing comparing if an attitudinal change occurs in different scenarios. Firms operating in the financial services, for the particularity of their activity, were eliminated from the sample. Companies that did not present complete nor had consistent information were also discharged. Firms were classified as being in distress or healthy, in a certain year t, following González-Bravo and Mecaj [53] , when they satisfied one or more of the following conditions: Negative Net Income, Negative Operating Income, Negative Retained Earnings, Negative Working Capital, Negative Cash Flow, Negative Operating Cash Flow and Negative Shareholder’s Equity. Furthermore, to assure that the distress is not a situation coming from previous years, we selected firms that in t − 1 were all in a healthy position. So, for instance all the 3-year blocks are composed by all healthy firms in (t − 1) and healthy or distressed firms in the year (t). The data of the year t + 1 allows us investigating the CSR actions and reactions of the firms, once they are aware of their decline. Table 1 shows the distribution of the sample across the analyzed period.

Table 1. Number of sample firms distributed by financial situation and year periods.
KLD database presents CSR behavior of companies by means of 7 dimensions representing environmental, social and governance performance (Community, Corporate Governance, Diversity, Employee Relations, Human Rights, Environment and Product). Each individual dimension is measured by means of a series of indicators which represent positive actions (as strengths) and negative actions (as concerns) using a binary system (0, absence; 1; presence). In order to avoid misinterpretation of the results, and following Mattingly and Berman [54] , we chose to consider separately the strengths and concerns of the different dimensions, as they gather different and opposite behavior of the firms in CSR actions [55] -[58] .
In this way, we agree with the approach used by Griffin and Mahon [59] , who believe that creating a unique index that values the strength/weakness of a company in a single variable can disguise those individual dimensions that are important for a company or industry and also, the effective effort that a company performs on each of them. For each company we gathered the measures of strengths and concerns as the sum of the items exposed in each KLD dimension. The number of items is shown in Table 2.
The final variables used in the analysis are gathered in Table 3.
Table 2. Dimensions considered in the KLD database.
Table 3. Variables used in the analysis.
*str refers to each CSR dimension strength exposed in Table 2; **con refers to each CSR dimension concern exposed in Table 2.
To analyze the profiles and behaviors of firms in each one of the year-windows we opted for the Multidimensional Scaling (MDS) analysis. MDS is a multivariate statistical analysis tool that allows representing graphically the similarities or differences between various elements according to the main characteristics of a data matrix [60] -[62] . By means of this technique, an n-dimensional consensus map is obtained where the observed individuals are situated according to the underlying variable’s structure. Two individuals appearing close to each other share similar information and their underlying variables behave in a similar way. On the contrary, the distances between the represented points indicate the differences between the individuals according to their structural differences in the analyzed variables. A posterior Co-plot methodology allows us plotting the original structural variables into the consensus map using a multi regression process [60] . The multi regression process, where the regression number is determined by the number of variables used in the analysis, follows the equation:
 (1)
(1)
where ZVij is the standardized value of the variable j for the i-observation and dimni corresponds to the coordinates obtained for every i-observation in each n-dimension by means of MDS.
The second part of the analysis pretends to determine the variables of influence in responsible behaviors, by proposing and testing the following regressions for each sector of activity of our sample:
 (2)
(2)
 (3)
(3)
Equations (2) and (3) refer to CSR strengths and CSR concerns, respectively. They measure the score of each company in terms of strengths and concerns and ROA measures the return on assets of the companies which affects the investment in CSR. CACL refers to current assets/current liabilities ratio and it measures the ability of the firm to face debt in the short-term. Size is a control variables calculated by taking the natural logarithm of Total Assets of firms in the year t, and the variable DFINDISS is the dummy variable for financial distress situation, taking value 0 if the firm is in a steady situation (healthy) and 1 otherwise.
4. Empirical Results and Discussion
4.1. Evolution of CSR Behavior
After performing the MDS we obtained that a 4-dimensional map would be accurate to project the individuals of our sample. We examine the goodness of fit of our model by means of Kruskals’ Stress1 level. The stress measures the level of conformity between original dissimilarities and the distances calculated from the map, like a “residual sum of squares”, such that the smaller its non-negative value is the better the model is represented. The goodness of fit of our model was 2.2% which is an excellent level following Kruskal’s approach [63] .
The graph with dimension_1 and dimension_2, which better displays the evolution of the CSR behavior of the two groups of firms forming our sample (distressed firms and healthy firms) during the years 2001-2007, will be exposed (Figure 1). By means of the Co-Plot methodology we projected the original variables together with the individual points in the same dimensional space running the fourteen linear regressions for each block, according to Equation (1). It is to be noted that the goodness of fit, R square, of the regressions for the 5 year blocks of our study are all powerful enough to interpret the map. Table 4 and Table 5 show the R-square value for the CSR strength variables and CSR concern variables, respectively.
Variable-points are connected with the origin of the axes by a vector, helping to understand the information gathered by the dimensions. The longer the vector of a variable is, the better it is represented by the factorial planes. On the other hand, the angle between the vector and the dimension shows the relevance of the features of a variable in the map. This means that a dimension is strongly related to the variable when the angle between them is acute. Figure 1 represents the map in dimension 1 and dimension 2 of the coefficients obtained for the firms as well as for the variables. The points represent the mean value of the two groups of firms in each year-window. In this way, EHT_1 indicates the average value of a certain variable of an Enterprise, Healthy and in time T of the 1st block. Similarly, EDT1_1 shows the mean value of a variable of an Enterprise, Distressed and in time t + 1 (T1) of the 1st block. The same interpretation is used in the remaining four blocks.
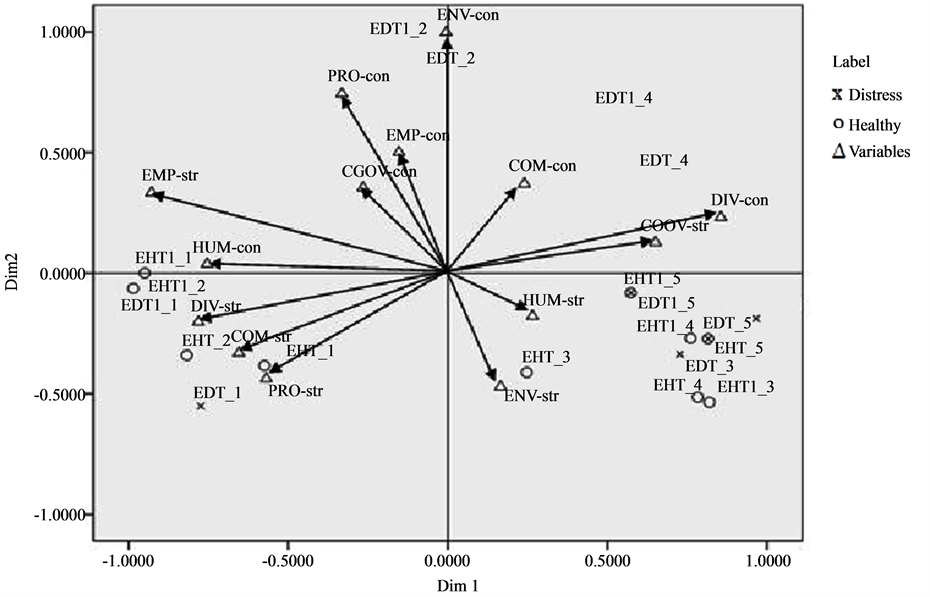
Figure 1. Evolution of CSR behavior of healthy and distressed firms.
Table 4. Goodness of fit for the Strength dimensions model.
*n/a. Not enough information to run the model.
Table 5. Goodness of fit for the Concern dimensions model.
It can be observed that dimension_1 is related to the time period, gathering on the left part the first years of the analysis and on the right part the last years. On the other hand, dimension_2 reasonably discriminates CSR profiles, placing strengths in the lower part and concerns in the upper part. According to this map representation, we could follow the movement of firms’ position in all years observing a cyclical path starting from the left part, being the first years of the study, towards the right part of the chart.
In general, in the first years of the analysis, the firms were positively valued with respect to their responsible behaviors. These evaluations detect profiles strong in Product, Community, Diversity and Employees.
Healthy firms maintain this performance in the second year-window; nevertheless distressed firms find themselves shifted towards the concerns area, highlighting negative profiles in Product and Environment Dimensions. In the last years of the analyzed period, firms are more characterized by a strong profile in Corporate Governance and they are also situated in the responsible environmental behavior zone in the consensus map. When considering the negative assessments, firms are penalized in aspects related to Diversity. As it occurred on the left side of the map, healthy firms preserve the same performance and distressed firms are, again, considering the 4th year-window, located in the area characterized by firms that do not invest on CSR actions and are not responsible when considering Environment or Community issues.
In overall, except for the second and fourth block, the placement of the firms presenting financial distress does not appear to be different from the globalized behavior of the rest of the sample. This is why we can consider that their investment on CSR actions is a consequence of the trend marked by the attitude and demand of the stakeholders. However, we can observe differences in certain placements as well as displacements of each group one year after the financial distressed is detected.
Throughout all five 3-year windows analyzed, except for the fifth, distressed firms are situated separately from the healthy firms and this occurs already during the year their financial statements present a poor performance. This fact allows considering that CSR actions are performed in advance, when the firm predicts that its financial situation will be delicate. In this way the firm gets ahead of the alarm signal that its financial statements will emit to the market.
In order to analyze if the existence of differences in the placements of the firms is not due to randomness, we run the Wilcoxon non-parametric test for healthy and distressed firms and the Mann-Whitney test for independent samples in the year t and t + 1. The results of these tests are shown in Table 6 and Table 7 respectively. The tests were performed on each dimension related to CSR and on strengths and concerns of each dimension separately. We also included the global CSR strength (CSR_S) and concern (CSR_C) valuations which gather
Table 6. Wilcoxon test results for which the hypothesis that each variable has the same distribution in t and t + 1 is rejected.
**Significant at the 0.05 level; *Significant at the 0.10 level.
Table 7. Mann-Whitney test results for which values of the variables of interest differ across groups.
*In each 3 year window, t corresponds to the middle year, when distress symptoms are identified, and t + 1 correspond to the last year of the year window, which is the year after the symptoms were recognized.
the weighted sum of the valuations obtained in the strength and concern dimensions, respectively. The weighted valuation was performed, to avoid that valuations obtained in dimensions formed by more items could affect the overall assessment.
Considering the global CSR assessments, firms classified as healthy present positive changes in all the year windows analyzed while distressed firms tend to increase their concern valuation or reduce their strength valuation one year after identifying the symptoms of economic and financial weaknesses.
Regarding the specific dimensions, in the cases where the Wilcox on test results are statistically significant for the healthy firms as well as for the distressed firms, we can affirm that there exist changes in responsible behaviors for both groups between t and t + 1. These changes occur in the same line for the two groups of firms so that it can be understood that they are the consequence of the satisfaction of the stakeholders’ demand on certain dimensions of CSR.
The results show that firms modify their behavior one year after some kind of distress has been identified. But this attitude change does not always happen in the same direction and occurs only for the samples analyzed in the windows 2001-2003 and 2002-2004. For this two periods, the changes affect positively the investment on Community or Employee relations which permit improving the company image and giving certain warranty for future. In the same line, we observe that in all the year windows analyzed there exists a trend for the healthy firms to increase their concerns in Corporate Governance and Human rights. This trend line does not occur for the firms in distress so that they confirm their worry about offering a trusted image to the community, in general, and to investors in particular. These results allow us confirming our first hypothesis (H1). On the other side, there exists also an increase in the negative valuation regarding environmental issues. This fact is better observed in the results showing that healthy firms reduce concerns in Environment issues and that this trend does not occur for the distressed firms in the same time window. Thus, we can support our H2 hypothesis.
No positive changes in dimensions as product and employee relations indicate that distressed firms do not wager directly on actions that have a direct repercussion on generation of profit. As a consequence we cannot confirm the hypothesis H1.1.
On the other side, Mann-Whitney test was performed to test the similarity between the responsible behavior of the healthy firms and distressed firms. The results show that Community concerns and Employee Relations strengths are statistically and significantly different in year t and t+1 in the 2001-2003 and 2004-2006 year windows. The results also evidence a reduction in the average valuation in concerns for distressed firms in t+1 (hence, supporting H1). Moreover, the 2004-2006 year window is the period when most differences exist between the two groups of firms concerning Community, Employees and Product (see Table 8). In this case, average assessments obtained for distressed firms decrease in all dimensions, except for Employee concerns where a considerable increase is observed, one year after the symptoms of financial distress have been recognized.
Additionally, in Employee concerns and Human rights concerns in 2003-2005 and Diversity concerns in 2004-2006, the differences between both groups disappear one year after the problems of a financial distress have shown up. These are the only three cases where clear differences in behavior between the two groups of the analysis occur. These three dimensions assess deficient behavior in CSR actions, yet a reduction in valuation occurs only in Diversity dimension, which involves actions that do not imply a relevant cost affecting firm’s performance, confirming again the H2 hypothesis.
4.2. Determinant Factors of CSR Behavior
Testing the models proposed to explain the responsible behavior, Table 8 and Table 9 show the most relevant
Table 8. Regression coefficient for each sector in the overall CSR assessment—STRENGHTS.
Table 9. Regression coefficient for each sector in the overall CSR assessment—CONCERNS.
Note: In italic, significant at 90% level of confidence. In bold, significant at 99% level of confidence.
results with respect to overall behavior assessments: strengths and concerns. The results show a model with a proper goodness of fit in all the sectors analyzed, although the results for each explicative variable are different.
When considering the general valuations, we obtain that the CSR strength assessment one year after the symptoms of distress appear, as expected, is strongly dependent of the CSR strategy followed the year before and it happens for all sectors. All firms increase their CSR valuation in terms of strengths. The same effect is noticed for all sectors, except for Communication, Consumer non-cyclical and Energy sectors, in the CSR strategy in the beginning year of the analysis, when all firms do not show any symptoms of distress.
The size of the companies has a positive effect on the CSR conduct, in every sector, which means that bigger firms try to fulfill the requirements towards the society and maintain their reputation and image. While the capacity of firms to satisfy creditors’ demands, measured by the Current ratio, does not influence the decision made on CSR, the economic performance (ROA) of the companies operating in the Communication sector seems to have a positive relationship with the same.
Regarding the influence of a financial distress on CSR strategies, we find that distressed firms in Industrials sector increase their CSR strength valuation, once the symptoms have been identified while the opposite effect occurs in distressed firms that operate in Utilities sector.
On the other side, with regard to CSR concerns overall assessment, surprisingly, the economic performance, the current ratio and financial distress do not have any significant influence on the CSR concerns strategies in none of the sectors analyzed. In this sense, the so called reactive behaviors appear to depend more on other issues such as the attitude of the company towards CSR.
5. Conclusions
In this study we analyze if a recognized situation of financial distress has an impact on CSR strategies and modifies the attitude of a set of firms towards responsible behavior. We analyzed CSR actions of a sample of healthy and distressed US firms, classified according to the fulfillment of certain distress conditions widely used in the literature, during the years 2001 to 2007. We found that healthy firms present changes in all the year windows analyzed while distressed firms tend to increase their concern valuation or reduce their strength valuation one year after identifying the symptoms of economic and financial weaknesses. However, when observed separately these differences do not occur in all the dimensions of CSR. Although we observed changes in distressed companies, they cannot be generalized as a pattern occurring during all the periods analyzed. Distressed firms maintain their CSR investment, so that they do not worsen their CSR worries despite their deteriorated situation.
In fact, we observe an increase in actions on non-costly dimensions such as Diversity or Human rights, where distressed firms show different behavior from healthy firms. Differences between the two groups of firms already appear during the year symptoms of crisis occur, thus we can affirm that distressed firms start their attitude change the year they suspect will incur into economic and financial problems.
In many CSR dimensions the changes observed between the year t and t + 1 are independent of the fact of being distressed or healthy. As a consequence, despite their problematic situation, distressed firms continue to wager in CSR investment and on those dimensions that are apparently valued by the market in that instant. The differences in the profiles allow us affirming that, as Mackey et al. [10] state, CSR investment is a matter of supply and demand coming from the market in a particular moment of time and that the business strategies adopted will depend on the financial situation the firms are facing in that specific moment, trying not to deteriorate their image and continuing generating wealth for the stakeholders.
References
- Prahalad, C.K. and Hamel, G. (1994) Strategy as a Field of Study: Why Search for a New Paradigm? Strategic Management Journal, 15, 5-16.
- McWilliams, A. and Siegel, D. (2001) Corporate Social Responsibility: A Theory of the Firm Perspective. Academy of Management Review, 26, 117-127.
- Schnietz, K.E. and Epstein, M. (2005) Exploring the Financial Value of a Reputation for Corporate Social Responsibility during a Crisis. Corporate Reputation Review, 7, 327-345. http://dx.doi.org/10.1057/palgrave.crr.1540230
- Graves, S.B. and Waddock, S.A. (2002) Beyond Built to Last: Stakeholder Relations in the Built to Last Companies. Business and Society Review, 105, 393-418.
- Konar, S. and Cohen, M. (2001) Does the Market Value Environmental Performance? Review of Economics and Statistics, 83, 281-309. http://dx.doi.org/10.1162/00346530151143815
- M. Orlitzky, Schmidt, F.L. and Rynes, S.R. (2003) Corporate Social and Financial Performance: A Meta-Analysis. Organization Studies, 24, 403-441. http://dx.doi.org/10.1177/0170840603024003910
- Schadewitz, H. and Niskala, M. (2010) Communication via Responsibility Reporting and Its Effect on Firm Value in Finland. Corporate Social Responsibility and Environmental Management, 17, 96-106.
- Semenova, N., Hassel, L.G. and Nilsson, H. (2010) The Value Relevance of Environmental and Social Performance: Evidence from Swedish SIX 300 Companies. Liiketaloudellinen Aikakauskirja, 3, 265-292.
- Lo, S.F. and Sheu, H.J. (2007) Is Corporate Sustainability a Value-Increasing Strategy for Business? Corporate Governance: An International Review, 15, 345-358. http://dx.doi.org/10.1111/j.1467-8683.2007.00565.x
- Mackey, A., Mackey, T.B. and Barney, J.B. (2007) Corporate Social Responsibility and Firm Performance: Investor Preferences and Corporate Strategies. Academy of Management Review, 32, 817-835. http://dx.doi.org/10.5465/AMR.2007.25275676
- Heal, G. (2005) Corporate Social Responsibility: An Economic and Financial Framework. The Geneva Papers, 30, 387-409.
- Goss, A. (2007) Essays a Corporate Social Responsibility and Financial Performance. Dissertation, York University, Toronto.
- Goss, A. (2009) Corporate Social Responsibility and Financial Distress. ASAC, Niagara Falls.
- Hillman, A.J. and Keim, G.D. (2001) Shareholder Value, Stakeholder Management, and Social Issues: What’s the Bottom Line? Strategic Management Journal, 22, 125-139. http://dx.doi.org/10.1002/1097-0266(200101)22:2<125::AID-SMJ150>3.0.CO;2-H
- Luo, X.M. and Bhattacharya, C.B. (2006) Corporate Social Responsibility, Customer Satisfaction and Market Value. Journal of Marketing, 70, 1-18. http://dx.doi.org/10.1509/jmkg.70.4.1
- Lee, D.D., Faff, R.W. and Langfield-Smith, K. (2009) Revisiting the Vexing Question: Does Superior Corporate Social Performance Lead to Improved Financial Performance? Australian Journal of Management, 34, 21-49. http://dx.doi.org/10.1177/031289620903400103
- Ho, L.-C.J. and Taylor, M.E. (2007) An Empirical Analysis of Triple Bottom-Line Reporting and its Determinants: Evidence from the United States and Japan. Journal of International Financial Management and Accounting, 18, 123- 150. http://dx.doi.org/10.1111/j.1467-646X.2007.01010.x
- Fombrun, C.J. and Shanley, M. (1990) What Is in a Name? Reputation Building and Corporate Strategy. Academy of Management Journal, 33, 233-259. http://dx.doi.org/10.2307/256324
- Feldman, S.J., Soyka, P.A. and Ameer, P.G. (1997) Does Improving a Firm’s Environmental Management System and Environmental Performance Result in a Higher Stock Price? Journal of Investing, 6, 87-97. http://dx.doi.org/10.3905/joi.1997.87
- Miles, M.P. and Covin, J.G. (2000) Environmental Marketing: A Source of Reputational, Competitive and Financial Advantage. Journal of Business Ethics, 23, 299-311. http://dx.doi.org/10.1023/A:1006214509281
- Devinney, T.M. (2009) Is the Socially Responsible Corporation a Myth? The Good, the Bad, and the Ugly of Corporate Social Responsibility. Academy of Management Perspectives, 23, 44-56. http://dx.doi.org/10.5465/AMP.2009.39985540
- Ghoul, S., Guedhami, O., Kwok, C. and Mishra, D. (2011) Does Corporate Social Responsibility Affect the Cost of Capital? Journal of Banking and Finance, 35, 2388-2406. http://dx.doi.org/10.1016/j.jbankfin.2011.02.007
- Whetten, D.A. and Mackey, A. (2004) An Identity-Congruence Explanation of Consistently High Corporate Social Performance Ratings. Working Paper, Marriott School of Management, Brigham Young University, Provo.
- Cheung, Y.L., Tan, W., Ahn, H.J. and Zhang, Z. (2010) Does Corporate Social Responsibility Matter in Asian Emerging Markets? Journal of Business Ethics, 92, 401-413. http://dx.doi.org/10.1007/s10551-009-0164-3
- Levine, M.A. (2008) The Benefits of Corporate Social Responsibility. New York Law Journal, August 13.
- Wang, Y.G. (2011) Corporate Social Responsibility and Stock Performance—Evidence from Taiwan. Modern Economy, 2, 788-799. http://dx.doi.org/10.4236/me.2011.25087
- Reinhardt, F. (1999) Market Failure and the Environmental Policies of Firms. Economic Rationales for “Beyond Compliance” Behavior. Journal of Industrial Ecology, 3, 9-21. http://dx.doi.org/10.1162/108819899569368
- Waddock, S.A. and Graves, S.A. (1997) The Corporate Social Performance-Financial Performance Link. Strategic Management Journal, 18, 303-319. http://dx.doi.org/10.1002/(SICI)1097-0266(199704)18:4<303::AID-SMJ869>3.0.CO;2-G
- Becchetti, L., Ciciretti, R., Hasan, I. and Kobeissi, N. (2012) Corporate Social Responsibility and Shareholder’s Value. Journal of Business Research, 65, 1628-1635. http://dx.doi.org/10.1016/j.jbusres.2011.10.022
- Ioannou, I. and Serafeim, G. (2010) The Impact of Corporate Social Responsibility on Investment Recommendations. Harvard Business School Accounting and Management Unit Working Paper No. 1507874, Boston, 11-17.
- Shea, L.J. (2010) Using Consumer Perceived Ethicality as a Guideline for Corporate Social Responsibility Strategy: A Commentary Essay. Journal of Business Research, 63, 263-264. http://dx.doi.org/10.1016/j.jbusres.2009.04.021
- Becchetti, L., Castelli, A. and Hasan, I. (2009) Investment-Cash Flow Sensitivities, Credit Rationing and Financing Constraints in Small and Medium-Sized Firms. Small Business Economics, 35, 467-497.
- Cormier, D. and Magnan, M. (1997) Investors’ Assessment of Implicit Environmental Liabilities: An Empirical Investigation. Journal of Accounting and Public Policy, 16, 215-241. http://dx.doi.org/10.1016/S0278-4254(97)00002-1
- Hassel, L., Nilsson, F. and Nyquist, S. (2005) The Value Relevance of Environmental Performance. European Accounting Review, 14, 41-61. http://dx.doi.org/10.1080/0963818042000279722
- Wahba, H. (2008) Does the Market Value Corporate Environmental Responsibility? An Empirical Examination. Corporate Social Responsibility and Environmental Management, 15, 89-99. http://dx.doi.org/10.1002/csr.153
- Anton, W.R.Q., Deltas, G. and Khanna, M. (2004) Incentives for Environmental Self-Regulation and Implications for Environmental Performance. Journal of Environmental Economics and Management, 48, 632-654.
- Hernández-Murillo, R. and Martinek, C. (2009) Corporate Social Responsibility Can Be Profitable. The Regional Economist, Federal Reserve Bank of St. Louis, April, 4-5.
- Ruf, B.M., Muralidhar, K., Brown, R.M., Janney, J.J. and Paul, K. (2001) An Empirical Investigation of the Relationship between Change in Corporate Social Performance and Financial Performance: A Stakeholder Theory Perspective. Journal of Business Ethics, 32, 143-156. http://dx.doi.org/10.1023/A:1010786912118
- Sen, S. and Bhattacharya, C.B. (2001) Does Doing Good Always Lead to Doing Better? Consumer Reactions to Corporate Social Responsibility. Journal of Marketing Research, 38, 225-244. http://dx.doi.org/10.1509/jmkr.38.2.225.18838
- Becker-Olsen, K.L., Cudmore, A.B. and Hill, P.R. (2006) The Impact of Perceived Corporate Social Responsibility on Consumer Behavior. Journal of Business Research, 59, 46-53. http://dx.doi.org/10.1016/j.jbusres.2005.01.001
- Berens, G., Van Riel, C. and Van Bruggen, G. (2005) Corporate Associations and Consumer Product Responses: The Moderating Role of Corporate Brand Dominance. Journal of Marketing, 69, 35-48. http://dx.doi.org/10.1509/jmkg.69.3.35.66357
- Bhattacharya, C.B. and Sen, S. (2004) Doing Better at Doing Good. California Management Review, 47, 9-24. http://dx.doi.org/10.2307/41166284
- Lichtenstein, D.R., Drumwright, M.E. and Braig, B.M. (2004) The Effect of Corporate Social Responsibility on Customer Donations to Corporate-Supported Nonprofits. Journal of Marketing, 68, 16-32. http://dx.doi.org/10.1509/jmkg.68.4.16.42726
- Muñoz, F.F., Encinar, M.I. and Cañibano, C. (2012) On Economics, Ethics, and Corporate Social Responsibility. Modern Economy, 3, 355-363.
- Earle, R. (2000) The Emerging Relationship between Environmental Performance and Shareholder Wealth. Assabet Group. http://ww.assabetgroup.com
- Jensen, M.C. (2002) Value Maximization, Stakeholder Theory, and the Corporate Objective Function. Business Ethics Quarterly, 12, 235-256. http://dx.doi.org/10.2307/3857812
- Holman, W.R., Randoloph, N.J. and Singer, D. (1985) The Impact of Corporate Social Responsiveness on Shareholder Wealth. In: Lee, E., Ed., Preston Research on Corporate Social Performance and Policy, Vol. 7, Elsevier Science & Technology Books, Greenwich, 137-152.
- Yermack, D. (2006) Golden Handshakes: Separation Pay for Retired and Dismissed CEOs. Journal of Accounting and Economics, 14, 237-256. http://dx.doi.org/10.1016/j.jacceco.2006.01.001
- Barnea, A. and Rubin, A. (2008) Corporate Social Responsibility as a Conflict between Owners. http://www.haas.berkeley.edu/responsiblebusiness/conference/documents/AmirRubinFinalpaper.pdf
- Palmer, K., Oates, W. and Portney, P. (1995) Tightening Environmental Standards: The Benefits-Cost or No-Cost Paradigm? Journal of Economic Perspectives, 9, 119-132. http://dx.doi.org/10.1257/jep.9.4.119
- Belu, C. (2009) Ranking Corporations in Terms of Sustainable and Socially Responsible Practices. Sustainable Development, 17, 257-268. http://dx.doi.org/10.1002/sd.390
- Hull, C.E. and Rothenberg, S. (2008) Firm Performance: The Interactions of Corporate Social Performance with Innovation and Industry Differentiation. Strategic Management Journal, 29, 781-789.
- González-Bravo, M.I. and Mecaj, A. (2011) Structural and Evolutionary Patterns of Companies in a Financial Distress Situation. Advances in Decision Sciences, 2011, Article ID: 928716. http://dx.doi.org/10.1155/2011/928716
- Mattingly, J.E. and Berman, S.L. (2006) Measurement of Corporate Social Action: Discovering Taxonomy in Kinder Lydenberg Domini Ratings Data. Business and Society, 45, 20-46. http://dx.doi.org/10.1177/0007650305281939
- Strike, V.M., Gao, J. and Bansal, P. (2006) Being Good While Being Bad: Social Responsibility and the International Diversification of US Firms. Journal of International Business Studies, 37, 850-862. http://dx.doi.org/10.1057/palgrave.jibs.8400226
- Godfrey, P.C., Merrill, C.B. and Hansen, J.M. (2009) The Relationship between Corporate Social Responsibility and Shareholder Value: An Empirical Test of the Risk Management Hypothesis. Strategic Management Journal, 30, 425-445.
- Kacperczyk, A. (2009) With Greater Power Comes Greater Responsibility? Takeover Protection and Corporate Attention to Stakeholders. Strategic Management Journal, 30, 261-285.
- Arora, P. and Wadwarkar, R. (2011) Corporate Governance and Corporate Social Responsibility (CSR): The Moderating Roles of Attainment Discrepancy and Organization Slack. Corporate Governance: An International Review, 19, 136- 152. http://dx.doi.org/10.1111/j.1467-8683.2010.00843.x
- Griffin, J. and Mahon, J. (1997) The Corporate Social Performance and Corporate Financial Performance Debate. Business and Society, 36, 5-31. http://dx.doi.org/10.1177/000765039703600102
- Neophytou, E. and Mar Molinero, C. (2004) Predicting Corporate Failure in the UK: A Multidimensional Scaling Approach. Journal of Business Finance and Accounting, 31, 677-710. http://dx.doi.org/10.1111/j.0306-686X.2004.00553.x
- Kruskal, J.B. and Wish, M. (1984) Multidimensional Scaling. Sage, London.
- Peña, D. (2002) Análisis de Datos Multivariantes. MacGraw Hill, New York.
- Kruskal, J.B. (1964) Nonmetric Multidimensional Scaling: A Numerical Method. Psychometrika, 29, 115-129. http://dx.doi.org/10.1007/BF02289694