Modern Economy
Vol.5 No.6(2014), Article
ID:46650,7
pages
DOI:10.4236/me.2014.56062
How to Improve Dairy Production in Brazil through Indicators for the Economic Development of Milk Chain
Marcelo T. Okano1, Oduvaldo Vendrametto2, Osmildo Sobral dos Santos3
1Paulista University/State Faculty of Technology of Barueri, São Paulo, Brazil
2Paulista University, São Paulo, Brazil
3Paulista University/University of Guarulhos, São Paulo, Brazil
Email: okano@vop.com.br
Copyright © 2014 by authors and Scientific Research Publishing Inc.
This work is licensed under the Creative Commons Attribution International License (CC BY).
http://creativecommons.org/licenses/by/4.0/


Received 4 January 2014; revised 4 February 2014; accepted 14 February 2014
ABSTRACT
Dairy production in Brazil is an important activity of the agricultural sector and it has a vital role in the economic and social development process of the country. Brazil fluid milk consumption is estimated at 177 liters per capita per year. Consumption of fluid milk is forecasted to increase around 2 percent in 2013. The increase is derived mostly from an estimated increase in industrial use, supported by higher disposable consumer income. Milk drink products in Brazil are not only expanding in volume but also gaining in sophistication and health orientation. Brazil is considered as the top flavored milk drink market in Latin America. The lack of vision and understanding of the production chain as a whole, eventually led to an asymmetric behavior, in some situations, resulting in losses along the production process, often justifying the dissatisfaction of producers. The differences in type of producers, technology standards, low investments, the profile of traditional estates, owners resistance to changes, cultural barriers and distrust lead to unbalance of the estate productivity and the disorganization of the supply chain. The present study proposes an investigation and classification of the dairy chain to demonstrate that it is possible to organize the estates of the dairy chain, using indicators to rank them, modeling best practices to improve productivity and become a sustainable productive chain.
Keywords:Dairy Chain, Agribusiness, Productivity, Milk Production

1. Introduction
Dairy production in Brazil is an important activity of the agricultural sector and it has a vital role in the economic and social development process of the country [1] . In 2012, dairy production was 22.3 billion liters of inspected milk, with an increase of 68% in the last decade (Figure 1).
Brazil fluid milk consumption is estimated at 177 liters per capita per year. Consumption of fluid milk is forecasted to increase around 2 percent in 2013. The increase is derived mostly from an estimated increase in industrial use, supported by higher disposable consumer income. Milk drink products in Brazil are not only expanding in volume but also gaining in sophistication and health orientation. Brazil is considered as the top flavored milk drink market in Latin America [2] .
After half a century of little change, largely explained by strong government intervention in the dairy market, milk production chain begins in the early 90s, to experience significant changes in all market segments, from production to consumption [3] . Significant advances occurred in the farming and industrial phases, through the application of genetic control, artificial insemination, endemic controls, improved feeding and grazing, and the adoption of strict criteria for inspection, treatment, cleaning and disinfection.
Most producers in the production chain are small traditional farmers, and milk is one of the sources of the estate revenues. The investments are reduced and this jeopardizes the adoption of changes and advances, and results in low estate productivity. For instance, there are a number of small dairy estates who perform the milking operation manually and also use their cattle for slaughtering and calf breeding, which results in a low daily productivity. The differences in type of producers, technology standards, low investments, the profile of traditional estates, owners resistance to changes, cultural barriers and distrust lead to unbalance of the estate productivity and the disorganization of the supply chain.
The lack of vision and understanding of the production chain as a whole, eventually led to an asymmetric behavior, in some situations, resulting in losses along the production process, often justifying the dissatisfaction of farmers. Furthermore, these changes and advances have brought improvements in the productivity of cleaning, feeding and management of estates who adopted them.
The present study proposes an investigation and classification of the dairy chain, thus allowing productivity to be measured through indicators that supply the classification of producers and the best practices for development of this ranking to improve productivity. The intent of this research is to demonstrate that it is possible to organize the estates of the dairy chain, using indicators to rank them, modeling best practices to improve productivity and become a sustainable productive chain.
2. Research Design
In order to achieve the objective of this research a survey was carried out along with dairy producers in several regions of the state of Sao Paulo. To gather the information required by the analysis an exploratory research of qualitative nature was adopted.
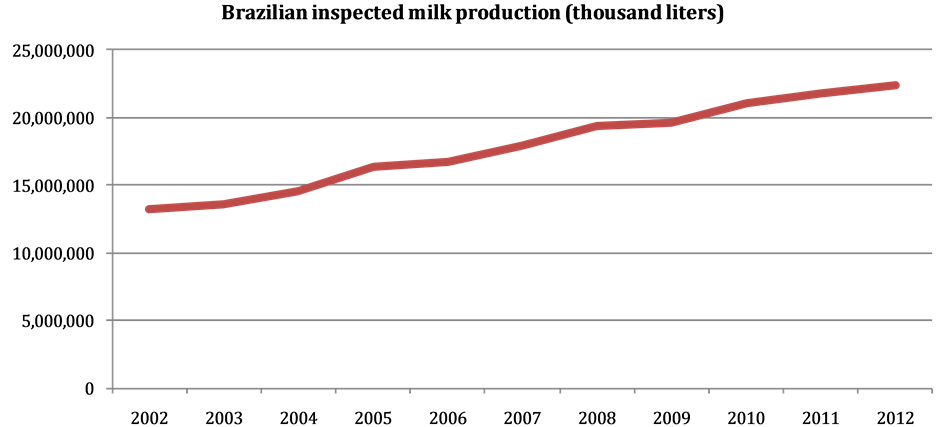
Figure 1. Brazilian inspected milk production (2002-2012).
For Gil [4] , the exploratory research aims to provide closer familiarity with the problem in order to make it more explicit. Zikmund [5] believes that exploratory studies are conducted to clarify ambiguous issues; research is needed to better understand the dimensions of the problems.
The research can be categorized as “survey” since it redirects the question directly to the interviewed members of a significant sample of the universe that were studied and whose behavior we wish to know, because their results can lead to conclusions relevant to the data that were collected [6] .
After the conclusion of the bibliographical research, that made it possible to establish the initial indicators required for the development of the field research, a number of meetings were held with the owner of farm 3J, the Itapetininga area in SP, also including agronomist Luiz Otavio Motta, consultant of the Estates of Fartura, to validate the chosen indicators.
According to experts on the indicators, the main theoretical reference was the work of Gehlen [7] . The new information revealed the need to increase the indicators and their rating activities. In order to facilitate understanding and applicability it was then decided to group the indicators according to six activities, as shown in Table 1.

Table 1. Indicators.
The field research was conducted between August and December 2009 and was developed by using a sample of dairy farms of various sizes in the areas of Itapetininga, Fartura, Avare and São Pedro, all in the state of SP. In total, 54 estates were surveyed, divided according to Table 2.
This sample was chosen as a criterion of accessibility by the researcher, i.e. it is not strictly a probability sample. The research was directed at owners and managers of farms and facilitators (agronomists, agricultural technicians and decision-makers) considered as people with knowledge of the areas surveyed in dairy production and management, health, housing, genetics, nutrition, costs and reliability of the producers.
The classification of producers was based on five levels of milk production capacity represented by P1, P2, P3, P4 and P5, respectively. Denomination of the levels was realized in accordance to the types of producers of Jank and Galan [8] and Gehlen [7] on adaptation of the author (Table 3).
During the research it became evident that the gap between one producer and the other did not follow a linear scale. Objectively, the physical changes of the environment and the results are subject to evaluation. However, the organizational initiatives require knowledge and applications to automate aspects of health, hygiene, food stuffs, animal breed selection, and relationship with the players. The exponential scale expresses, in its whole, a closer result of what was perceived.
3. Results and Discussion
The estates surveyed were classified according to Table 4.
The producers were divided into five classes according to their characteristics as follows (Table 5).
Investigating the classification characteristics of the estates as well as the importance of each indicator, the estates can evolve in the table of proposed classification as the reports of producers:
• Increase in productive efficiency of the estate;
• A motivating factor or financial reward, as a bonus for volume or quality;
Table 2. Number of estates surveyed by area.
Table 3. Classification of milk-producing estates.
Table 4. Classification of the surveyed estates.
Table 5. Summary of the characteristics as related to the various classifications used.
Continued
• Strategic planning aimed at the estate growing.
In any case, investments will be necessary to improve infrastructure, technology standards, labor etc. Improvements can be made at short, medium or long term, for example, purchase of a cooler is at short term and genetic improvement could be at medium or long term. Best practices for development are:
P5 (unskilled producer) to P4 (Traditional Producer)
The evolution of producer from P5 to P4 consists on investments in technology standards, mainly in the acquisition of a cooler, the dairy cooperatives pays R$ 0.10 less in the liter of non-refrigerated milk.
P4 (traditional producer) to P3 (Producer in transition)
For a producer to evolve from the P4 to the P3 class, his investments should be made to improve the technological standards and production processes, i.e., the owner must improve productivity by focusing on the estate:
• Acquisition of technological standards such as mechanized milking;
• Start a genetic improvement program to increase milk production;
• Nutritional improvement;
• Qualification and employment of trained manpower;
Or else, focus on practices that will improve the remuneration or bonus as milk quality, for example:
• Perform cleaning and disinfecting in milking operations;
• Sanitary control;
The ideal target is to focus on these two points, increase productivity and obtain a better remuneration. This is the case with the Farturaproducers: the Frutap company pays up to R$ 0.11 more per liter of milk, depending on quality.
P3 (Producer in transition) to P2 (modern traditional Producer)
In this phase, the producer quits seeing milk production as a mere additional revenue and convert it into the main activity. The production increases and therefore it is necessary to think in productive efficiency to set the technological standards, processes and manpower according to demand; consequently the investments will focus on:
• Professional upgrading and specialization of labor;
• Enhance the structure of the milking room by building a ditch and a cooling room;
• Milking system specialization thru the implementation of fishbone or tandem devices;
• Purchase of larger equipment, such as a cooler;
• Genetic improvement aiming at a better milking quality stock;
• Nutritional improvement.
P2 (Producer modern traditional) to P1 (Producer modern industrial)
Producer evolution from P2 to P1 consists in increasing the estate productive efficiency, by using technological resources and processes to supply the demand as swiftly as possible, because production is high and has to be performed within the briefest limits; in this case, investment should be in:
• Housing improvement, i.e., adopt the Free-Stall system;
• Nutritional improvement;
• Improving the quality of the stock, as acquisition of high quality (Dutch stock) animals;
• Acquisition of technology standards such as system robotic or milking carousel, etc.
• Channeled milking parlor;
• Computerized control system.
4. Conclusions
After examining the results and final reviews of the research, the general objectives were met, and the contribution being a set of indicators meant to classify dairy farmers according to management, health, nutrition, housing, genetics and cost factors. The importance of each of these indicators was verified along with their share of contribution in the productivity of the estate.
We analyzed the main prevailing aspects of the production chain, as referenced in the literature and confronted with the reality encountered in field research.
We were able to prepare the development of better practices for producers in the classification table and help improve the organization of the estates composing the dairy chain.
We understand to have hereby generated a relatively simple model—one that can be implemented in steps, depending on the producer competency and culture, and that serves as a facilitator to induce changes, innovation and economic growth of small businesses in the industry of bovine milk, both at the individual as well as the collective levels.
References
- Yamaguchi, L.C.T., et al. (2001) Milk Production in Brazil during the Last Three Decades. In: Gomes, A.T., Milk, J.L.B. and Carneiro, A.V., Eds., The Dairy Agribusiness in Brazil—Juiz de Fora, EMBRAPA Gado de Corte.
- USDA (United State Department of Agriculture) (2013) GAIN Report Number BR 0917, USA.
- Gomes, S.T. (2001) Recent Developments and Prospects for Milk Production in Brazil. In: Gomes, A.T., Milk, J.L.B. and Carneiro, A.V., Eds., The Dairy Agribusiness in Brazil—Juiz de Fora, EMBRAPA Gado de Corte.
- GIL, A.C. (2002) How to Develop Projects of Research. Atlas Press, Sao Paulo.
- Zikmund, W.G. (2000) Business Research Methods. 6th Edition, The Dryden Press, Fort Worth.
- GIL, A.C. (1987) Methods and Techniques of Social Research. Editora Atlas, São Paulo.
- Gehlen, I. (2000) Identity and Competitiveness of Family Dairy Farmers/RS. Porto Alegre.
- Jank, M.S. and Galan, V.B. (1998) Competitiveness of the Dairy Agribusiness System in Brazil. Revista do Instituto de Laticinios “Candide Tostes”, Vol. 53, Juiz de Fora, 72-83.