Journal of Biophysical Chemistry
Vol.4 No.4(2013), Article ID:39851,7 pages DOI:10.4236/jbpc.2013.44016
Morphology observation of dipalmitoyl phosphatidyl choline (DPPC) monolayer on water surface by dropping method
![]()
1Department of Life Science and Material Engineering, Nagoya Institute of Technology, Nagoya, Japan; *Corresponding Author: yamamoto.yasushi@nitech.ac.jp
2Department of Frontier Materials, Nagoya Institute of Technology, Nagoya, Japan
3Department of Chemistry, School of Arts and Sciences, Showa University, Fujiyoshida, Japan
4Tohoku Foods Corporation Limited, Sendai, Japan; *Corresponding Author: shervani.nanotec@gmail.com
Copyright © 2013 Daisuke Yoshida et al. This is an open access article distributed under the Creative Commons Attribution License, which permits unrestricted use, distribution, and reproduction in any medium, provided the original work is properly cited.
Received 8 September 2013; revised 10 October 2013; accepted 23 October 2013
Keywords: DPPC Monolayer; Dropping Method; Surface Tension; Fluorescence Microscopy; Brewster Angle Microscopy
ABSTRACT
Preparation of DPPC lipid monolayer in water trough has been done by dropping method and compared with compression method. Monolayer was studied by surface pressure isotherm, fluorescence microscopy, Brewster angle microscopy, and infrared external reflection spectroscopy. Results of these measurements showed that dropping method gave better results compared to compression method. In dropping method, transition from liquid expanded state to liquid condensed is gradual compared to sharp one in compressed method. During monolayer formation, adjustment and interaction between hydrophilic part of lipid and water and among hydrophobic part of lipid molecule are slow, stable, and more natural as worked out from surface area versus pressure isotherm. At a given molecular area, surface pressure is less compared to compression method thus monolayer is in more fluidic state in dropping method than compression method. The observation was supported by all techniques described above.
1. INTRODUCTION
Biomembranes have fundamental fluid structures representing “fluid mosaic model” proposed by Singer and Nicolson [1], in which functional proteins are buried in bilayers consisting of various kinds of phospholipids [2]. From the viewpoint of membrane fluidity, it is important to examine the properties of not only proteins but also phospholipids membrane. Various investigations on lipid monolayers and bilayers, micelles, vesicles, and liposomes, have been performed to clarify details of cellular functions, substance transportation into and out of membranes, and chemical and physical molecular recognition [3,4]. Lipid monolayers formed at water-air interface have been studied extensively as a model membrane as they are easy to prepare and study [5].
Ohe et al. [6] studied interaction between antibiotic and phospholipids monolayer at water-air interface applying vibrational sum frequency generation spectroscopy. Okahata and co-workers [7-9] have performed systematic studies on the molecular recognition of lipid monolayer formed on water surface using quartz crystal microbalance (QCM) method capable of nanogram order level detection. Monolayer on water surface is generally formed by compression method [10]. In this method, a fixed volume of solution containing monolayer sample was dropped on water surface and partition board compresses monolayer molecules lying on the water surface after solvate evaporated completely. Monolayers are formed automatically using monolayer formation apparatus, but it requires artificial compression force applied to monolayer.
The dropping or expanding method described in this study is that solution droplets of DPPC-chloroform are dropped continuously in water trough. When first drop expands on water surface, next drop is added; thus, at intervals, drops are added continuously on water surface. In this dropping method, a large volume of solution and enough time are required to make monolayer. But advantage is monolayer forms spontaneously and molecules are at stable equilibrium state.
The interaction between hydrophobic groups in monolayer is an important factor for maintaining the structure of amphiphilic monolayer. Hydrophobic interaction is also important to keep balance between hydrophilic groups in monolayer and water molecules. Stability of water-hydrophilic interaction is important since water is >70% component in the living bodies [11] and also plays an important role in cellular function [12]. Dropping method is better for forming fluid monolayer on water surface which makes monolayer a good candidate to study model membrane.
In this work, we report morphology of dipalmitoyl phosphatidyl chorine (DPPC) monolayer formed on water surface by dropping method. Monolayer was studied by applying a number of physicochemical methods: surface tension measurement (STM), fluorescence microscopy (FM), Brewster angle microscopy (BAM), and infrared external reflection spectroscopy (IERS). We succeeded in noticing the unique difference in fluidicmonolayer formed by dropping method than that obtained by compression method. Role of hydrophilic interaction in monolayer formation has also been discussed.
2. MATERIALS, METHODS, AND APPARATUS
2.1. Materials
Dipalmitoyl phosphatidyl chorine (DPPC > 97%) which was used to prepare membrane was purchased from Fluka Chemical Co. Inc. and used without further purification. Spreading solvent for DPPC monolayer was chloroform (99.0%, Wako Pure Chemical Industries Ltd.). Purified water with conductance < 0.07 μS/cm was obtained using a Super Water Purifying System (WL-21P; Yamato Scientific Corp. Ltd.).
2.2. Monolayer Preparation
1 mM DPPC-chloroform solution was spread on a purified water surface with a 100 μl syringe to form DPPC monolayer. Preparation of monolayer was following. Purified water of 100 ml was poured into a glass dish of diameter of 95 mm and height 17 mm. 1 μl DPPC-chloroform solution droplet was dropped gently on the water surface and the next drop was added after >1 min so that previous droplet expanded on the water surface before second comes in. As described in Section 2.3, the expanding process of first drop was confirmed by the fact that the value of surface tension becomes constant after dropping. This action of dropping and spreading was repeated until DPPC monolayer was formed and dropping volume reached to 28 μl. Completion of monolayer formation was confirmed by the fact that the formation of lenses was observed on the water surface and the value of surface tension did not change when the dropping amount of DPPC-chloroform solution exceeded 28 μl.
2.3. Surface Tension Measurement (STM)
STM for DPPC monolayer was carried out on a Surface Tensiometer (CBVP-A3; Kyowa Interface Science Corp. Ltd.). The surface pressure of the monolayer was recorded as a function of the spreading volume at 26.0˚C ± 0.1˚C. Surface pressures were measured at four spreading volumes that corresponded to 4 mN/m, 8 mN/m, 12 mN/m, and 42 mN/m. From surface pressure and molecular area values an isotherm was constructed as shown in Figure 1.
2.4. Fluorescence Microscopy (FM)
For observation of fluorescence, a fluorescent probe, rhodamine-dimiyrstoyl phosphoethanolamine (Rh-DMPE, Avanti Polar Lipids Inc.) was incorporated at 0.1 mol% in 1 mM DPPC-chloroform solution. A cover glass of area 18 ´ 18 mm2 and thickness 0.12 mm was chemically cleaned by Piranha treatment (immersion in a mixed solution of H2SO4 ((98%)/H2O2 (33%)) 7/3) for 10 min. The cleaned glass was fastened to a tip of handmade autoelevation system and immersed into water phase in the glass dish. The DPPC-chloroform solution containing RhDMPE probe in four dropping volume corresponded to surface pressures of 4, 8, 12, and 42 mN/m, was expanded
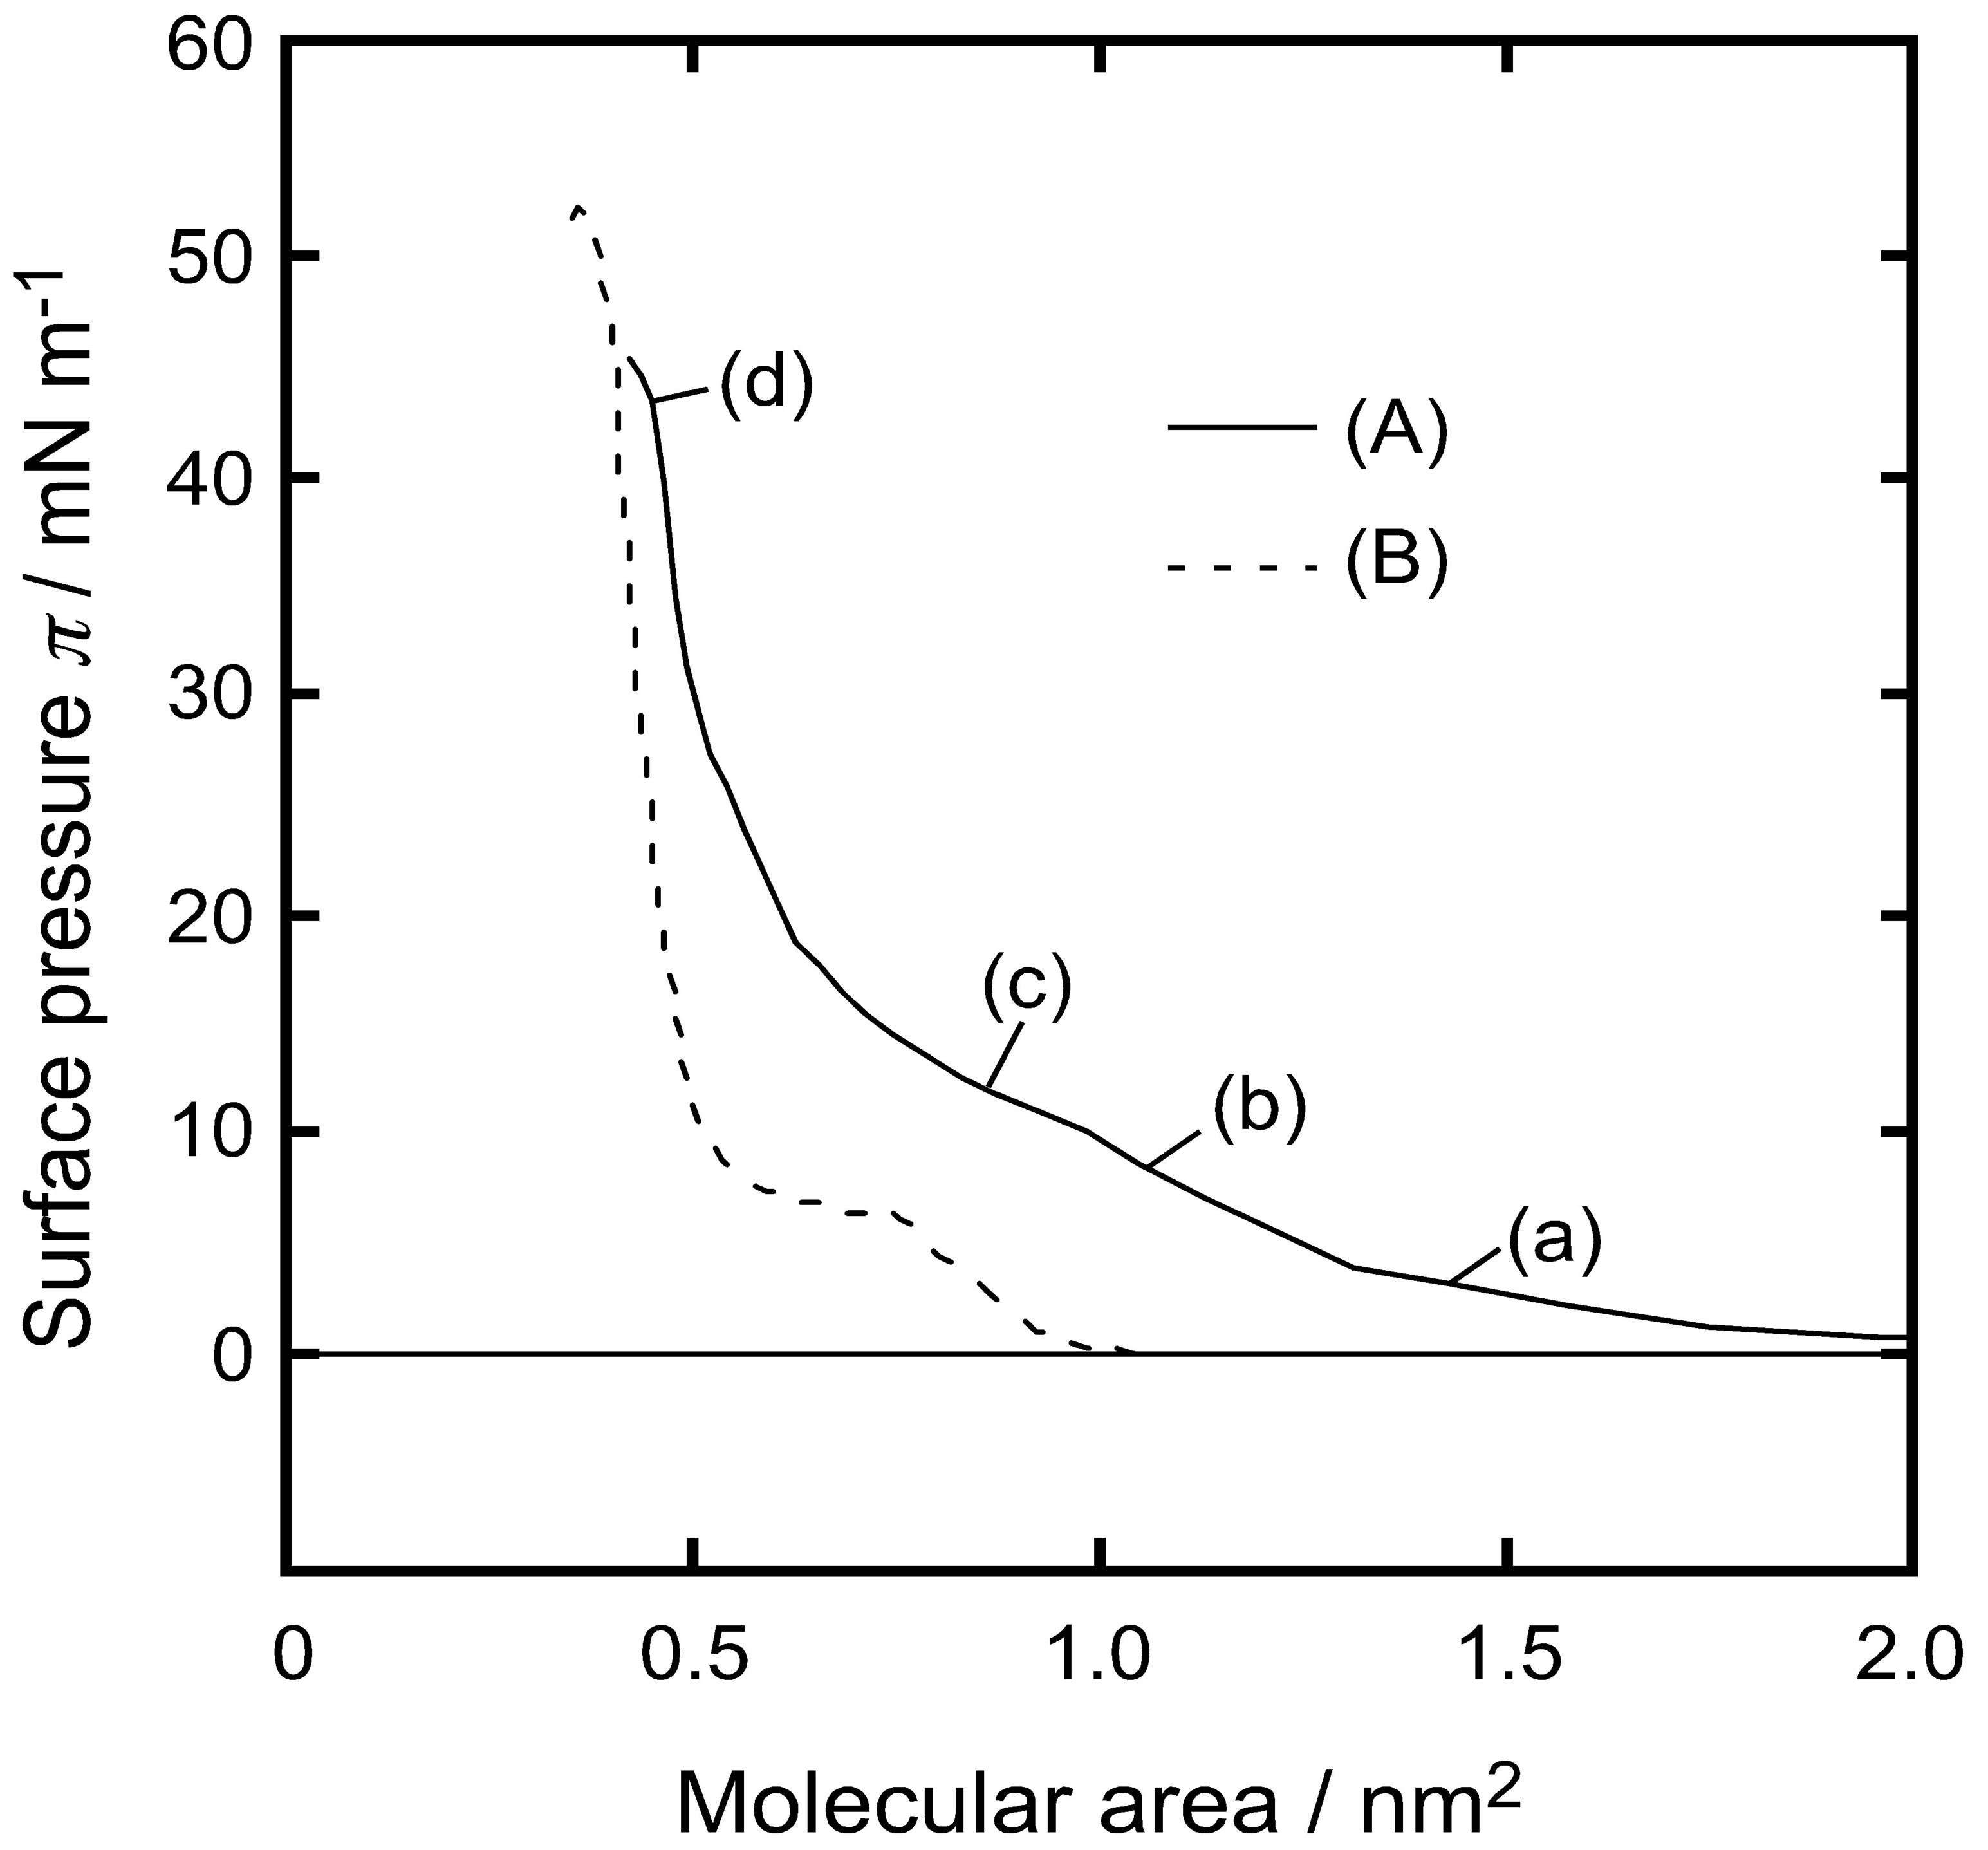
Figure 1. Surface pressure versus molecular area isotherm curve of water-DPPC monolayer; (A) dropping method; (B) compression method. Points a-d were measured by FM, BAM, and IERS (see text).
on the water surface at 26.0˚C ± 0.1˚C. After more than 30 min from finishing of each monolayer formation, the glass in the water phase was scooped horizontally from under the monolayer using scooping-up method [13] at transfer velocity of 1 mm/min and the monolayer was transferred on the glass. Fluorescence microscopy (FM) for visualizing the morphologies of DPPC monolayer was carried out on a commercial total internal reflection fluorescence (TIRF) microscope (TE2000-U; Nikon Co.) at room temperature. Microscope was equipped with an oil immersion objective lens (Plan Apo 100 × H, numerical aperture ; 1.45; Nikon Co.), a 575 nm dichroic mirror, a set of barrier filters (590 nm long pass and 765 - 855 nm band pass filters), a laser with λ = 532 nm (CL532-025-L, 25 mW; Crystallizer, Reno, USA), a cooled CCD camera (ORCA-ER; Hamamatsu Photonics,), and AQUACOSMOS imaging analysis software. The lateral resolution of FM was about 0.1 μm.
2.5. Brewster Angle Microscopy (BAM)
BAM for visualizing the morphologies of DPPC monolayer was carried out on a commercial Brewster angle microscope (EMM633K; Filgen Inc.). BAM is essentially an ellipsometry and the monolayer image arises from the refractive index difference between the monolayer and the water phase. BAM device was mounted onto a glass dish and P-polarized light of 632.8 nm wavelength from a 10 mW He-Ne laser was irradiated at the Brewster angle of 53.1˚. The reflected light was magnified with a 40 mm focal length lens and detected by a charge-coupled device fitted with CCD camera (C5948- 70; Hamamatsu Photonics, Hamamatsu). The formation process of DPPC monolayer by spreading method was observed on real-time at 26.0˚C ± 0.1˚C and the typical images were captured in computer with USB-CAP type (SD-USB2CUP3; AREA Co. Ltd.). The lateral resolution of BAM was about 1 μm.
2.6. Infrared External Reflection Spectroscopy (IERS)
The orientation of alkyl chains of DPPC molecule was investigated by (IERS). An FT-IR spectrometer (FTS- 45A; Bio-Rad Inc., FT-IR-600Plus; JASCO Int. Co. Ltd., and FT-IR; JIR-5500; JEOL Inc.,) with a liquid-nitrogencooled MCT detector and a reflectance apparatus were employed in combination. The DPPC-chloroform solution was expanded on the water surface in a poly(tetrafluoroethrene) trough (20 × 62 mm2) at room temperature, according to the spreading method as described in Section 2.2. Two kinds of monolayers of surface pressures of 12, and 42 mN/m were measured after 30 min of preparation to arrive equilibrium. p-polarized IR light at incident angles of 20˚ and 75˚ were irradiated on the monolayer and reflected light was detected by MCT detector to know molecular orientation. More than 1000 scans were averaged with a resolution of four cm−1. The IER spectra were converted to the absorption spectra (k-spectra) by the reported method [14] using Lorentz oscillator model (LOM) calculation under the assumptions:
1) the n values (the real part of complex refractive index) of limiting of the high-wavenumber for in-plane component and the vertical component are 1.50; 2) the thickness of DPPC monolayer is 2 nm; CH2 antisymmetric stretching vibration band (νas(CH2)) and the CH2 symmetric stretching vibration band (νs(CH2) of methylene group are in CH stretching vibration region.
3. RESULTS AND DISCUSSION
3.1. Surface Tension Measurement (STM)
Figure 1(A) shows surface pressure (π) versus molecular area (A) isotherm curve of the DPPC monolayer obtained at 26.0˚C using the dropping method. The horizontal axis represents molecular area calculated from molecular numbers in the dropping volume. The vertical axis represents surface pressure recorded after dropping of DPPC-chloroform droplet on water surface. When surface pressure reached at constant value after a certain time that pressure value was recorded as the value of the composition. We also showed the π-A curve of the DPPC monolayer obtained using compression method in Figure 1(B). Many surface pressure studies of DPPC monolayer formed on the water surface using the compression method [15] have shown that DPPC monolayer forms a liquid-expand (LE) state at low surface pressures and a liquid-condensed (LC) state at high surface pressures. The LE-LC transition occurs at a surface pressure of approximately 8 mN/m also confirmed in Figure 1(B). However, our π-A curve obtained using the dropping method gave a different result as shown in Figure 1(A). The surface pressure increases gradually from molecular area > 1.5 nm2. A transition occurred at molecular area 0.65 nm2 where surface pressure showed a steep increase to a value of 42 mN/m. At 0.5 nm2 surface pressure in compression method is higher (50 mN/m) than dropping method (42 mN/m).
A remarkable point was the limiting molecular area (A0) of DPPC monolayer by dropping method. Under the present experimental conditions, the DPPC monolayer was close to its maximum packing (16) and A0 was 0.65 ± 0.05 nm2/molecule (ca. 40 mN/m).
Advantage of dropping method proved to be that limiting molecular area (A0) of DPPC monolayer at water interface was 0.65 ± 0.05 nm2/molecule corresponded to surface pressure 40 mN/m. While in compression method was A0 was 0.48 nm2/molecule [6].
This value was 30% larger than that by compression method. It is concluded that formation of monolayer by dropping method makes monolayer in a “semi-expanded state” and had a “fluid structure”, similar to the fluidity rich membrane. The hydrophilic group of the DPPC molecules ({-(CO)-O-CH2-, -(CO)-O-}-CH-CH2-O-POO−- (CH2)2-N+(CH3)3) and water molecules would structure themselves in most comfortable hydrogen-bonding network (hydrophilic interaction), since enough time is kept until the interaction between the hydrophilic group and water molecules reaches to equilibrium state after second DPPC-chloroform droplet was dropped on the water surface. It is also possible that the solvent (chloroform) of dropped solution disentangles unbalanced domain of DPPC molecules. Those hydrated water molecules play an important role in maintaining the fluid structure of monolayer formed by the dropping method. Here, we called this new state as “semi-LC phase”.
3.2. Fluorescence Microscopy (FM)
In order to support the interpretation of π-A isotherm of DPPC monolayer, we have recorded the FM observation of DPPC monolayer containing FM probes (Rh-DMPE, 0.1 mol%). Figure 2 shows the FM images of the DPPC monolayer transferred on the cover glass using scoopingup method at four surface pressures (a): 4, (b): 8, (c): 12, and (d): 42 mN/m, the same values as shown in Figure 1(A).
At 4 mN/m (Figure 2(a), the FM image showed the homogeneous dark contrast, which represents LE phase of DPPC monolayer. With increase in dropping volume, the image became bright and monolayer contrast became sharper (Figure 2(b)). At surface pressure 12 mN/m (Figure 2(c)) the monolayer morphology had best contrast that was identified as semi-LC phase. Apart from LC phase there exists LE domain with less bright phase.
Image 2(c) was contrary to that reported previously by compression method [17] in which small and very bright condensed LC domains dispersed in a continuous background of the darker LE phase. This image corresponded to the results of STM which do not show the clear LE to semi-LC transition. A further increase in dropping volume decreased the size of hole-type LE domains (data not shown) and subsequently the image became homogeneous bright of semi-LC phase at 42 mN/m (Figure 2(d)).
From the analysis of fluorescence intensity profile, dark part in Figures 2(a) and (b) coincided with those of dark hole part in Figure 2(c) and bright part in Figure 2(d) also with those of bright domain in Figure 2(c). It was found that the DPPC monolayer by dropping method traced a unique formation process different from that by compression method. The comfortable state between hydrophilic group of DPPC molecules and water molecules
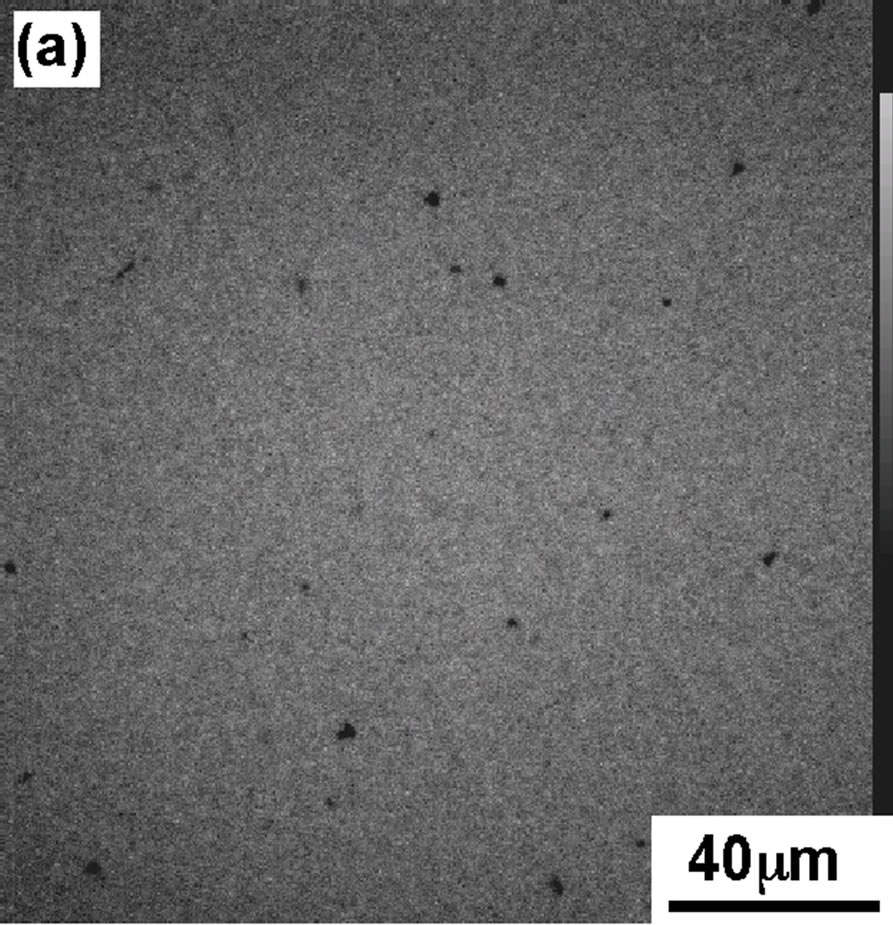
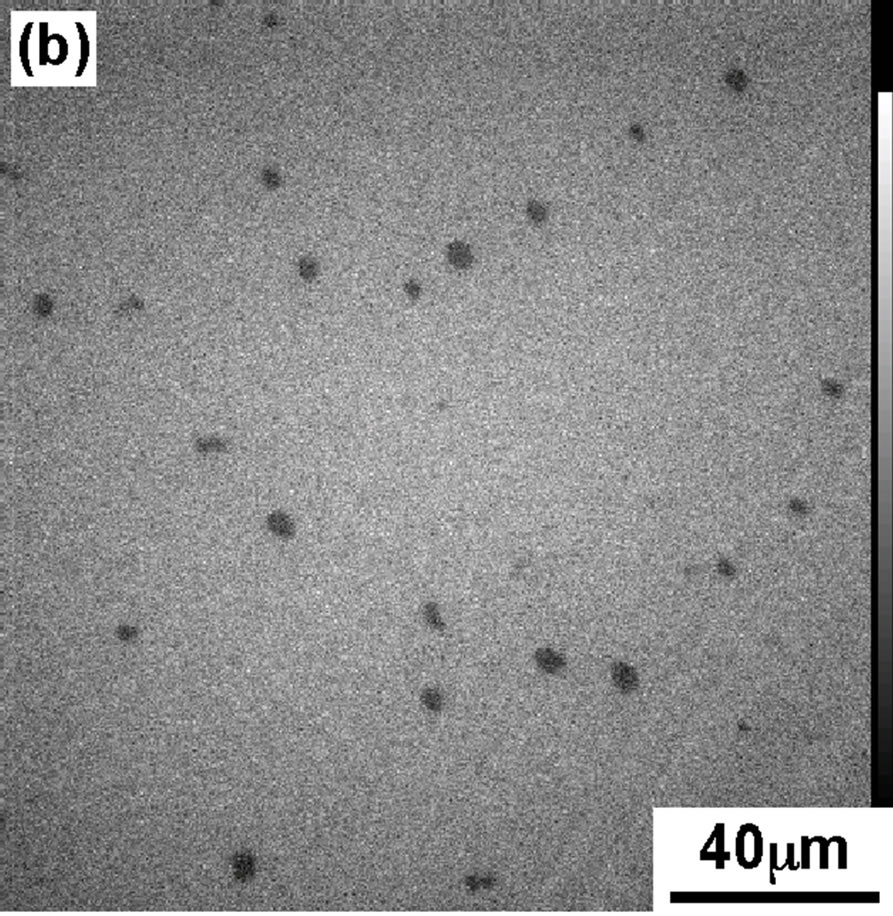
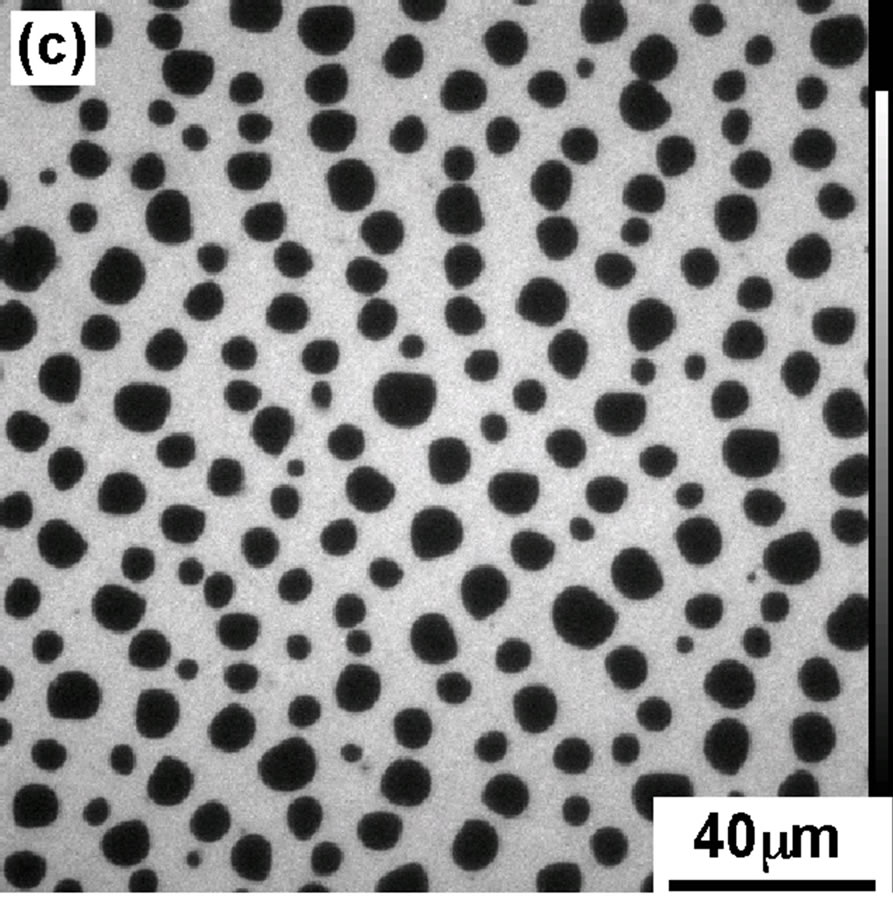

Figure 2. FM images of DPPC monolayer moved on the cover glass at various pressures; (a) 4 mN/m; (b) 8 mN/m; (c) 12 mN/m; (d) 42 mN/m.
would lead to the appearance of expanded semi-LC phase by dropping method.
3.3. Brewster Angle Microscopy (BAM)
FM requires addition of fluorescent amphiphilic probes (Rh-DMPE) in DPPC monolayer to detect fluorescence. However, there is a possibility that FM probes behave as an impurity and affect the original monolayer behavior, though the amount of probes is small of 0.1 mol%. To avoid this unwanted effect on monolayer, we have performed the observation of an in situ direct monolayer by BAM, which does not require additional substances and is sensitive to the surface density and anisotropy monolayer phase.
Figure 3 shows the BAM images of the DPPC monolayer taken at four surface pressures similar to that of FM. At 4 mN/m (Figure 3(a)), the BAM im age showed the homogeneous LE phase with dark contrast. At surface pressure 8 mN/m BAM image is getting slightly brighter but no so big difference can be seen compared to image (Figure 3(a)). With increase in dropping volume further, the image became apparently brighter (Figure 3(c)) indication of appearance of semi-LC phase when surface pressure increased to 12 mN/m. Hole-type LE domain existed in the semi-LC phase at pressure 12 mN/m, same observation was noticed in FM image (Figure 2(c)). A further increase in dropping volume showed homogeneous bright semi-LC phase at 42 mN/m (Figure 3(d)). All BAM images corresponded to the results of FM. The FM observations are secondary as monolayer was mixed with FM probe. However the method gave important observa-
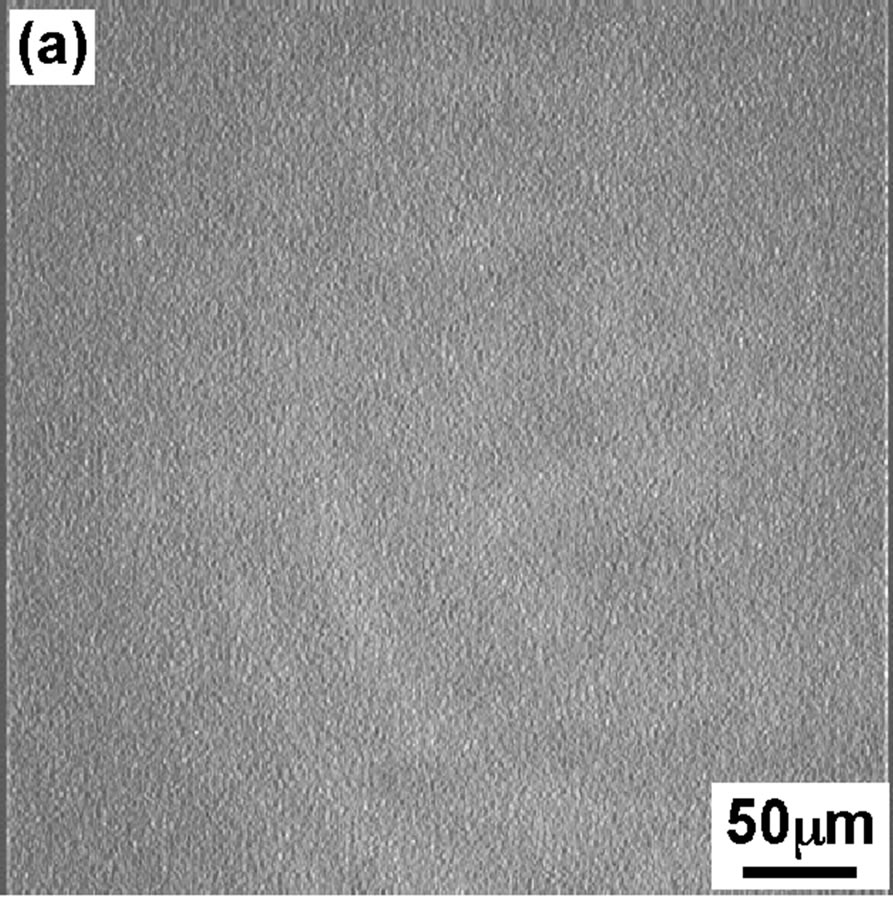
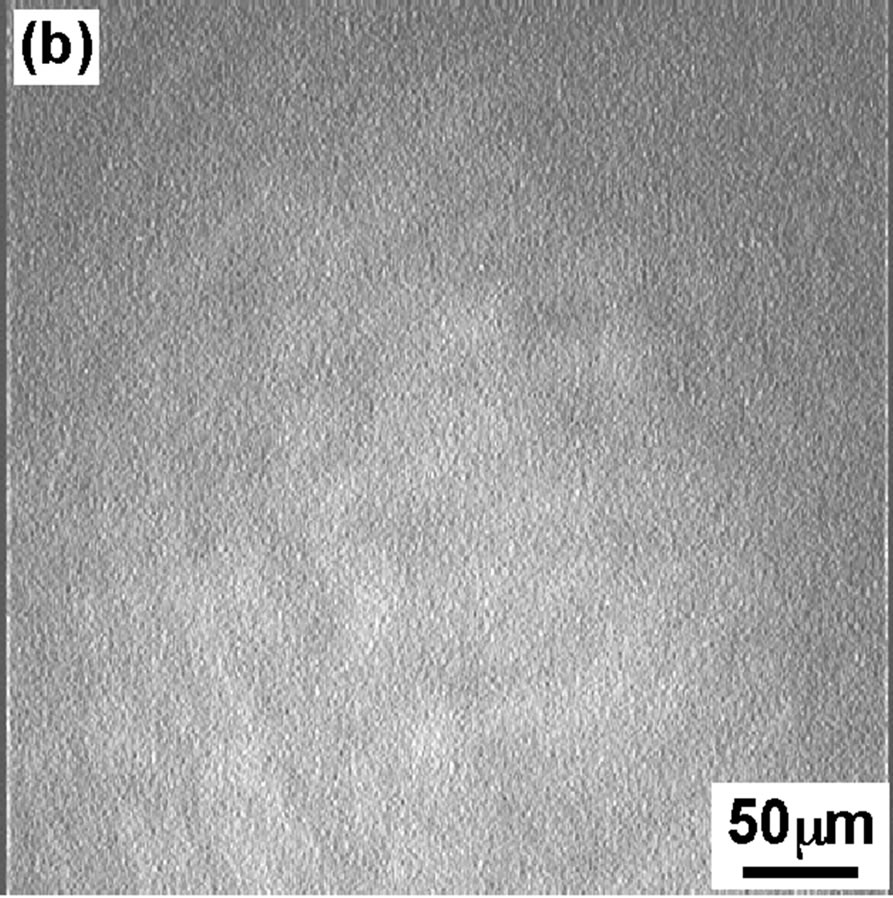
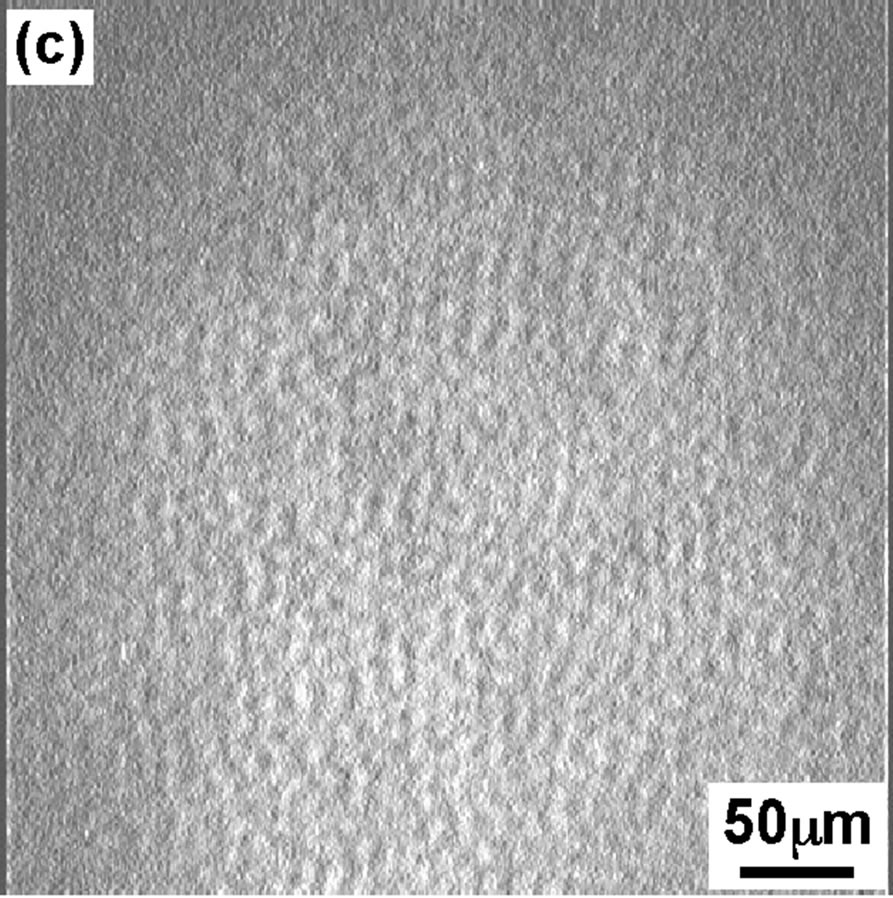
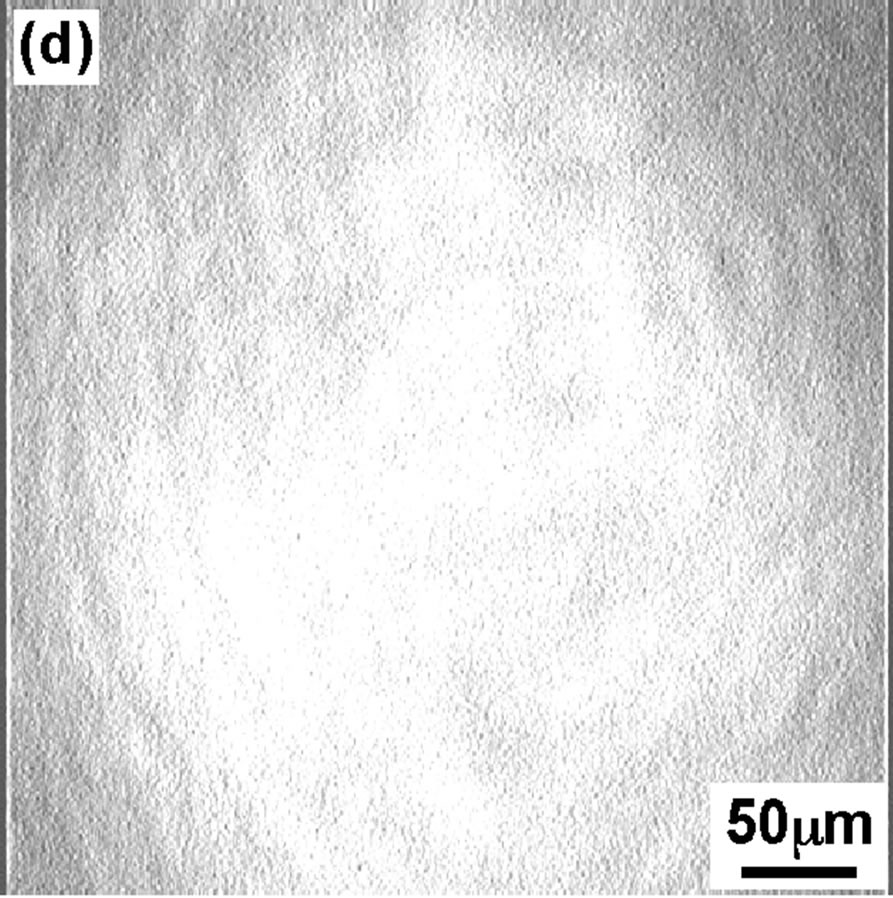
Figure 3. BAM images of the DPPC monolayer at various surface pressures: (a) 4 mN/m; (b) 8 mN/m; (c) 12 mN/m; (d) 42 mN/m.
tion that scooping of monolayer is successful and semiexpanded state of DPPC monolayer was maintained even on the glass as confirmed from BAM observation.
3.4. Infrared External Reflection Spectroscopy (IERS)
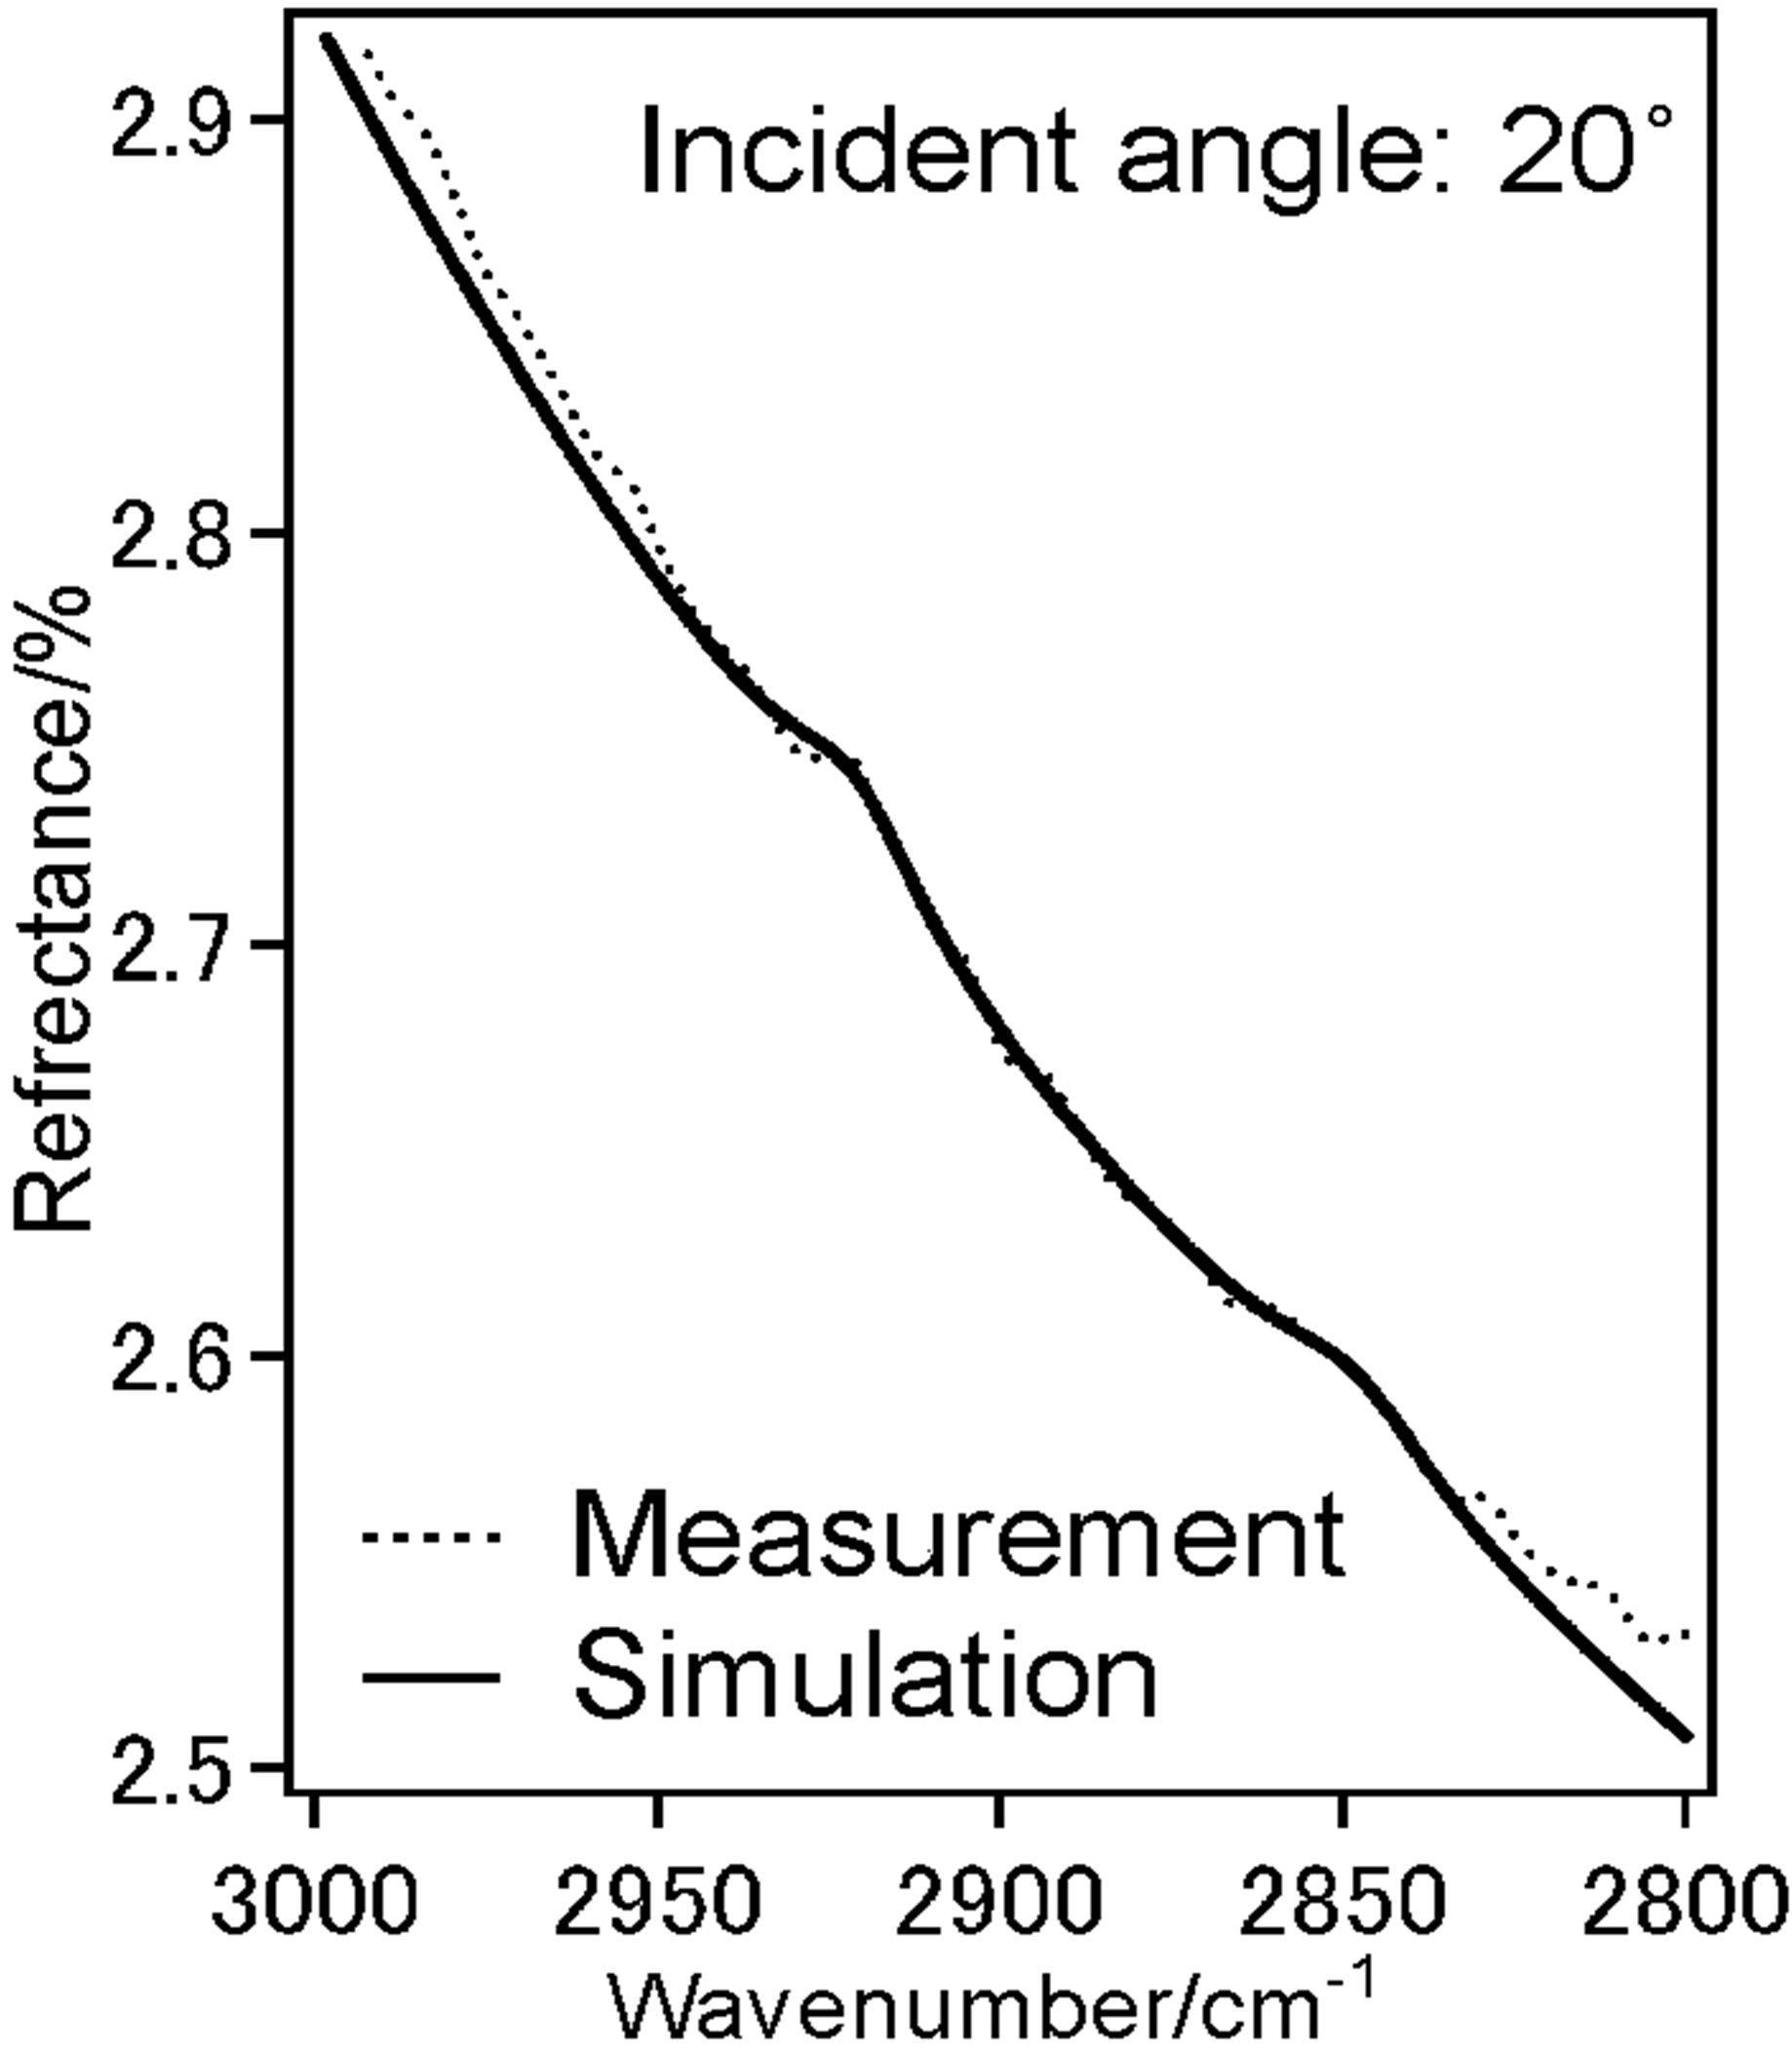
To investigate the molecular orientation of the alkyl chains in the DPPC monolayer, we have performed the IERS measurement of two kinds of DPPC monolayer by using p-polarized light at incident angles 20˚ (Figure 4(a)) and 75˚ (Figure 4(b)). We have recorded spectra at low pressure 12 mN/m and higher pressure 42 mN/m at these two angles 20˚ (Figure 4(c)) and 75˚ (Figure 4(d)).
Dotted line shows measured spectra and solid line is the simulated spectra based on the LOM calculation by assuming a three-layer model. The calculation also provided the absorption spectra (k-spectra) as a function of wavenumber, as shown in Figure 4(e). The solid line represents the components parallel to the DPPC monolayer surface plane x and y.
Dotted line represent those perpendicular to the surface z, out-of-plane. The CH2 anti-symmetric stretching vibration band (ννas(CH2)) and the CH2 symmetric stretching vibration band (ννs(CH2)) for bands of the methylene groups were observed at 2922 cm−1 and 2853 cm−1, respectively.
With increase in surface pressure to 42 mN/m both νas(CH2) and νs(CH2) bands showed the lower-shift in wavenumber. It revealed that the decrease in gauche defect of two alkyl chains in the DPPC monolayer at higher pressure 42 mN/m i.e. the formation of all-trans structure
 (a)
(a)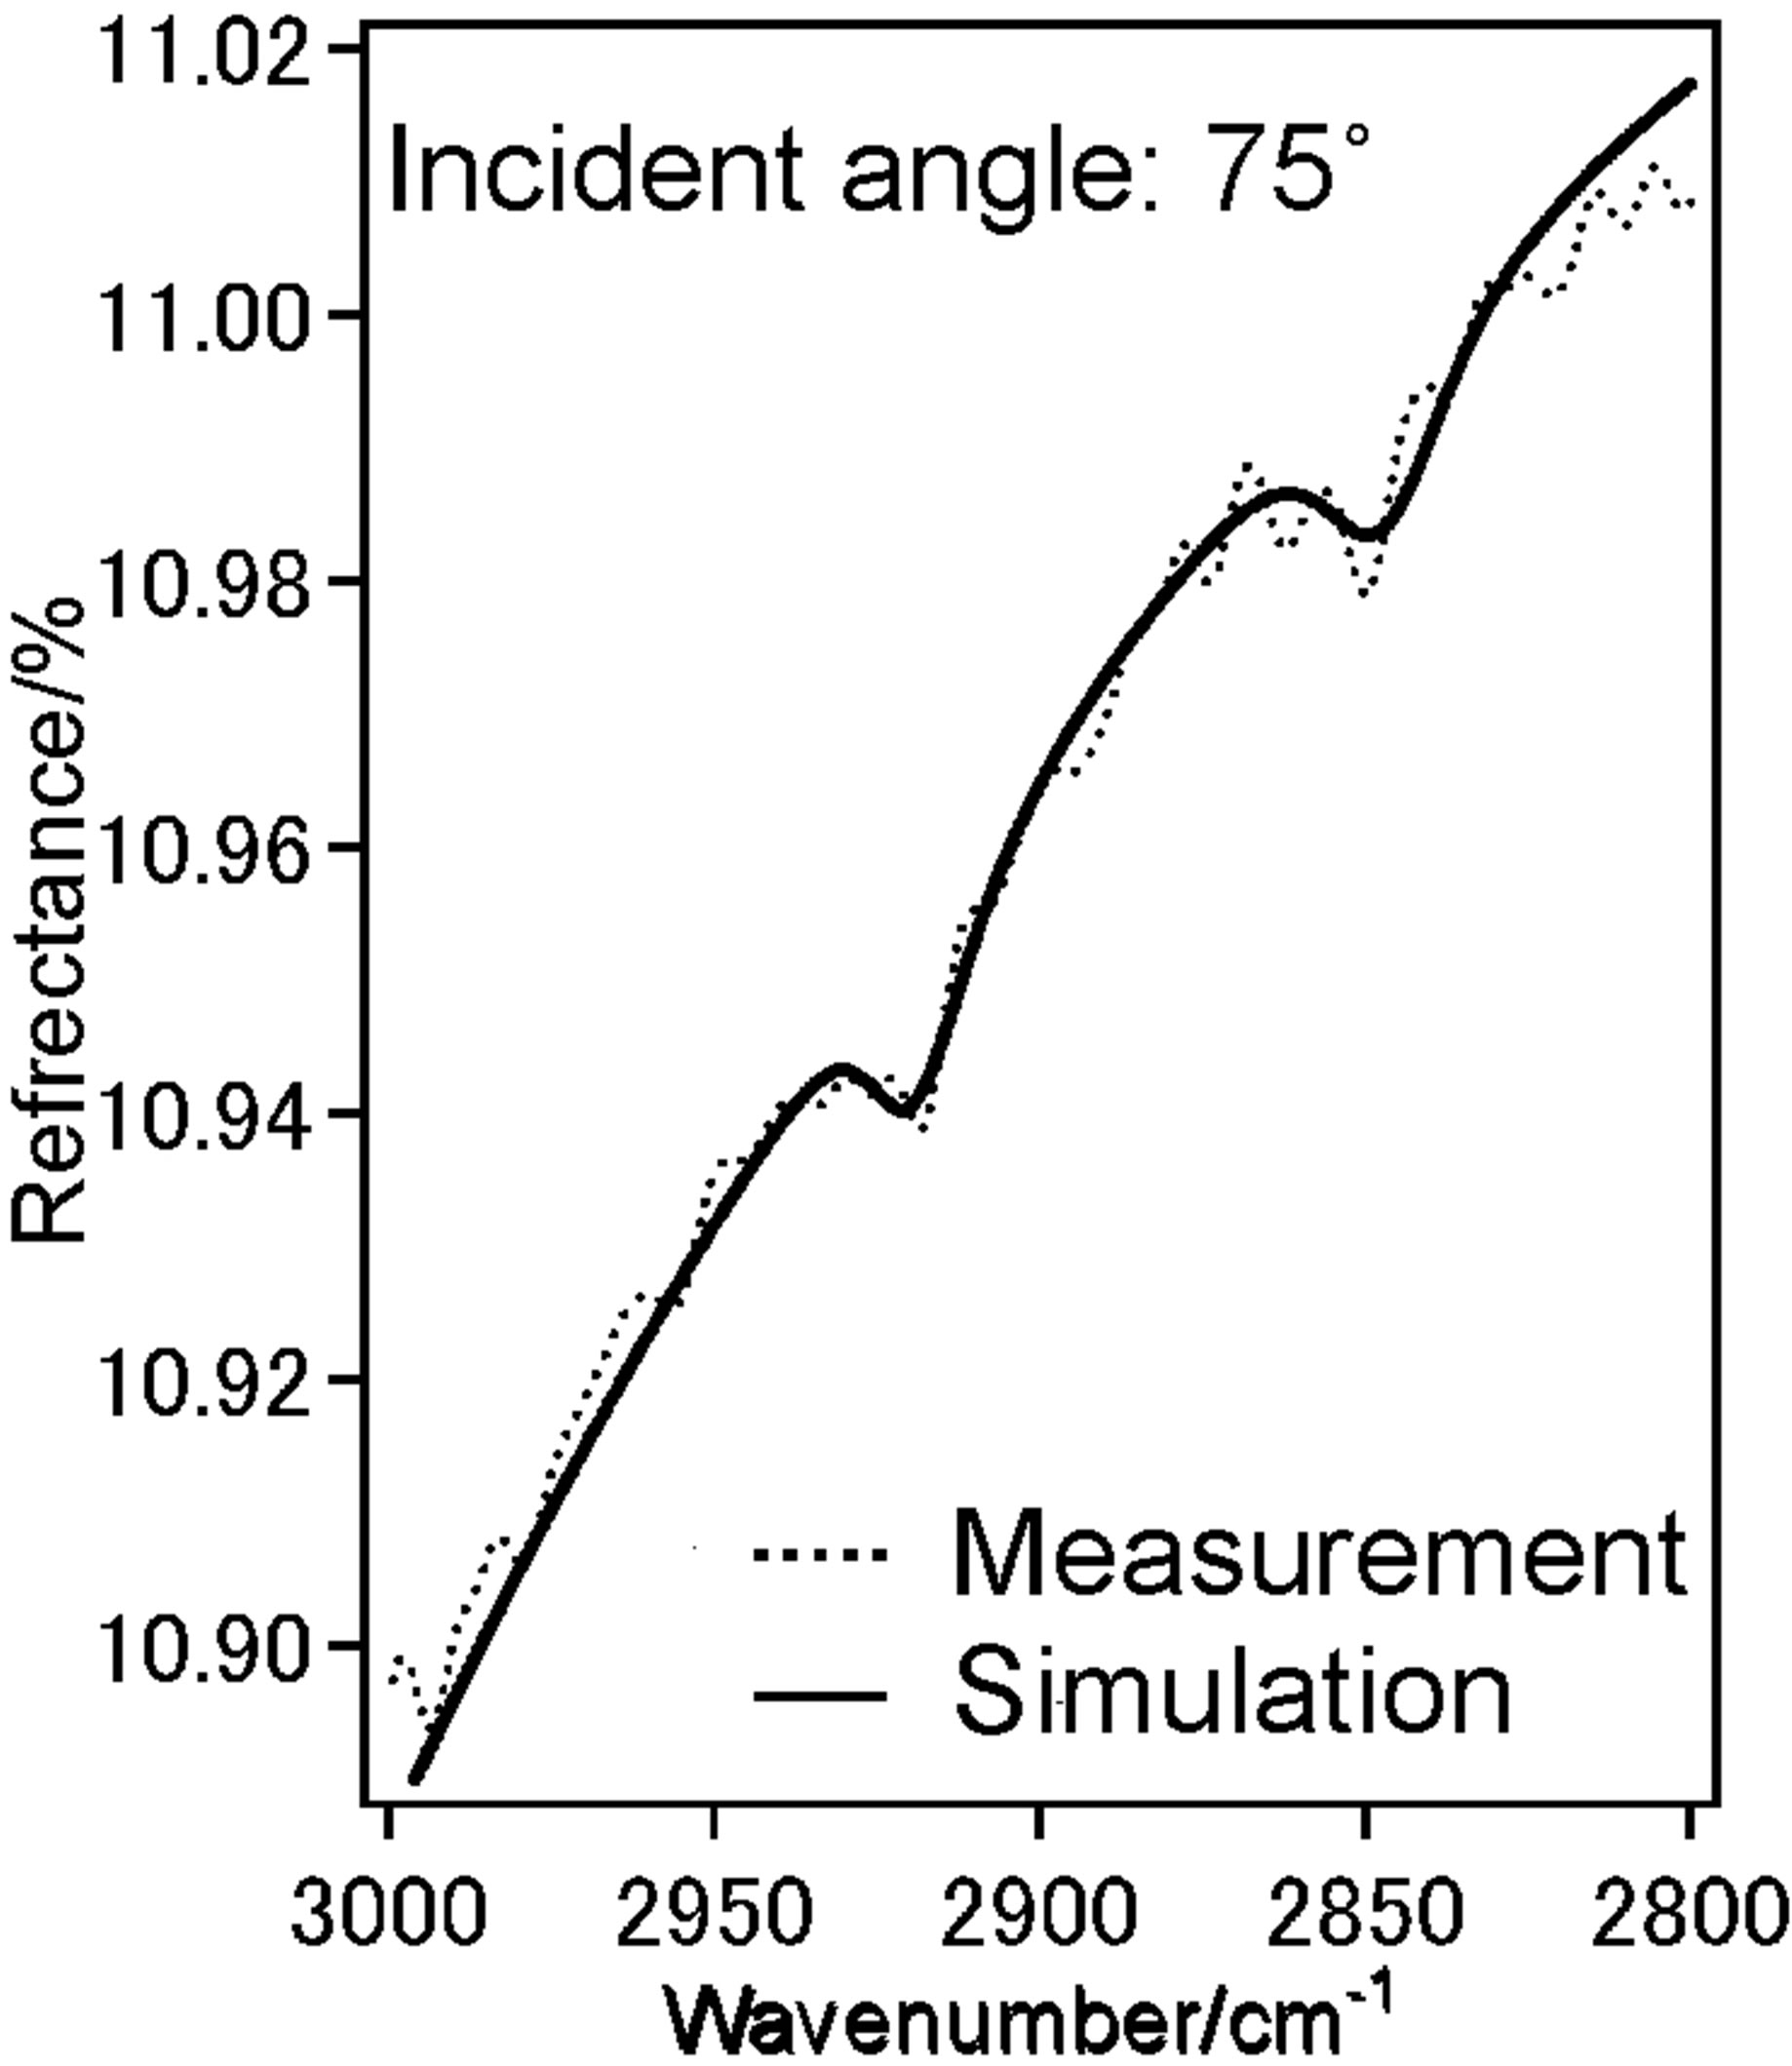 (b)
(b)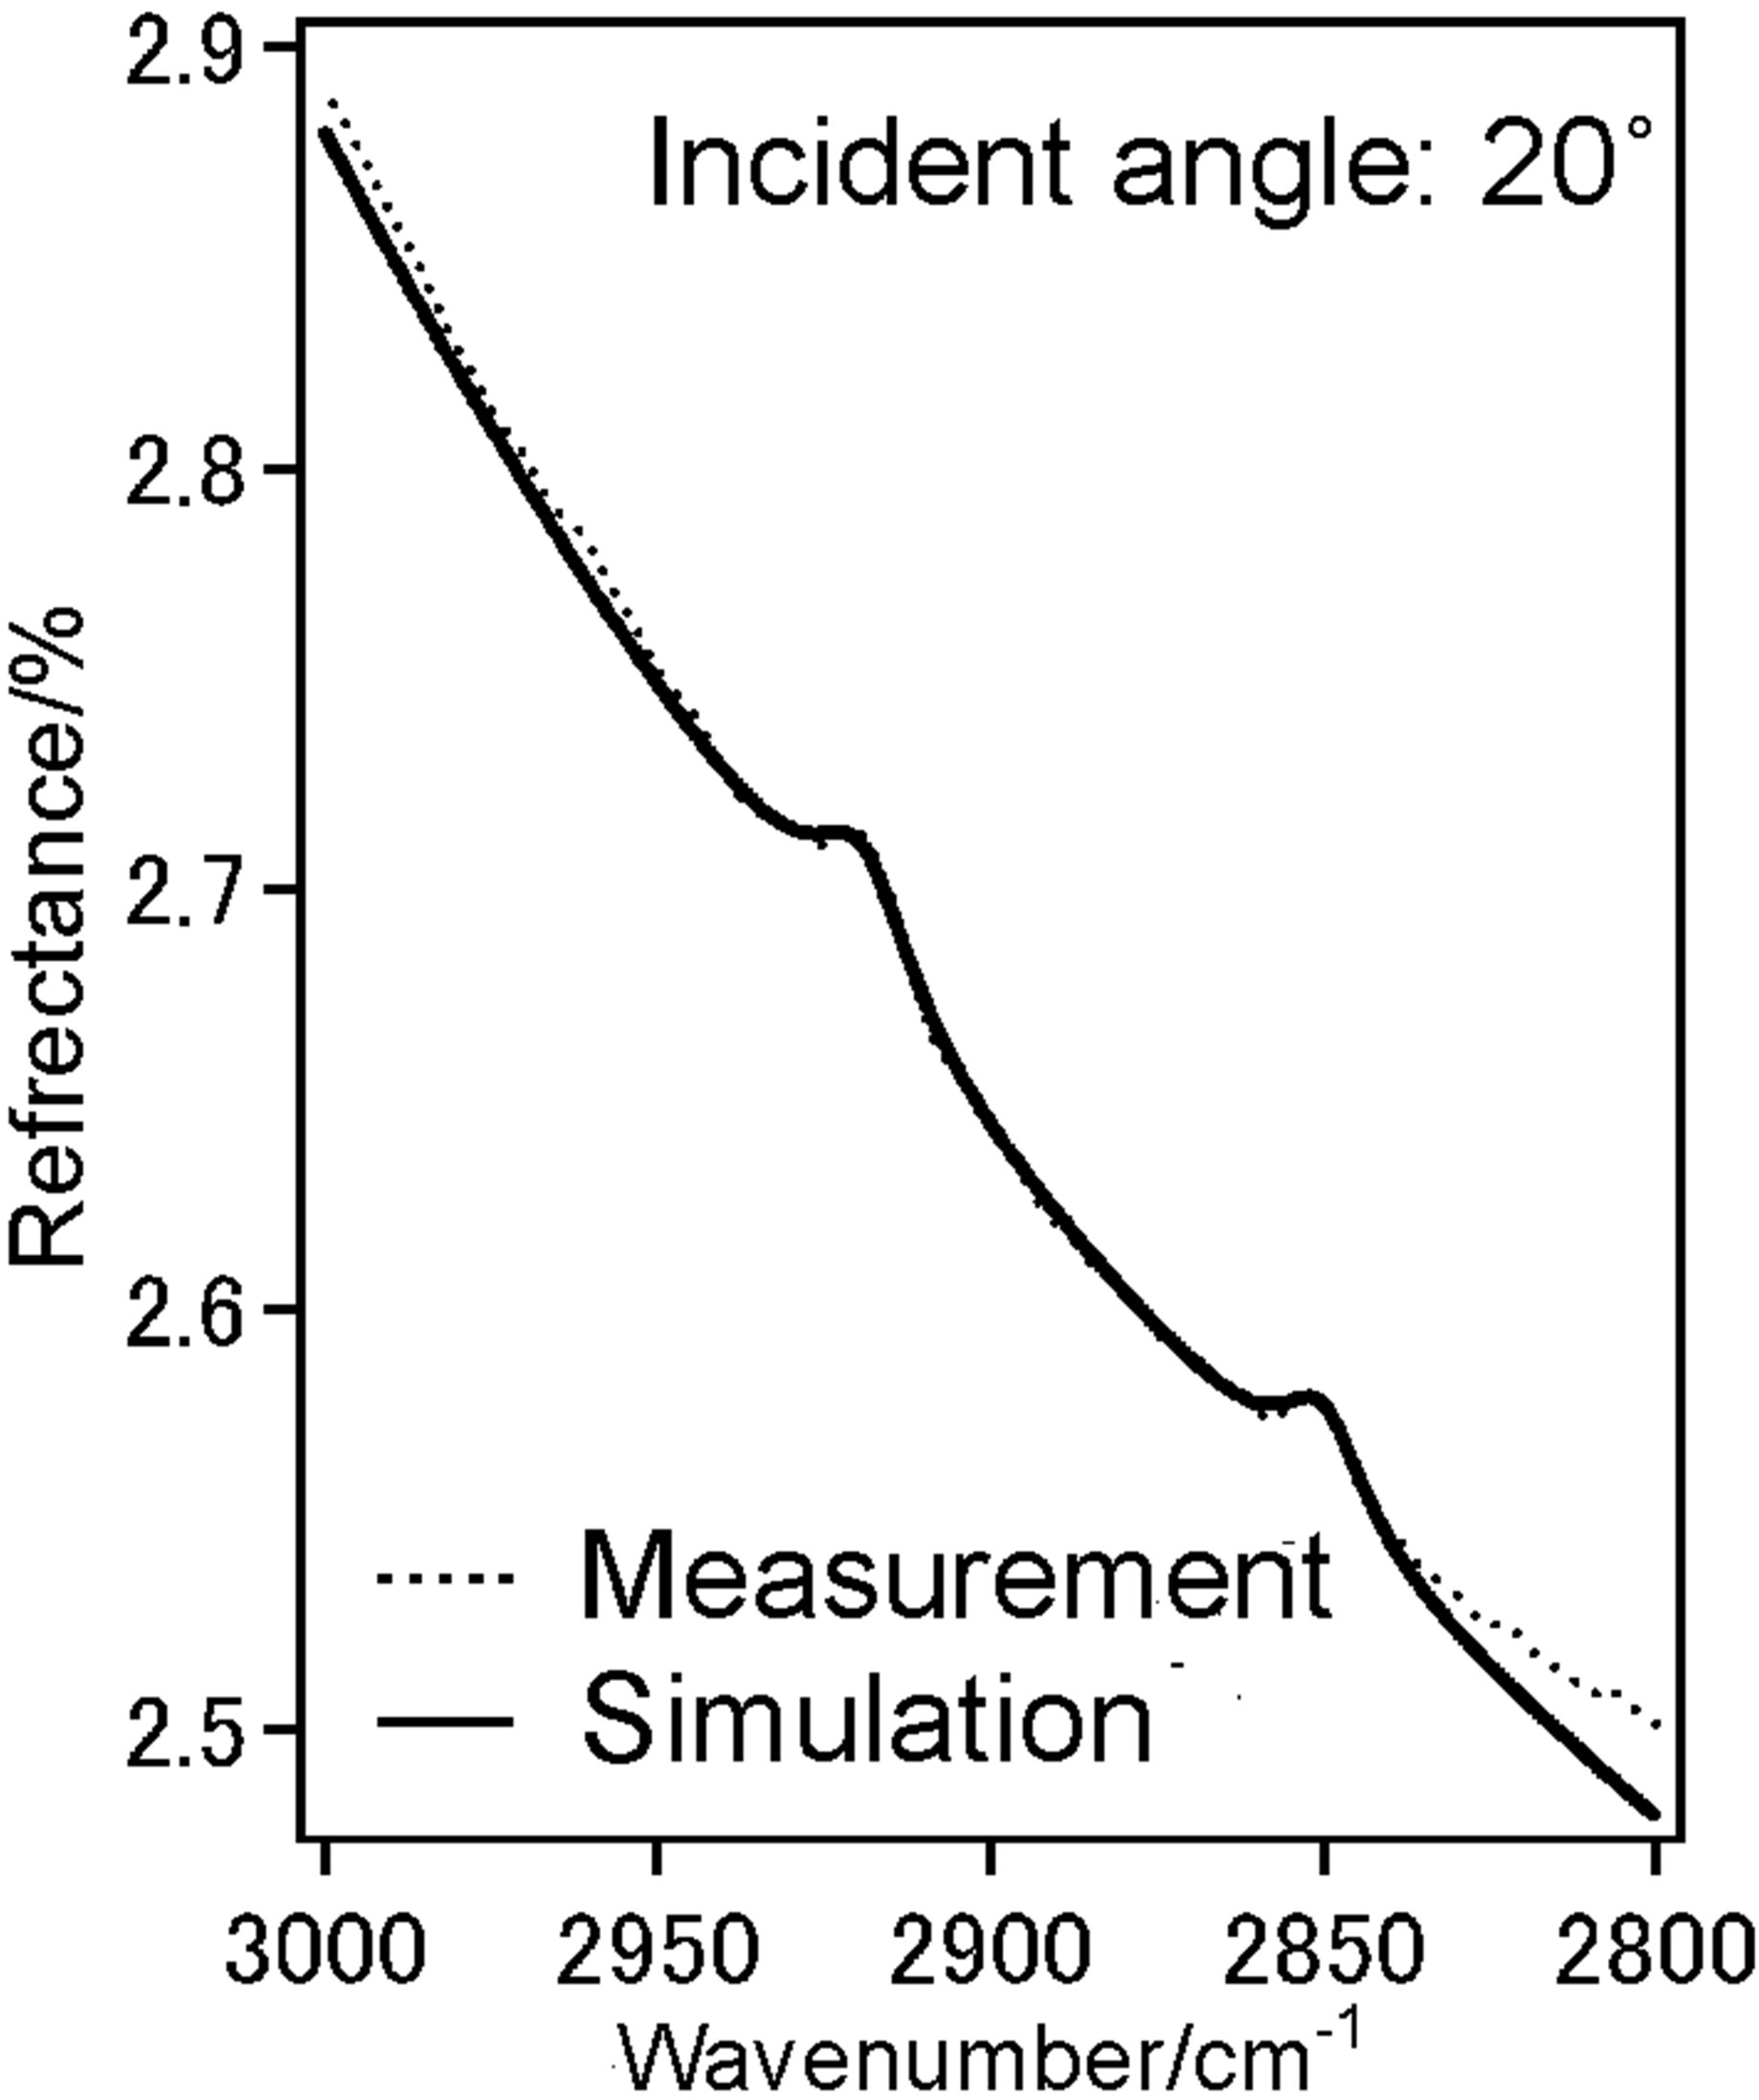 (c)
(c)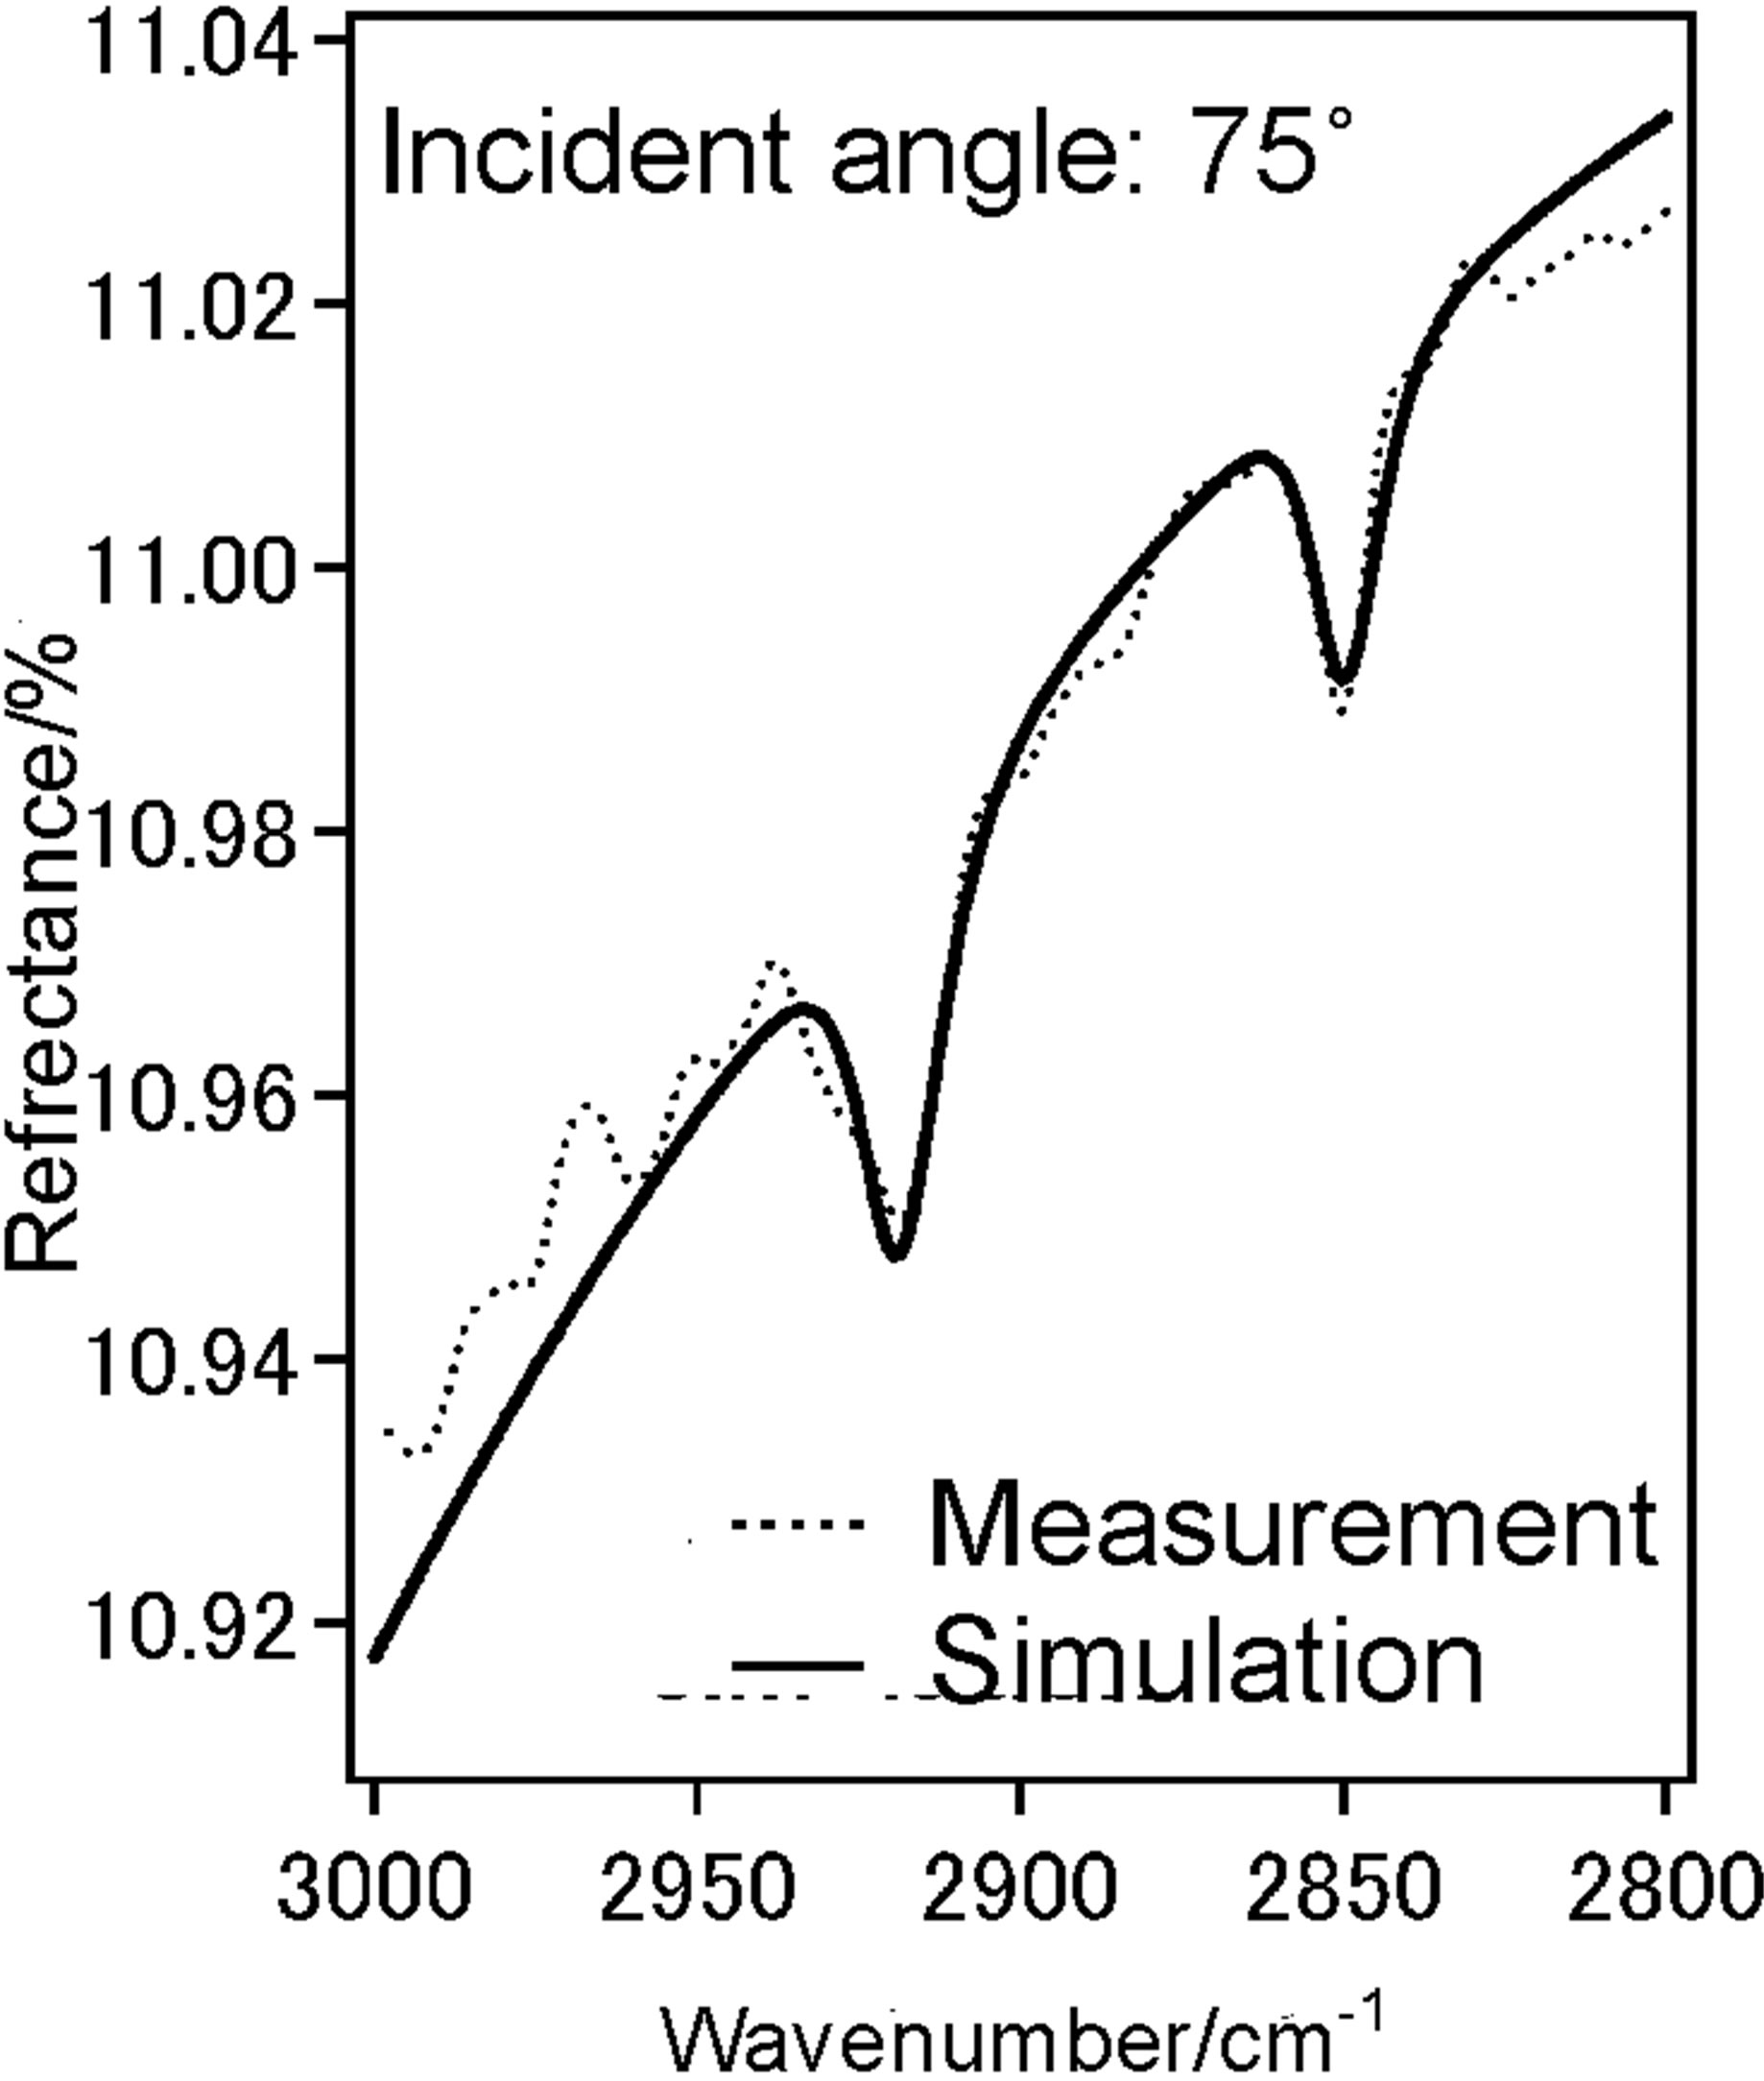 (d)
(d)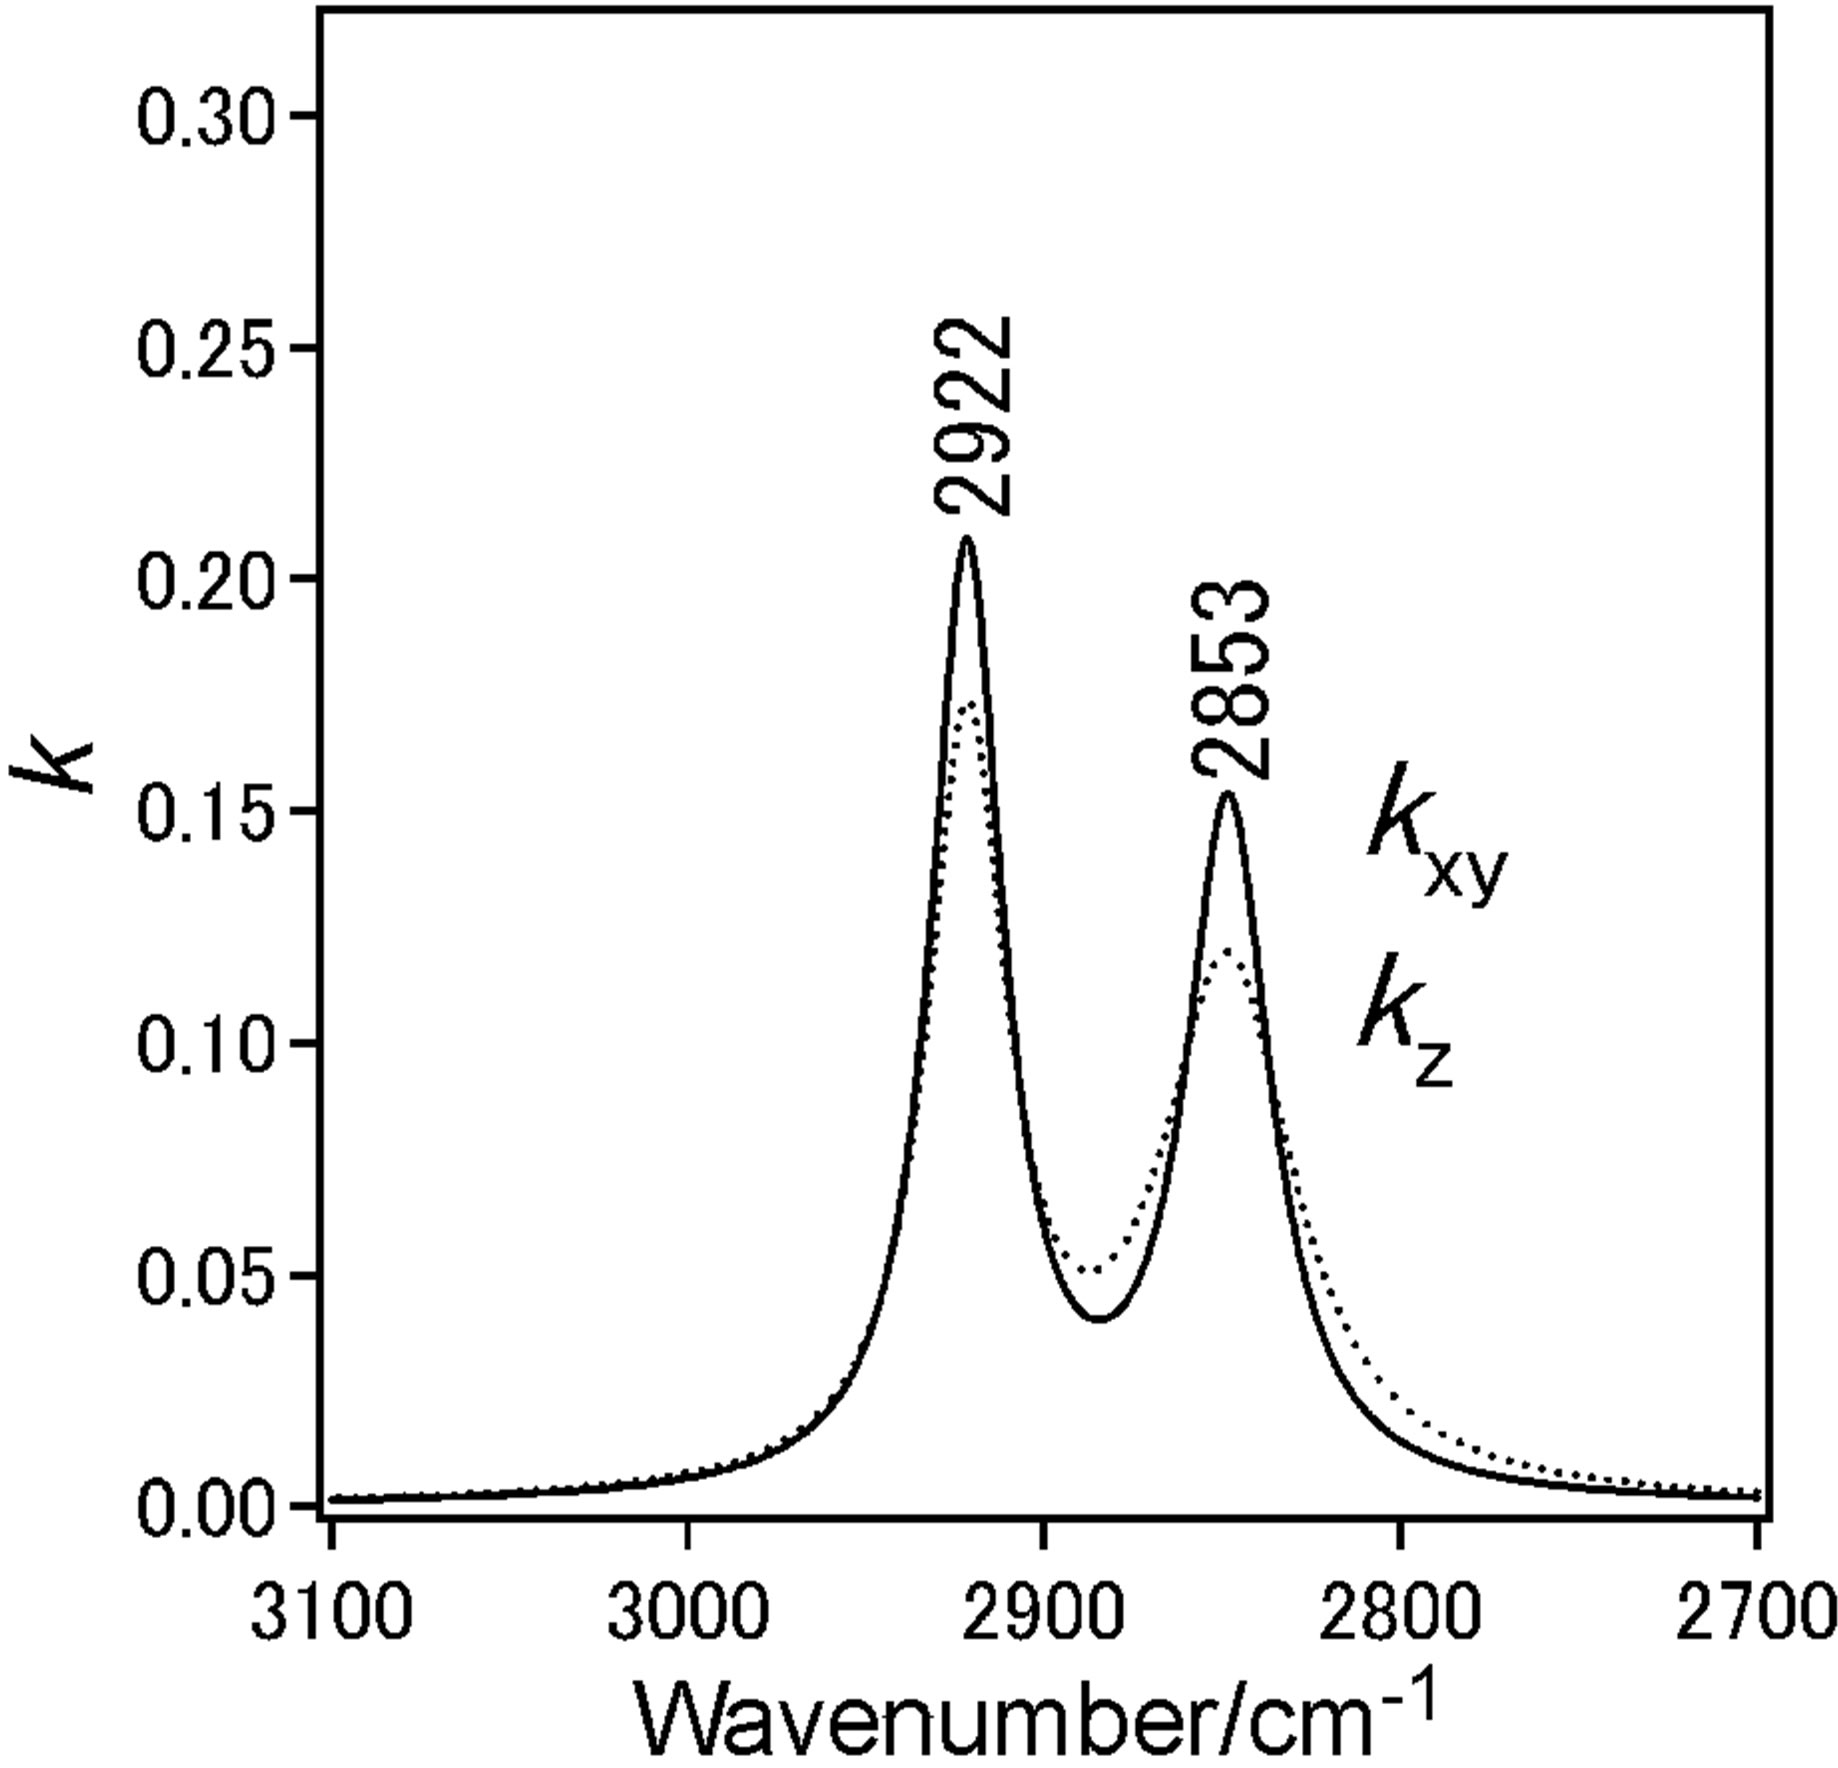 (e)
(e)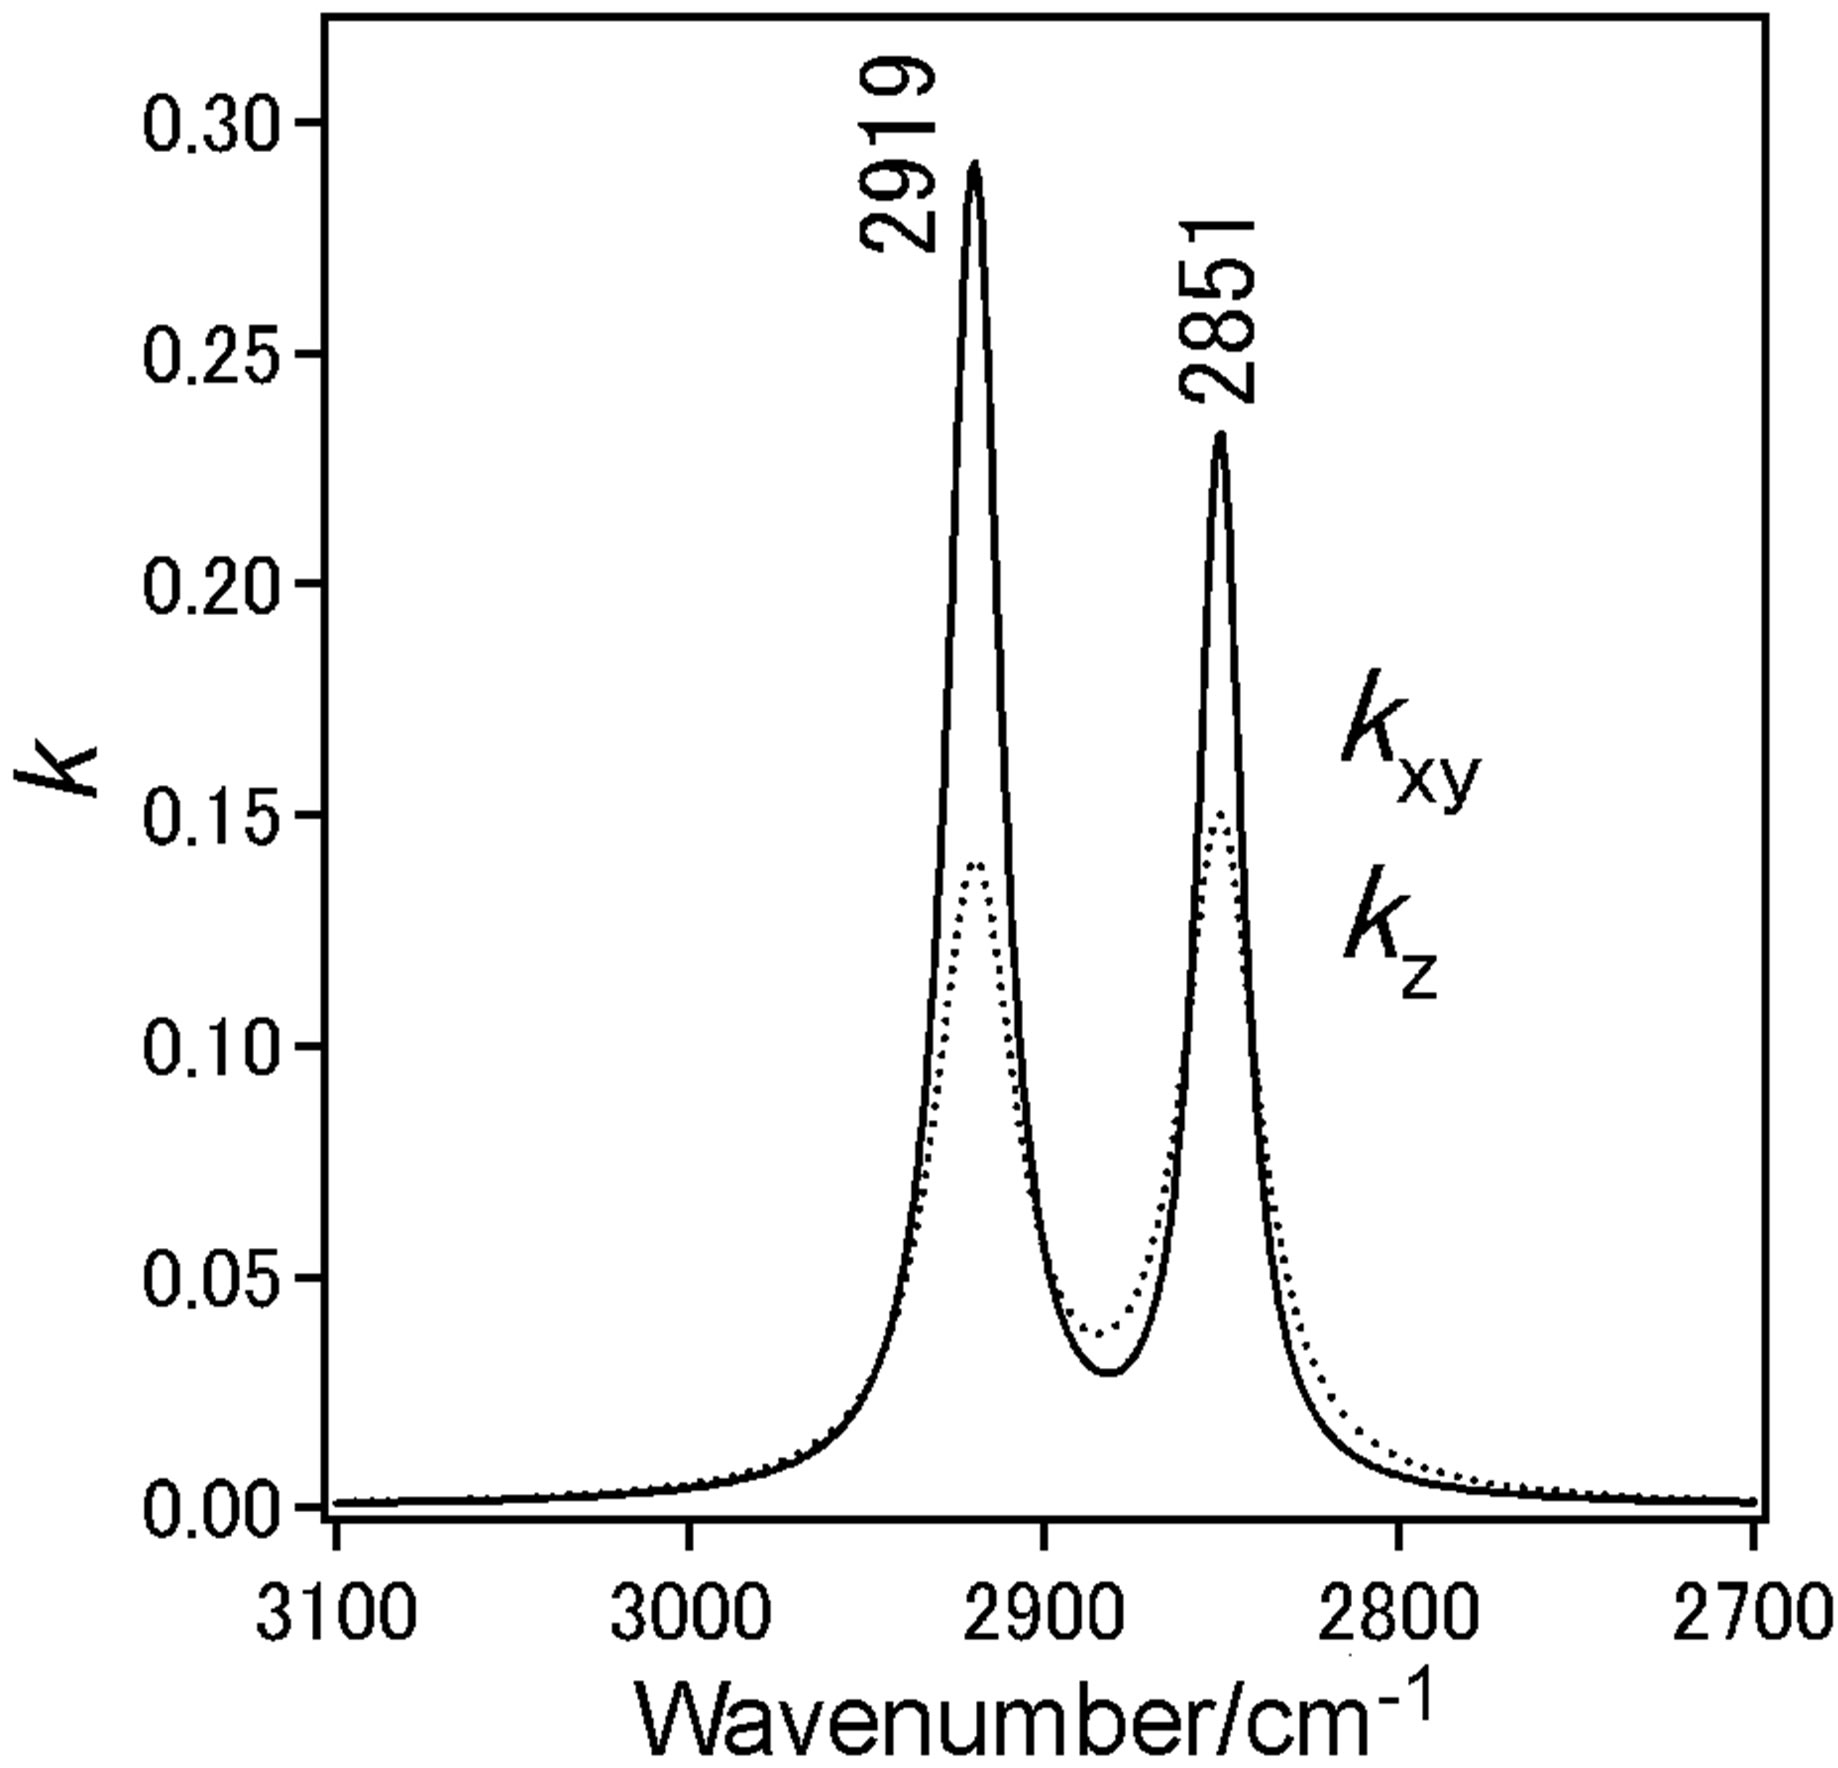 (f)
(f)
Figure 4. (a) IER spectrum of DPPC monolayer at pressure 12 mN/m at incident angle 20˚, (dotted) measured and (solid) simulated spectrum; (b) IER spectrum of DPPC monolayer at pressure 12 mN/m at incident angle 75˚, dotted measured and solid simulated spectrum; (c) IER spectrum of DPPC monolayer at pressure 42 mN/m at incident angle 20˚, dotted measured and solid simulated spectrum; (d) IER spectrum of DPPC monolayer at pressure 42 mN/m at incident angle 75˚, dotted measured and solid simulated spectrum; (e) IER spectrum of DPPC monolayer at pressure 12 mN/m at incident angle 75˚, dotted measured and solid simulated spectrum; (f) IER spectrum of DPPC monolayer at pressure 42 mN/m at incident angle 75˚, dotted measured and solid simulated spectrum.
of chains. The inten sity ratio of νs(CH2)/νas(CH2) of bulk DPPC molecules was in range 0.6 - 0.7. This value presents isotropic orientation of methylene groups.
At coexistence state of LE and semi-LC phase at 12 mN/m anisotropy orientation of methylene groups in DPPC monolayer could not be find out in kyx and kz spectra at 12 mN/m. In kz spectrum of the DPPC monolayer at 42 mN/m, the ratio was more than 1 (Figure 4(f)), suggesting the anisotropic orientation of alkyl chains in the monolayer at semi-LC phase (42 mN/m). This means that the axis of alkyl chain is tilting from normal monolayer surface and the plane of carbon skeleton plane tends to stand from the surface plane [18]. These IERS results correspond to that of STM at which the A0 by dropping method was larger than that by compression method as described in Section 3.1.
4. CONCLUSION
DPPC’s peculiar phase structures (crystalline, gel, ripple, liquid crystal) of various aggregation (micelle, vesicle, liposome, lamella) in water phase have been extensively studied using differential thermal analysis, X-ray diffraction, small angle X-ray scattering, neutron scattering measurement and nuclear magnetic resonance [2,19]. These measurements showed that these aggregates were hydrated by many water molecules in hydrophilic DPPC molecule [20]. Monolayer of DPPC at water interface generally exists in environment that upper part of monolayer is in gas-like phase i.e. very loosely bound water. For this reason, the morphology of monolayer is different from other lipid aggregates mentioned above. Numbers of physicochemical methods that we have employed have revealed that DPPC monolayer formed on water surface by the dropping method is semi-expanded and has a fluidic structure which is different from condensed DPPC monolayer mostly obtained by compression method. The advantage of dropping method is the spontaneous behavior of DPPC molecules on water surface that is apparent and dominant where DPPC molecules on water surface are able to arrange in comfortable states due to interaction between hydrophilic groups and bulk water.
5. ACKNOWLEDGEMENTS
This work was supported in part by a Grant-in-Aid from the Ministry of Science, Education, Sports and Culture (No. 15750118 and 21750143), DVA Medical Research and Development Funds.
REFERENCES
- Singer, S.J. and Nicolson G.L. (1972) The fluid mosaic model of the structure of cell membranes. Science, 175, 720-731. http://dx.doi.org/10.1126/science.175.4023.720
- Gennis, R.G. (1990) Biomembrane, molecular structure and function. Springer, New York.
- Ohnishi, S. (1993) Seitaimaku no doutekikouzou. 2nd Edition, University Tokyo Press, Tokyo.
- Takahashi, H., Yasue, T., Ohki, K. and Hatta, I. (1996) Structure and phase behavior of dimyristoylphosphatidic acid/poly(L-lysine) systems. Molecular Membrane Biology, 13, 233-240. http://dx.doi.org/10.3109/09687689609160601
- Shimabayashi, S., terada, H. and Okabayashi, H. (1990) Seitai Colloid, Hirokawa Pub. Co., Tokyo.
- Ohe, C., Ida, Y., Matsumoto, S., Sakaki, T., Goto, Y., Noi, M., Tsurumaru, T. and Itoh, K. (2004) Investigations of polymyxin B-phospholipid interactions by vibrational sum frequency generation spectroscopy. The Journal of Physical Chemistry B, 108, 18081-18087. http://dx.doi.org/10.1021/jp0404347
- Ebara, Y. and Okahata, Y. (1994) A kinetic study of concanavalin A binding to glycolipid monolayers by using a quartz-crystal microbalance. Journal of the American Chemical Society, 116, 11209-11212,
- Sato, T., Serizawa, T., Ohtake, F., Nakamura, M., Terabayashi, T., Kawanishi, Y. and Okahata, Y. (1998) Quantitative measurements of the interaction between monosialoganglioside monolayers and wheat germ agglutinin (WGA) by a quartz-crystal microbalance. Biochimica et Biophysica Acta, 1380, 82-92. http://dx.doi.org/10.1016/S0304-4165(97)00133-5
- Okahata, Y. and Furusawa, H. (2004) Gravimetry of biomolecules at the water-substrate interface: Quartz-crystal microbalance. Hyoumen Kagaku, 25, 131-138. http://dx.doi.org/10.1380/jsssj.25.131
- Myers, D. (1991) Surfaces, interfaces, and colloids. VCH, Weinheim.
- Nagayama, K. (2000) Mizu to seimei. Kyoritsu Publication, Tokyo.
- Makino, M. and Kamiya, M. (1996) Effects of local anesthetics on the dynamic behavior of phospholipid thin film. Langmuir, 12, 4221-4217. http://dx.doi.org/10.1021/la950917p
- Kato, T., Matsumoto, N., Kawano, M., Suzuki, N. and Iriyama, K. (1994) Transition to three-dimensional structures in monolayers of a series of long-chain acids on the water surface by compression studied by transmission electron microscopy and atomic force microscopy. Thin Solid Films, 242, 223-228. http://dx.doi.org/10.1016/0040-6090(94)90534-7
- Yamamoto, M., Suzuki, M., Kimura, T. and Itoh, K. (2008) Molecular structures at free surfaces of liquid nheptadecane investigated by infrared external reflection spectroscopy. The Journal of Physical Chemistry C, 112, 13232-13239. http://dx.doi.org/10.1021/jp801414t
- Mingotaud, A.F., Mingotaud, C. and Patterson, L.K. (1993) Handbook of monolayers, Vol. 1. Academic Press, San Diego.
- Yoshida, T., Koga, Y., Minowa, H., Kamaya, H. and Ueda, I. (2000) Interfacial lateral electrical conductance on lipid monolayer: Dose-dependent converse effect of alcohols. Journal of the American Chemical Society, 104, 1249- 1252. http://dx.doi.org/10.1021/jp992715y
- Burn, A., Brezesinsuki, G., Möhwald, H., Blanzat, M., Perez, E. and Rico-Lattes, I. (2003) Interaction between phospholipids and new Gemini catanionic surfactants having anti-HIV activity. Colloids and Surfaces A: Physicochemical and Engineering Aspects, 228, 3-16. http://dx.doi.org/10.1016/j.colsurfa.2003.08.008
- M. Yamamoto, D. Yoshida, T. Yokoyama, H. Mori, K. Sekiguchi, Y. Yamamoto and K. Taga, “DPPC Langmuir Monolayer Prepared by Dropping Method: Probing the Tail Groups by Infrared External Reflection Spectroscopy.”
- Hatta, I. and Murata, M. (2000) Seitaimaku no dainamikusu. Kyouritsu Publication, Tokyo.
- Gauger, D.R., Selle, C., Fritzsche, H. and Pohle, W. (2001) Chain-length dependence of the hydration properties of saturated phosphatidylcholines as revealed by FTIR spectroscopy. Journal of Molecular Structure, 565-566, 25-29. http://dx.doi.org/10.1016/S0022-2860(00)00777-8