Journal of Biophysical Chemistry
Vol.3 No.3(2012), Article ID:21936,10 pages DOI:10.4236/jbpc.2012.33024
Quantitative measurement of p53-p53 antibody interactions by quartz crystal microbalance: A model system for immunochemical calibration
![]()
Biochemical Science Division, National Institute of Standards and Technology, Gaithersburg, USA; *Corresponding Author: HUdonald.atha@nist.govU
Received 13 March 2012; revised 26 April 2012; accepted 10 May 2012
Keywords: Quartz Crystal Microbalance (QCM); Antibody Characterization; p53 Immobilized Protein; Immunochemistry; Immunohistochemistry (IHC); Immunocytochemistry
ABSTRACT
We are developing methods to quantify antibody interactions that include a quartz crystal microbalance (QCM) system to measure, on a molecular basis, the interaction of p53 and anti-p53 antibodies. Previously, as a model system, we developed a measurement device consisting of p53 protein (human wild type), characterized by mass spectroscopy and immobilized at various concentrations on a glass slide. The device is designed as a control to be used with immunohistochemical (IHC) assays that incorporate commercially available anti-p53 antibodies and probes. In the current study, p53 protein is covalently immobilized on a silicon dioxide-coated quartz crystal and the resonance frequency shift is followed in-situ. The functionalized sensor is then incubated with the anti-p53 antibody, which provides a direct gravimetric measure of the antibody-antigen binding. This previously described method allows the comparison of the surface immobilized protein concentrations with estimates obtained by fluorescence measurement. The p53 functionalized QCM system offers an independent measure of surface immobilized protein concentration and is essential in development of our IHC calibration prototypes. These results provide a benchmark for comparing antibody systems that may be used in developing other molecular diagnostic assays such as immunocytochemical analysis and the detection of biomarker proteins in blood and urine.
1. INTRODUCTION
Antibody reagents are used in a wide range of immunochemical methods such as ELISA, microscopy and flow cytometry. In immunohistochemistry (IHC), for example, the use of fluorophore-labelled antibodies is particularly useful in localizing target proteins and identifying cellular structures that contain these proteins. Since IHC involves a specific antigen-antibody reaction, it has an apparent advantage over traditionally used staining techniques that identify only a limited number of proteins and tissue structures. A critical problem in the use of IHC, however, has been the lack of universally accepted reference methods and materials. Such standards would be valuable tools that could expedite the acceptance and translation of biomarkers, such as telomerase and p53, for clinical use. Previously, we have shown that flow cytometry in combination with fluorescence microscopy can be used to evaluate antibody reagents used for telomerase detection [1]. In the current study, we compared three different monoclonal antibodies (clones: BP53.12, PAb 1801 and DO-1) for their ability to detect p53 in HT1080 cells. Both visible microscopy (diaminobenzidine probe) and the flow cytometry (AlexaFluor 488 probe) showed significant increases in staining intensity compared to controls without the primary antibody (Supplementary data). This demonstrated that the antibodies used in this study were active using IHC methods commonly used in clinical research. However, quantification of these assays requires direct measurement of the concentration of the surface bound p53 and the antibodies. For this we have developed a model system for characterizing p53 antibodies using a quartz crystal microbalance (QCM) [2]. Our application of the previously described QCM method [3,4] provides independent quality control of the reagents used in IHC with particular regard to the antibody sensitivity and specificity [5]. To validate this use of the QCM, we compared our QCM measurements with those of flow cytometry and IHC.
2. MATERIALS AND METHODS
2.1. Materials
Dulbecco’s phosphate buffered saline (PBS) without calcium and magnesium, (Gibco, Cat. 14190) was used to prepare all protein solutions, antibody dilutions, and buffer washes of the quartz crystal. A commercial preparation of recombinant wild-type human p53 protein was obtained from Protein one, Inc. (Bethesda, MD). The preparation was previously characterized by 2-D chromatography and mass spectrometry [6]. Three mouse monoclonal anti-p53 antibodies were used (described in Table 1). Clone BP53.12 was obtained from Zymed Laboratiories, Invitrogen, Inc., Clone PAb 1801 was obtained from EMD Biosciences Inc. and clone DO-1 was obtained from Calbiochem, Inc.
2.2. Quartz Crystal Microbalance: Crystal Surface Preparation
The Quartz crystal experiments were performed using 1 inch AT-cut, 5 MHz resonant frequency quartz crystals (Tangydyne Inc.). The crystal surfaces were sputtered with a 70 nm SiO2 layer to imitate the surface of the glass slides used in our previous study [6]. While the molecular structure of the sputtered SiO2 film may not be identical to the commercial glass slide surface, we were able to utilize a similar protein attachment protocol using silanization and amide linkage through glutaraldehyde. Prior to derivatization, the crystals were immersed in anhydrous acetone (Aldrich) for 24 h, followed by immersion into 2% (v/v) 3-aminopropyltriethoxysilane (Sigma-Aldrich) acetone solution for 1 min. The crystals were repeatedly rinsed in acetone and deionized water and exposed for 1 h in 1% glutaraldehyde (EMS Inc.) solution in phosphate buffered saline (PBS). Silanized crystals were stored immersed in PBS for several hours prior to mounting them in the microbalance crystal holder.
2.3. Quartz Crystal Microbalance: Apparatus
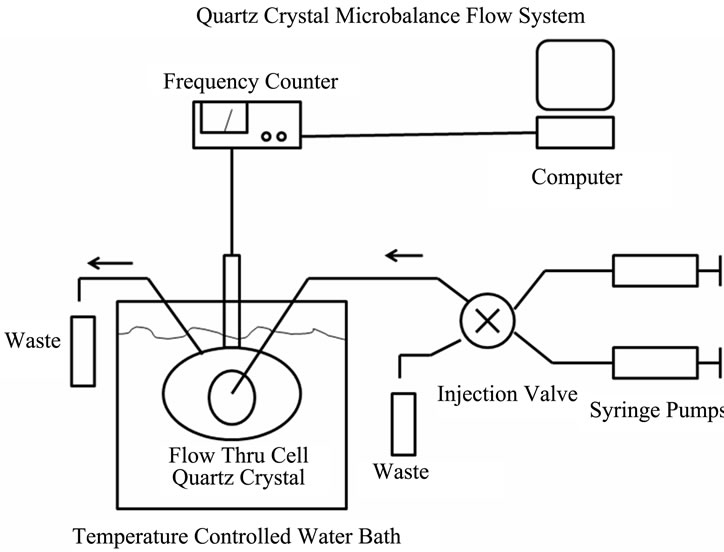
Surface-derivatized crystals were mounted in a Teflon crystal holder of Stanford Research Systems QCM200 quartz microbalance device with one crystal face exposed to solution (see Figures 1(a) and (b)). A Teflon flow through cell (internal volume 125 μL, SRS Inc.) was totally immersed in the thermostated water bath (Lauda E100) that maintained crystal temperature at 25 ± 0.1˚C. Solutions were continuously pumped through the cell at 20 μL/min using 1 mL glass syringes (BD) mounted in the syringe pumps (KD Scientific). Flow cell inputs were controlled by the HPLC valve (Rheodyne 7000). Both
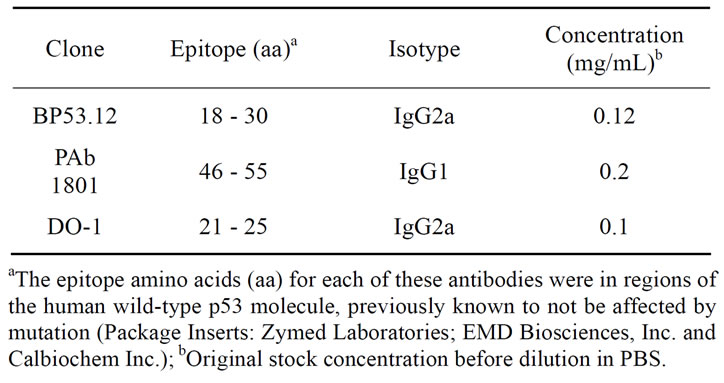
Table 1. p53 antibodies used for IHC and QCM comparisons.
 (a)
(a)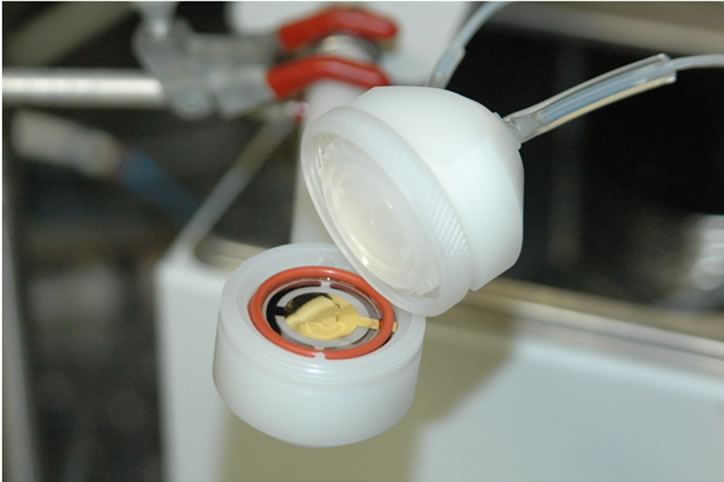 (b)
(b)
Figure 1. The quartz crystal microbalance (QCM) system. (a) Diagram of the system showing the controller box, the crystal housing, the temperature controlled water bath and the syringe pump and valve switching assembly; (b) Enlarged image of the flow cell with the gold-plated quartz crystal.
oscillator resonant frequency (F) and series resistance (R) were recorded during the injection cycles with 10 s integration.
2.4. Quartz Crystal Microbalance: Protocol
The flow-through cell was flushed with PBS until stable frequency and resistance readings were achieved. Following temperature equilibration in a flowing buffer solution, the 10 μg/mL p53 protein solution in PBS was injected into the cell while changes in resonant frequency (ΔF) and series resistance (ΔR) relative to their initial values in the buffer were measured. Typically, frequency and resistance reached their plateaus in about 30 min to 40 min after which buffer was pumped through the cell for about 1 h to remove the weakly adsorbed protein from the crystal surface. Next, the covalently surface-attached p53 was allowed to bind the primary antibody by flowing 10 μg/mL anti-p53 antibody solution through the cell, followed by a PBS buffer flush. After reaching a frequency plateau, the secondary antibody was then flowed through the cell, followed by an additional PBS buffer wash. The complete sequence of p53 protein and primary and secondary antibody additions and PBS washes was repeated several times to obtain mean and standard deviation values of resonant frequency and series resistance.
3. RESULTS
3.1. Characterization of p53-p53 Antibody Interaction Using the Quartz Crystal Microbalance System
Our primary objective in this study was to measure the surface concentrations of the attached p53 and corresponding antibodies, used in our IHC device for quantification, by monitoring the resonant frequency shift of the quartz crystal resulting from the added surface mass. This provided a physical view of the binding reactions that occur in this multi-step assay system which could be used for their quantification. In addition, we have also monitored the crystal series resonance resistance that is indicative of the adsorbed film viscoelastic properties [7].
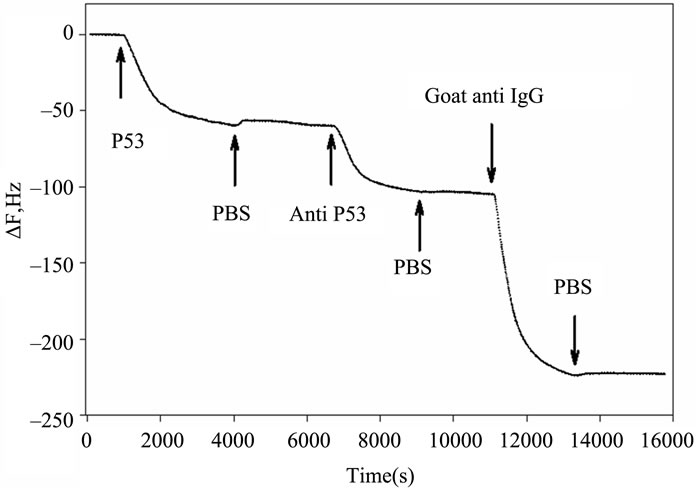
Figures 2(a) and (b) summarize the time course of the frequency and resistance parameters observed during the adsorption of the p53 protein, the mouse primary anti p53 and the goat secondary anti IgG antibodies, as they are used in our development of an IHC device for quantification [6]. All the proteins cause an initial rapid decrease in the crystal resonant frequency and a rise in series resistance. Subsequently, a slower frequency decrease is accompanied by a drop in series resistance that eventually leads to system saturation.
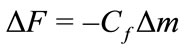
Saturation values, after the PBS wash, were used to estimate the protein surface concentration using Sauerbrey’s Equation:
 (1)
(1)
where ΔF is the observed change in frequency in Hz, corrected by the addition of ΔFvisc, a correction term due to
 (a)
(a)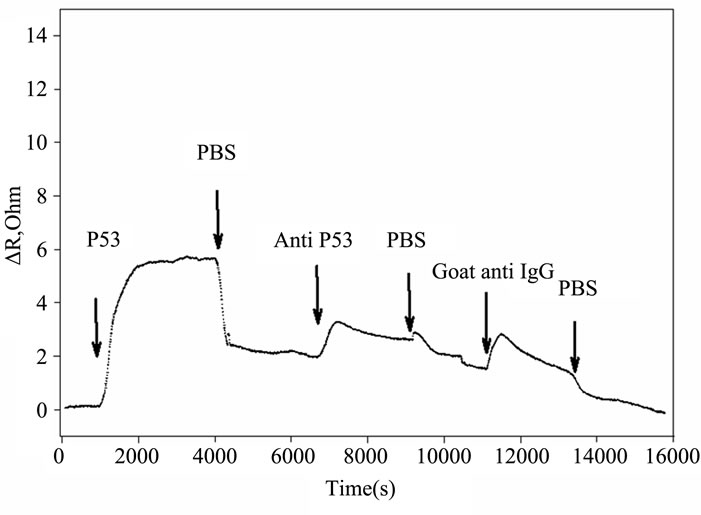 (b)
(b)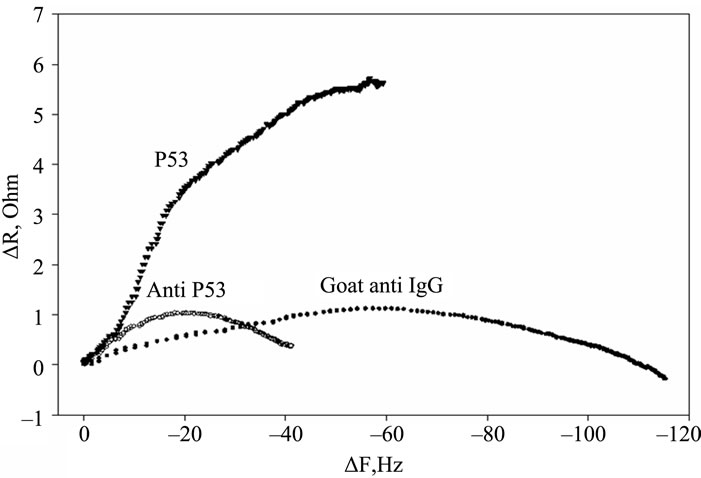 (c)
(c)
Figure 2. Timecourse of protein-induced changes in quartz crystal frequency and resistance. (a) Complete timecourse of frequency changes that occur with the introduction (shown by arrows) of the p53 protein, followed a PBS buffer wash, then followed by primary mouse anti-p53 Ab, followed by another PBS buffer wash and finally followed by a fluorescent labeled secondary goat anti-mouse IgG Ab and PBS buffer wash; (b) Timecourse of changes in quartz crystal series resistance; (c) Comparison of the series resistance and frequency ratio produced by the p53, primary and secondary antibody binding. ΔR/ΔF values are directly compared for the p53 protein, the BP53.12 primary and the secondary antibodies.
change in the adsorbed protein film viscoelasticity (see Discussion). Cf is the sensitivity factor for the crystal (56.6 Hz/μg–1 cm2 for a 5 mHz AT-cut quartz crystal at room temperature) and Δm is the change in mass per unit area in μg/cm2 [8]. This estimate assumed a coverage by spherical molecules and subtracting 30% from the total signal due to protein-bound water [9].
Coverage values for the mouse BP53.12 primary and the goat secondary antibodies resulting from the saturation frequency changes are given in Table 2. Table 2 shows the normalized mass change that occurs using the BP53.12 anti-p53 primary Ab for each of the bound proteins (p53, anti-p53 primary Ab, anti-IgG secondary Ab), calculated from the measured change in resonant frequency of the quartz crystal. It also shows the number of moles bound, based on the relative molecular mass of each protein. The antibody binding stoichiometries are also given in Table 2 (ratio of primary antibody to p53 protein and the ratio of secondary antibody to primary antibody.
Coverage values obtained for three anti-p53 antibody types are compared in Table 3. Table 3 shows the number of moles bound for each of the primary and secondary antibodies. Based on these values the ratios of the primary antibody to p53 protein and the secondary antibody to primary antibody were calculated, also shown in Table 3.
4. DISCUSSION AND CONCLUSIONS
In a previous report, we described a measurement device that could be used for quality control to assess the reproducibility and accuracy of IHC measurements [6]. The device consists of p53 protein, immobilized on a glass slide. In this previous study we assessed the use of this method in the IHC analysis of p53, for which many commercial antibodies are available. In these previous measurements, the reactivity of the immobilized p53 was tested spectroscopically using commercially available IHC antibodies and probes, commonly used for microscope imaging. We concluded that this method would allow users in various research and diagnostic labs to compare results using a device that is known to contain a specified amount of the correct target antigen, p53. However, further analysis was required to establish accurate surface protein concentrations and reproducibility. To this end, we have utilized in the current study a quartz crystal microbalance system to determine the surface concentration of p53 and to assess the antibody binding activity.
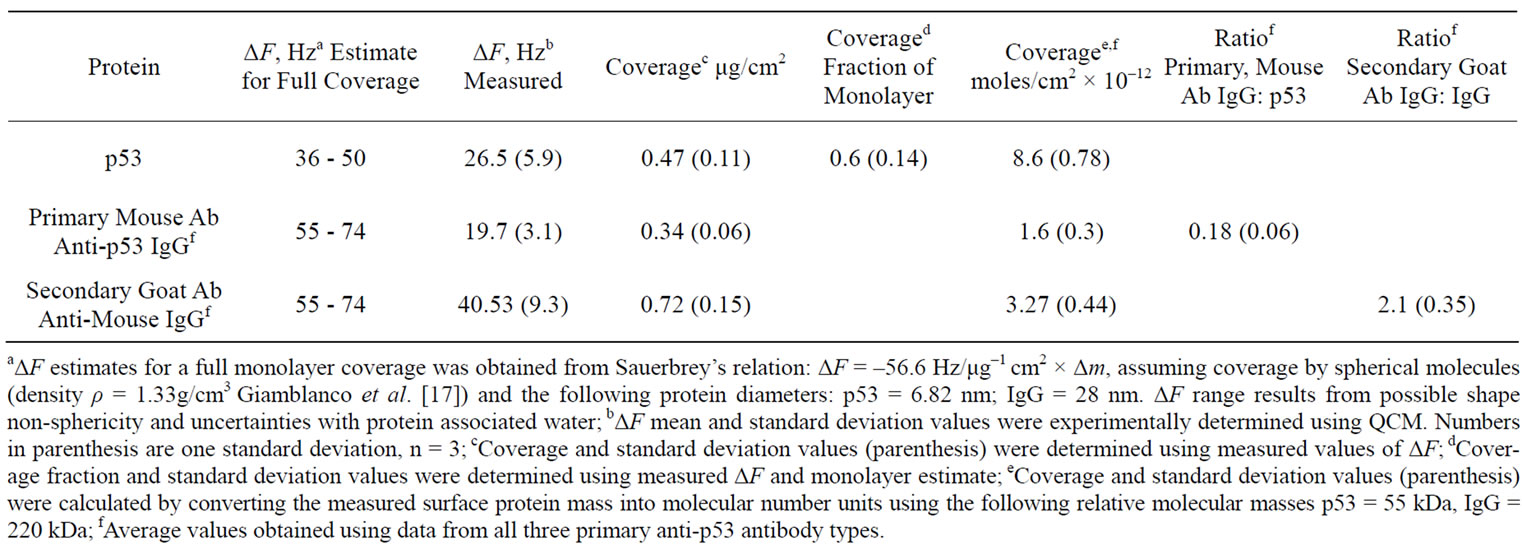
Table 2. Resonant frequency change (ΔF) and protein coverage calculated from ΔF saturation values.
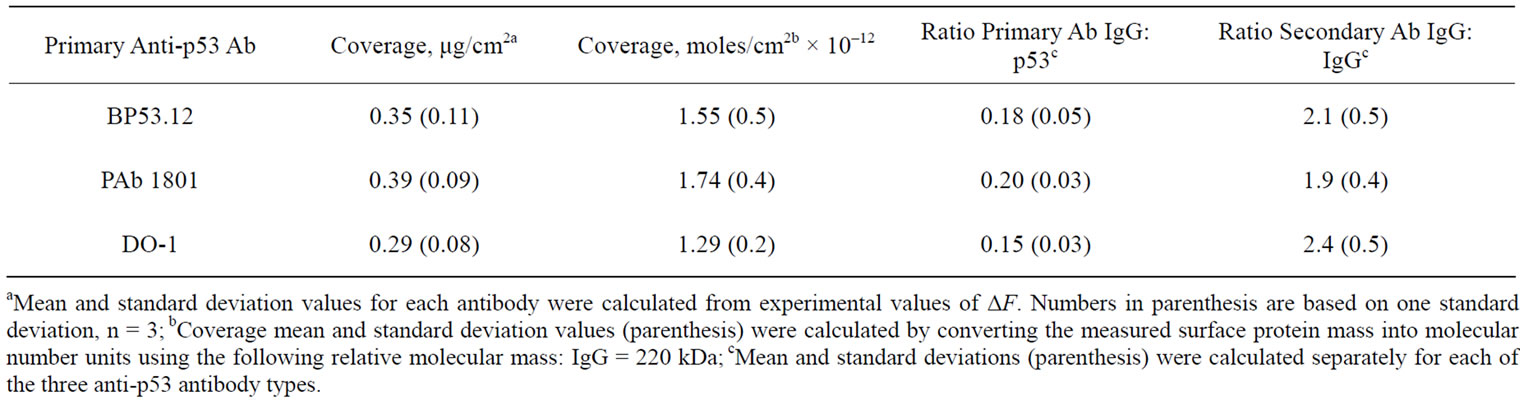
Table 3. Coverage and relative protein concentrations of the anti-p53 antibodies.
The quartz crystal microbalance has been shown previously to provide important gravimetric data required to evaluate protein surface concentrations and to evaluate antibody sensitivity and specificity [10]. The method can also yield information on the adsorbed film viscoelastic properties due to vibrational losses within protein film caused by the shear motion of the quartz crystal surface [9]. Limits of Sauerbrey’s equation applicability to the protein films were investigated in the early study by Hook et al. [9]. It was concluded that linear relation between the QCM resonant frequency drop and added crystal mass holds for viscoelastic films when their thickness is significantly less than the extinction depth (≈250 nm) of the shear wave excited by the QCM crystal [9]. Later studies, where the adsorbed protein mass was calculated from several independent measurements [7, 11-13] determined that Sauerbrey’s equation is a good approximation when changes in dissipation values are low, less than 10–6/5 Hz of ΔF [14]. In our experiments the dissipation losses ΔD were monitored by measuring the QCM series resistance R (1 Ohm in R equals to 10–6 shift in ΔD, [9]). Given that we recorded values smaller than 5.4 Ohms (see Figure 2(b)), and the highest observed ΔD/ΔF did not exceed 10–6/10 Hz, application of Sauerbrey’s relation is justified to estimate the adsorbed protein mass. Nevertheless, we adjusted our ΔF saturation values due to small changes in dissipation as suggested by Shen et al. [15]. It should be noted that each of our measurements of ΔF is taken after a thorough wash of the bound protein with buffer, where ΔR is minimized (see Figure 2(b)). Here, the corrected ΔF is estimated from:
 (2)
(2)
where ΔFobs is the experimentally observed QCM resonant frequency change saturation value, ΔFvisc is the correction term due to change in the adsorbed protein film viscoelasticity. The magnitude of ΔFvisc was estimated from resonant frequency and series resistance (ΔR) measurements in glycerol/water solutions with varying viscosity from:
 (3)
(3)
where K = 1.88 Hz·Ohm–1 is an instrument specific constant.
Furthermore, the R change during the protein adsorption can provide additional insight into the film structure evolution. The ΔR vs ΔF (Figure 2(c)) reflects the evolution of the protein film mechanical properties during different adsorption stages. A higher ΔR/ΔF slope indicates larger added dissipation per added unit mass, in other words, a softer protein film [9]. All investigated proteins initially have shown positive ΔR vs ΔF slopes (Figure 2(c)) that gradually transitioned into lower (p53) or negative (anti p53 and goat anti IgG) slopes approximately halfway in the adsorption process. Such behavior is consistent with a two-phase absorption when film is becoming more rigid with increased coverage. The first absorption phase coincides with the initial rapid F drops, following protein injection (Figure 2(a)), while subsequent slow equilibration is responsible for the second phase. Curiously, the steepest slopes were recorded for p53 adsorption, followed by the anti-p53 IgG and goat anti-IgG (Figure 2(b)). Several models were considered to explain DR/DF ratio variation during protein adsorption and include protein conformational transition after adsorption [16,17], changes in the protein film hydration [9] and protein intermolecular interactions [18]. Our data is consistent with protein reorientation and conformational changes due to formation of the amide (p53) and antibody antigen bonds. According to this model, increase in antibody protein coverage may lead to molecular cross linking which would result in surface film stiffening as indicated by R decreases (Figure 2(c)). Moreover, the ratio of anti-p53 IgG/p53 protein in the film (median value for the three antibody types = 0.18, see also Tables 2 and 3) suggests that one antibody molecule could be attached to several surface p53 proteins effectively cross linking them [19]. Hook et al. [7] have shown earlier that protein film cross linking leads to a more rigid and compact film as reflected by lower values in the energy dissipation parameter D. On the other hand, the lower ratio of p53 antibody binding may also be due to steric hindrance of the exposed p53 protein epitopes. Denaturation of the p53 protein may also contribute to this.
Figure 3 is a diagram of the successive layers of p53 protein, primary anti-p53 antibody and labeled secondary anti-IgG antibody that we have characterized on our
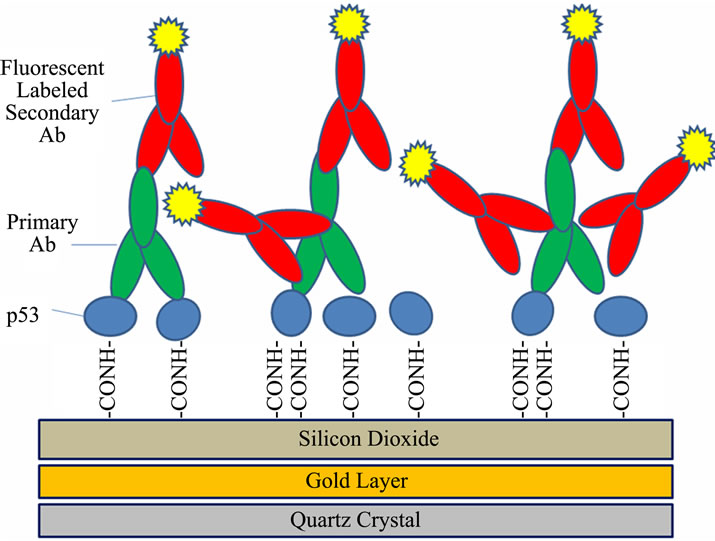
Figure 3. Diagram of the successive layers of p53 protein, primary anti-p53 antibody and labeled secondary anti-IgG antibody. The quartz crystal, the gold, and the silicon dioxide layers are shown below the immobilized proteins (see Materials and methods).
QCM system. It includes the gold, the silane, and glutaraldehyde crosslinking layers used to immobilize these proteins. The diagram illustrates some of the major sources of variability that are found in such multi-step antibody systems used in IHC. A major source of variability can be found in the conformation changes that can occur in the target antigen (p53) as a result of environmental effects of various tissue treatment protocols for paraffin removal, rehydration, antigen retrieval, etc. Another source of variability can come about from the various primary and secondary antibodies used to detect the antigen. These of course can be designed to target different regions of the antigen which may be exposed to differing degrees depending on the tissue treatment protocols. In addition, the antibodies may be mono or polyclonal. The diagram illustrates how the polyclonal secondary antibody may bind to many different regions of the primary antibody and with a higher stoichiometry (IgG:IgG) than observed with the monoclonal primary antibodies (mean value = 2.1, see also Tables 2 and 3). Lastly, the particular label that is used on the secondary antibody is subject to changes in emission quantum yield, depending on environmental conditions.
As a preliminary characterization of the three anti-p53 antibodies that we have selected in our study, we have shown by IHC and flow cytometry that these antibodies will bind to p53 in cultured HT1080 cells (Supplementary data, Figures S1 and S2). In addition, we have shown using IHC and by Western Blot that the extent of this antibody binding is significantly reduced when the cells are treated with cycloheximide that is known to arrest the production of p53 (Supplementary data, Figures S3 and S4). To use any of these antibodies in development of a device for the quantification of IHC would require a complete characterization of their binding activity and stoichiometry. A device for quantification of IHC would also require a uniform layer of well-characterized target antigen of which the concentration has been accurately determined. To address this problem we have used a QCM system to provide a quantification of the target p53 antigen and subsequent antibody binding reactions that previously we could only roughly estimate by direct optical absorption and subject to assumptions in the characteristics of the protein surface layers. We have shown that this method will yield relative p53 antibody binding activities that are consistent with qualitative methods using flow cytometry and IHC (Supplementary data). For example, the primary antibody #2 (PAb 1801) shows a higher relative fluorescent intensity by flow cytometry (Supplementary data, Figure S2(b)), which is in agreement with the higher relative primary Ab IgG:p53 binding ratio shown in Table 3.
A tissue sample undergoing IHC analysis would remain susceptible to uncertainties in the conformation and accessability of the target antigen, as described above. However, a device for quantifying IHC would provide a calibration, depending on the labeled secondary antibody, that is defined by the coverage concentration and stoichiometry, as measured by the QCM system. Despite the variabilities of a multi-step antibody system, as described above, we have shown that the QCM can provide a useful estimate of the activity and stoichiometry of a specific antigen-antibody system that will be required for quantifying IHC measurements. In addition to IHC, the methods we have developed in the current study might also be used to compare the purity and activity of antibody systems used in other molecular diagnostic assays, such as immunocytochemical analysis and the detection of biomarker proteins in blood and urine [20,21].
5. DISCLAIMER
Certain commercial equipment, instruments and materials are identified in order to specify experimental procedure which does not imply recommendation or endorsement by NIST.
REFERENCES
- Jakupciak, J.P., Gallant, N.D., Smith, A.H., Becker, M.L., Tona, A. and Atha, D.H. (2009) Improved methods and standards for telomerase detection. Biotechnic & Histochemistry, 84, 1-12. doi:10.1080/10520290903039060
- Reipa, V., Purdum, G. and Choi, J. (2010) Measurement of nanoparticle concentration using quartz crystal microgravimetry. The Journal of Physical Chemistry B, 114, 16112-16117. doi:10.1021/jp103861m
- Marx, K.A. (2003) Quartz crystal microbalance: A useful tool for studying thin polymer films and complex biomolecular systems at the solution-surface interface. Biomacromolecules, 4, 1099-1120. doi:10.1021/bm020116j
- Liu, Y.-C., Wang, C.-M. and Hsiung, K.-P. (2001) Comparison of different protein immobilization methods on quartz crystal microbalance surface in flow injection immunoassay. Analytical Biochemistry, 299, 130-135. Udoi:10.1006/abio.2001.5409
- Marques, J.T., Rebouillat, D., Ramana, C.V., Murakani, J., Hill, J.E. and Gudkov, A. (2005) Down-regulation of p53 by double-stranded RNA modulates the antiviral response. Journal of Virology, 79, 11105-11114. doi:10.1128/JVI.79.17.11114.2005
- Atha, D.H., Manne, U., Grizzle, W.E., Wagner, P.D., Srivastava, S. and Reipa, V. (2010) Standards for immunohistochemical imaging: A protein reference device for biomarker quantitation. Journal of Histochemistry & Cytochemistry, 58, 1005-1014. doi:10.1369/jhc.2010.956342
- Hook, F., Kasemo, B., Nylander, T., Fant, C., Sott, K. and Elwing, H. (2001) Variations in coupled water, viscoelastic properties, and film thickness of a Mefp-1 protein film during adsorption and cross-linking: A quartz crystal microbalance with dissipation monitoring, ellipsometry, and surface plasmon resonance study. Analytical Chemistry, 73, 5796-5804. doi:10.1021/ac0106501
- Sauerbrey, G. (1959) Verwendung von schwing quarzen zur wagung dunner schichten und zur mikrowagung. Zeitschrift für Physik a Hadrons and Nuclei, 155, 206- 222. doi:10.1007/BF01337937
- Hook, F., Rodahl, M., Brzezinski, P. and Kasemo, B. (1998) Energy dissipation kinetics for protein and antibody-antigen adsorption under shear oscillation on a quartz crystal microbalance. Langmuir, 14, 729-734. doi:10.1021/la970815u
- Hengerer, A., Kosslinger, C., Decker, J., Hauck, S., Queitsch, I. and Wolf, H. (1999) Determination of phage antibody affinities to antigen by a microbalance sensor system. BioTechniques, 26, 956-964.
- Hovgaard, M.B., Dong, M., Otzen, D.E. and Besenbacher, F. (2007) Quartz crystal microbalance studies of multilayer glucagon fibrillation at the solid-liquid interface. Biophysical Journal, 93, 2162-2169. doi:10.1529/biophysj.107.109686
- Feldoto, Z., Lundin, M., Braesch-Andersen, S. and Blomberg, E. (2011) Adsorption of IgG on/in a PAH/PSS multilayer film: Layer structure and cell response. Journal of Colloid and Interface Science, 354, 31-37. doi:10.1016/j.jcis.2010.10.006
- Hook, F., Voros, J., Rodahl, M., Kurrat, R., Boni, P. and Ramsden, J.J. (2002) A comparative study of protein adsorption on titanium oxide surfaces using in sity ellipsometry, optical waveguide lightmode spectroscopy, and quartz crystal microbalance/dissipation. Colloids and Surfaces B: Biointerfaces, 24, 155-170. doi:10.1016/S097-7765(01)00236-3
- Brewer, S.H., Glomm, R., Johnson, M.C., Knag, M.K. and Franzen, S. (2005) Probing BSA binding to citrate-coated gold nanoparticles and surfaces. Langmuir, 21, 9303-9307. doi:10.1021/la50588t
- Shen, D., Huang, M., Chow, L.M. and Yang, M. (2001) Kinetic profile of the adsorption and conformational change of lysozyme on self-assembled monolayers as revealed by quartz crystal resonator. Sensors and Actuators, B77, 664-670.
- Yang, M., Chung, F.L. and Thompson, M. (1993) Acoustic network analysis as a novel technique for studying protein adsorption and denaturation at surfaces. Analytical Chemistry, 65, 3713-3716. doi:10.21/ac00072a027
- Giamblanco, N., Yaseen, M., Zhavnerko, G., Lu, J.R. and Marletta, G. (2011) Fibronectin conformation switch induced by coadsorption with human serum albumin. Langmuir, 27, 312-319. doi:10.1021/la104127q
- Richart, L., Variola, F., Rosei, F., Wuest, J.D. and Nanci, A. (2010) Adsorption of proteins on nanoporous Ti surfaces. Surface Science, 604, 1445-1451. doi:10.1016/jsusc.2010.05.007
- Hammersam, A.G., Foss, M., Chevallier, J. and Besenbacher, F. (2005) Adsorption of fibrinogen on tantalum oxide, titanium oxide and gold studied by the QCM-D technique. Colloids and Surfaces B: Biointerfaces, 43, 208-215. doi:10.1016/j.colsurfb.2005.04.007
- Yao, C., Zhu, T., Qi, Y., Zhao, Y., Xia, H. and Fu, W. (2010) Development of a quartz crystal microbalance biosensor with aptamers as bio-recognition element. Sensors, 10, 5859-5871. doi:10.3390/s100605859
- Tagaya, M., Ikoma, T., Takemura, T., Hanagata, N., Okuda, M., Yoshioka, T. and Tanaka, J. (2011) Detection of interfacial phenomena with osteoblast-like cell adhesion on a hydroxyapatite and oxidized polystyrene by the quartz crystal microbalance with dissipation. Langmuir, 27, 7635-7644. doi:10.1021/1a200008z
Supplementary Data
1. MATERIALS AND METHODS
1.1. Cell Culture
Stock cultures of HT1080 human fibrosarcoma cells (ATCC, Manassas, VA, USA) were grown at 37˚C, 5% CO2 (v/v, volume fraction) and 95% relative humidity in minimal essential medium (Gibco, Carlsbad, CA), 10% (v/v) fetal bovine serum, FBS (Gibco), 1% (v/v), penicillin-streptomycin (100 units/mL, and 100 μg/mL). Cells for imaging were grown on fibronectin coated slides (1 h @ room temp 25 mg/mL fibronectin in Dulbecco’s phosphate buffered saline, PBS (Gibco) to approximately 4000 cells/cm2. Cells treated with cycloheximide (CHI) were treated for 2 h at 30 μg/mL. Cells were fixed in cold formaldehyde (4% v/v in PBS) for 5 min, extracted with 0.2% (v/v) Triton X-100 in ice-cold stabilizing buffer for 5 min to permeabilize the cell membrane, and blocked in 5% (v/v) FBS for 1 h.
1.2. Microscopy
Fixed cells were incubated with mouse monoclonal antibodies described in Table 1 (clones: BP53.12, Zymed Inc., PAb 1801 and DO-1, EMD Biosciences, Inc.) diluted 1:50 (v/v) in PBS, 1% bovine serum albumin (BSA); after rinsing, followed by a 30 min incubation with biotin conjugated rabbit anti-mouse secondary antibody, 15 min incubation with streptavidin conjugated horse radish peroxidase (HRP), followed by a 10 min incubation with diamino benzamidine (DAB) and hydrogen peroxide (Ventana, Inc. i-view reagents). Images were taken using an Olympus BH2-RFCA microscope and Photometrix Quantix camera and a Zeiss Axiovert S100 microscope and Sony DSC-S75 camera.
1.3. Flow Cytometry
Cells were harvested by trypsinization, centrifuged at 200 xg for 5 min and permealized and fixed in 4 mL of cold formaldehyde (4% v/v in PBS) for 30 min. After fixing, the cells were centrifuged at 200 xg for 10 min and re-suspended in 0.2% Triton X-100 in ice-cold PBS. The fixed cells were blocked in 3% BSA, 5% goat serum in PBS for 1 h. For staining, the cells were incubated 1 h with mouse monoclonal antibodies against p53 diluted 1:100 (v/v) in 3% BSA in PBS, followed by 1 h incubation with AlexaFluor-488 labeled secondary antibody, (Molecular Probes) diluted 1:200 (v/v) in 3% BSA in PBS containing 5% goat serum. The cells were centrifuged, re-suspended in cold PBS and analyzed with a Coulter Epics XL flow cytometer (Beckman Coulter, Fullerton, CA), equipped with a 15 mW output laser tuned to 488 nm. The fluorescence was collected after a 525/40 nm band pass filter. Samples were gated on forward scatter vs side scatter to exclude debris and clumps and to select cell populations of interest; 10,000 events were collected for each sample.
2. RESULTS
2.1. Comparison of Three Monoclonal Primary Antibodies by Microscopy and Flow Cytometry
In Figure S1 is shown color images of HT1080 cells comparing three monoclonal primary p53 antibodies (Table 1) used in the chromagenic DAB staining procedure. The images are compared to the control obtained in the absence of primary antibody. All three antibodies produced enhanced (reddish) staining of the nuclei when compared to the control. This indicated that all three of our monoclonal antibodies were active when tested using IHC of cultured cells.
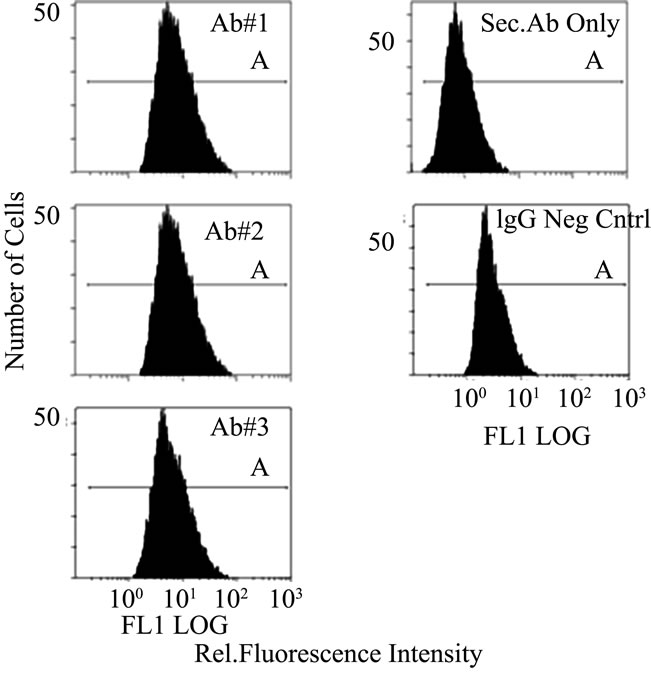
In Figure S2(a) the three monoclonal antibodies are compared by flow cytometry using a fluorescent labeled secondary antibody. As shown by the comparison of mean intensities in Figure S2(b), the three antibodies all show enhanced staining when compared to the control using IgG. Using only the secondary antibody produced an even lower degree of staining. This result again showed that our monoclonal antibodies were active against a population of cultured cells.
2.2. Microscopy of HT1080 Cells— Comparison of Three Monoclonal Primary Antibodies in the Presence and Absence of Cycloheximide
In Figure S3 is shown monochrome images of HT1080 cells comparing three monoclonal primary p53 antibodies used in the chromagenic DAB staining procedure. The images are compared to the control obtained in the absence of primary antibody. All three antibodies were similar in their enhanced staining of the nuclei when compared to the control. Next is shown corresponding monochrome images of HT1080 cells cultured for 2 h in the presence of CHI. Previous studies haveshown that cycloheximide can be used to suppress protein expression in cultured HT1080 cells, with essentially complete reduction of p53 in 2 h [5]. All three antibodies were similar in their enhanced staining of the nuclei when compared to the control, but had a higher than expected staining after treatment with CHI. This indicated that the three monoclonal antibodies all exhibited specific activity against expressed proteins such as p53 but with significant non-specific staining to structural/ host proteins which are not reduced by CHI.
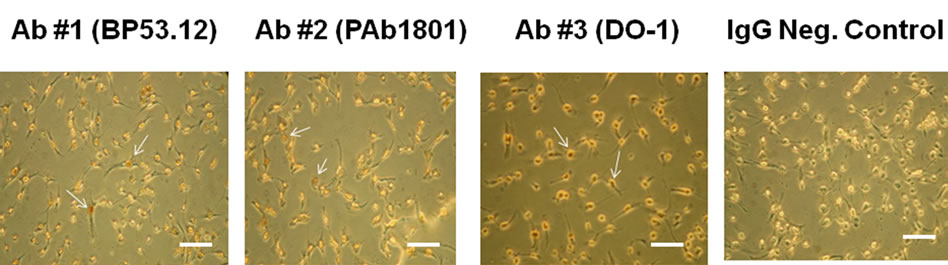
Figure S1. IHC microscopy of cultured HT1080 cells: Effect of using different primary (anti-p53) antibodies (BP53.12, PAb 1801, DO-1) and comparison to the IgG negative control. The arrows indicate examples of the reddish DAB nuclear staining that is absent in the control. Bar = 50 μm.
 (a)
(a) 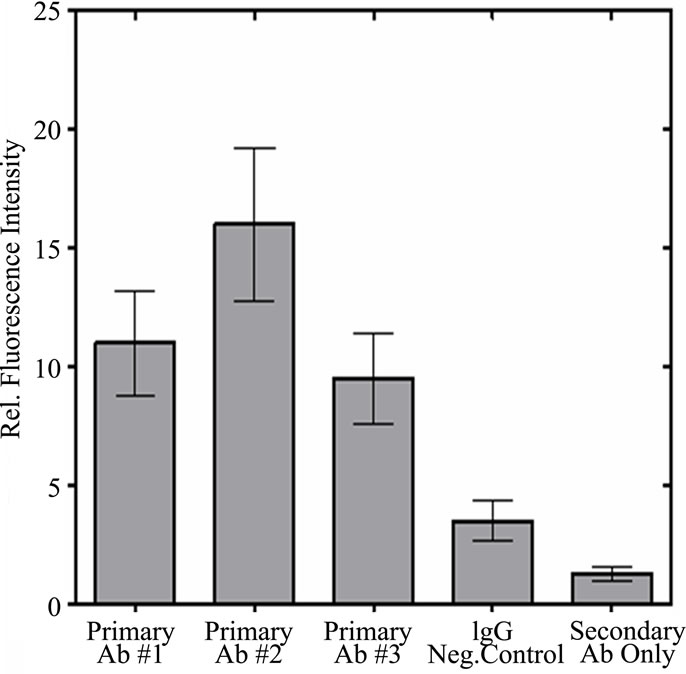 (b)
(b)
Figure S2. Flow Cytometry of HT1080 Cells: Comparison of p53 antibody binding (BP53.12, PAb 1801, and DO-1) to controls (IgG negative control and secondary antibody only) (a) Fluorescence intensity distribution of fluorescent antibody stained HT1080 cell suspensions. Fluorescence emission at 525 nm, proportional to fluorescently labeled secondary antibody (AlexaFluor 488) was collected for 10,000 cells per sample; (b) Comparison of mean fluorescent intensities obtained from flow cytometry. The error bars represent the 20% coefficient of variation (CV) observed in these measurements.
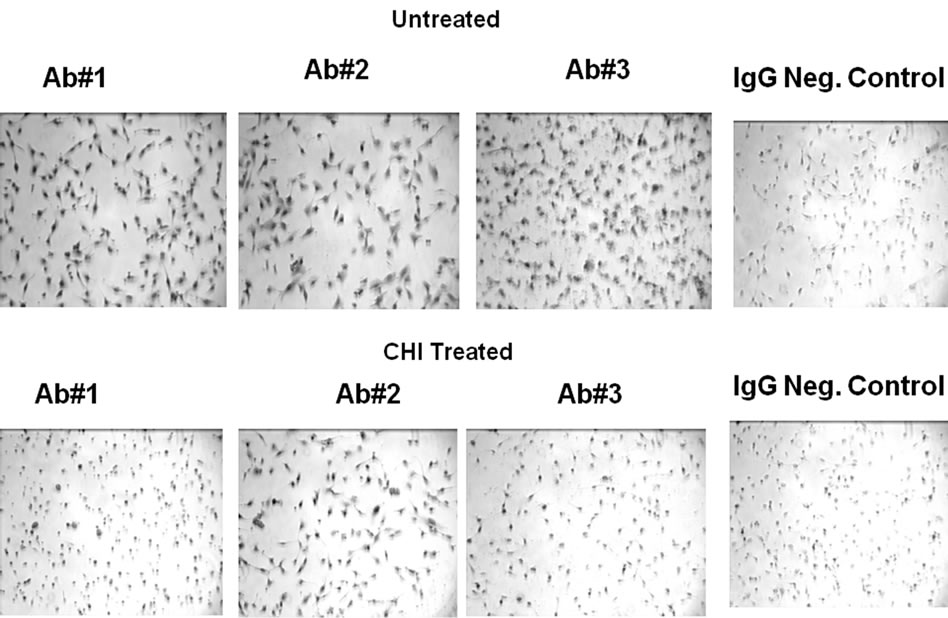
Figure S3. Microscopy of Cultured HT1080 cells: Effect of CHI treatment using different primary (anti-p53) antibodies (BP53.12, PAb 1801, DO-1) and comparison to the IgG negative control.
 (a)
(a) 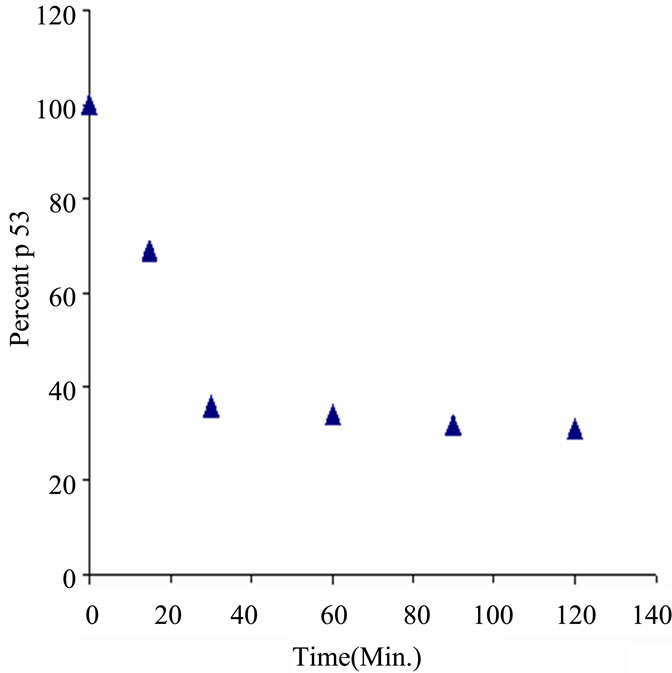 (b)
(b)
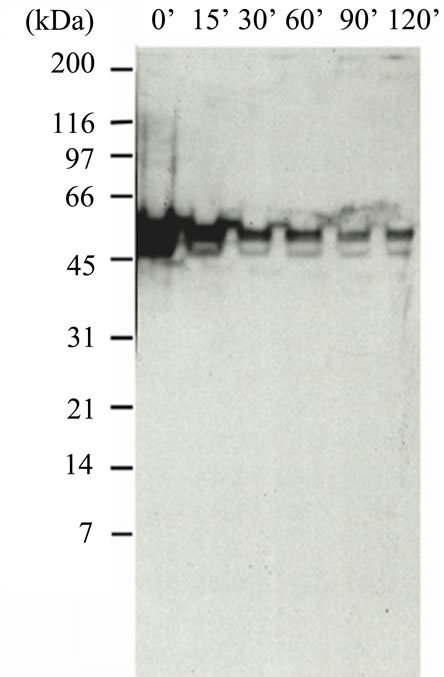
Figure S4. Western Blot of HT1080 cell extracts using BP53.12 anti-p53 antibody. Cells were treated 0 min to 120 min with 30 μg/mL CHI. (a) Gel showing reduction of expressed p53 during timed treatment; (b) Timecourse plot of loss of p53 staining intensity during CHI treatment.
2.3. Western Blot Analysis of the HT1080 Cells—Effect of Cycloheximide (CHI)
In Figure S4(a) is shown a p53 western blot analysis of lysed cell extracts obtained from HT1080 cells cultured in the absence and presence of CHI tested at time intervals from 0 min to 120 min. The gel indicates the major portion of antibody binding (Ab#1) occurs at a molecular weight consistent with p53. It also indicates a reduction in the amount of expressed protein during treatment with CHI. As shown in the integrated intensity plot (Figure S4(b)) the amount of immuno active p53 as reduced during treatment to about 30% of the original. This demonstrated specific activity of the antibody which is consistent with the non-specific staining that was observed by IHC. However, further quantitation of this activity was required using the QCM system, as described in the main portion of the manuscript.
3. ACKNOWLEDGEMENTS
We thank Alex Tona (NIST) for his help with cell culture and flow cytometry, John Elliott (NIST) for his help with microscopy and design of CHI experiments and Julio Cabrera, Protein One, for his help with Western Blots.