Wireless Engineering and Technology
Vol.2 No.3(2011), Article ID:5759,5 pages DOI:10.4236/wet.2011.23017
Measurement of Rain Attenuation in Terahertz Wave Range
![]()
Department of Communications Engineering, National Defense Academy, Yokosuka, Japan.
Email: ishii@nda.ac.jp
Received February 10th, 2011; revised March 31st, 2011; accepted April 11th, 2011.
Keywords: Terahertz Wave, Rain Attenuation, Raindrop-Size Distribution, M-P Distribution, Weibull Distribution, ITU-R
ABSTRACT
Rain attenuation at 355.2 GHz in the terahertz wave range was measured with our new 355.2 GHz measuring system under rainfall intensities up to 25 mm/hr. Rain attenuation coefficients were also calculated using four raindrop-size distributions, e Marshall-Palmer (M-P), Best, Polyakova-Shifrin (P-S) and Weibull distributions, and using a specific rain attenuation model for prediction methods recommended by ITU-R. Measurements of a terahertz wave taken at 355.2 GHz were compared with our calculations. Results showed that the propagation experiment was in very good agreement with a calculation from a specific attenuation model for use in prediction method recommended by ITU-R.
1. Introduction
Recent advances in electronic and electro-optical terahertz devices, and improvements in system technology, have stimulated in imaging and sensing applications in the security and non-destructive testing fields [1].
Rain attenuation is one of the most serious obstacles to overcome for imaging and sensing systems to detect hazardous things using a terahertz waves above 300 GHz because of its masking action. Raindrop-size distributions have been found to play an important role in monitoring rainfall and in predicting rain attenuation. Rain atenuation is particularly severe and greatly dependent on various models of raindrop-size distribution in millimeterand terahertz-wave systems.
2. Measuring Rain Attenuation
2.1. Measuring System
Experimental data were collected at 355.2 GHz by using the terahertz wave propagation measuring system shown in Figure 2. A summary of the system parameters is given in Table 1, and a photograph of the transmitter and detector are shown in Figure 1.
Figure 2 outlines our new system for measuring rain attenuation in terahertz wave range. The system consists of a transmitter, detector, interface, rain-intensity gauge, and ancillary devices such as a thermometer and datalogger/controller. The transmitter and detector use a corrugated conical horn feeding an off-axis elliptical mirror to collimate beams, yielding a directivity of 50 dB. The transmitter has approximately +8 dBm of output power at terahertz wave range, and was pulse modulated at 12 kHz using a transistor-transistor logic (TTL) signal. To cope with the fluctuation in detection sensitivity due to temperature variation, a correction was applied to the detected voltage, based on previous measurements of the detector’s thermal characteristics. The measurement level stability after thermal linear correction was within 0.1 dB.
The terahertz wave transmitter is driven by a phase locked oscillator (PLO), which is oscillated by the dielectric resonant oscillator (DRO) and locked to the 100 MHz of the reference oscillator. The PLO output is then quadrupled and then amplified using a monolithic microwave integrated circuit (MMIC) amplifier to a power level of approximately 1 W. A cascade of three varactor frequency doublers (VFDs) are used to convert the amplifier output to 355.2 GHz. The output power is adjusted to keep the detector in square law using a rubber plate as an attenuator.
The propagated terahertz wave signal is received using a zero-bias Schottky diode detector, and the output voltage is amplified using a low-noise video amplifier followed by a 12-kHz band pass filter (BPF) to reduce the
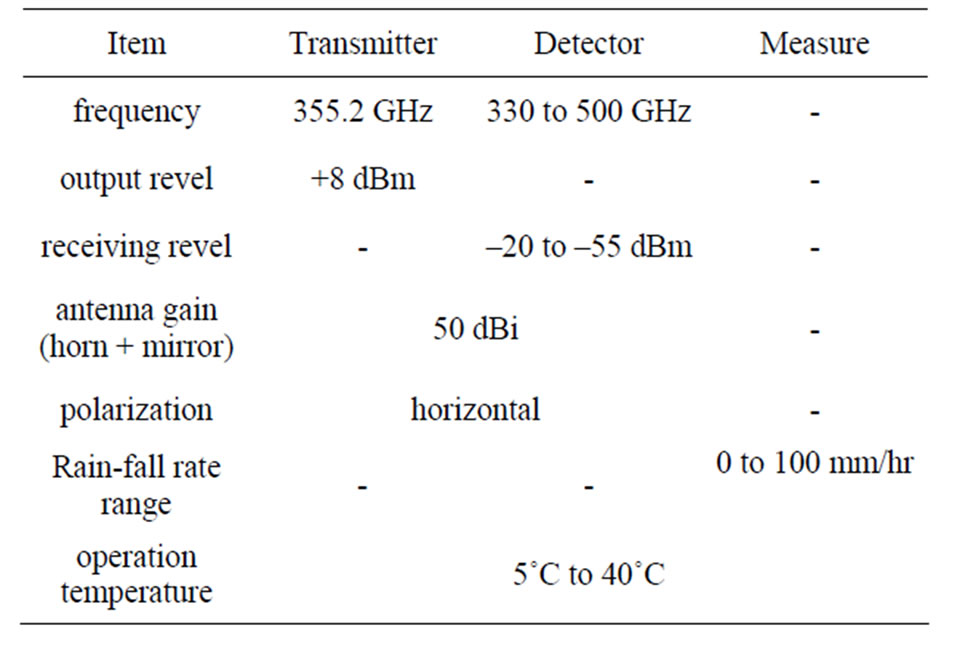
Table 1. Summary of the instrumentation system parameters.
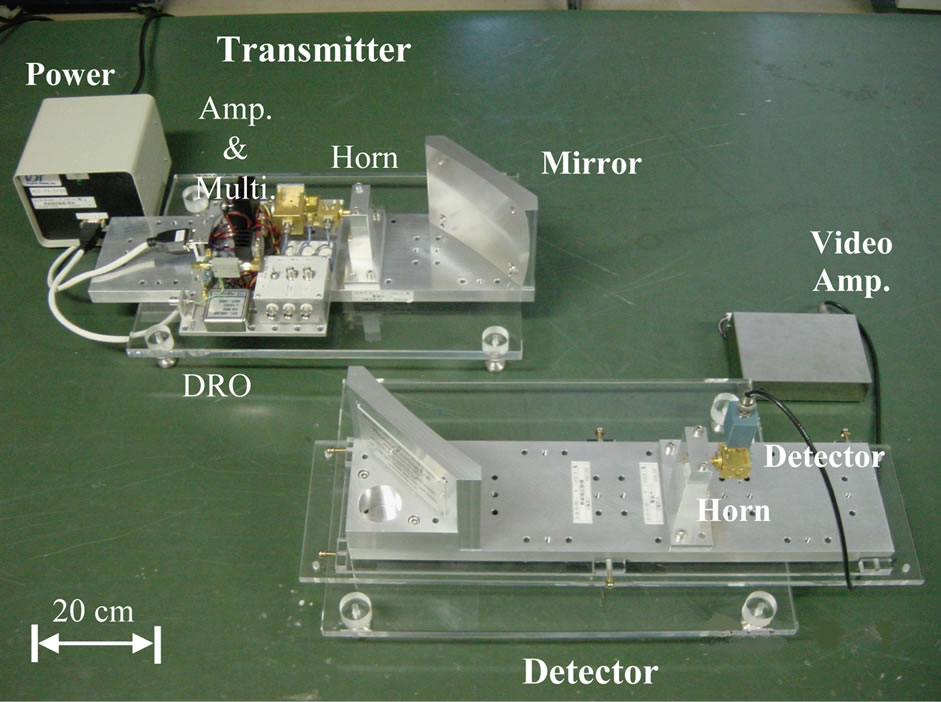
Figure 1. Photograph of transmitter and detector.

Figure 2. Terahertz wave propagation measuring system.
noise bandwidth. The system collects the data on the receiving level, temperature, and rainfall rate, which are then digitized using an analog-to-digital (A/D) converter.
The data logger/controller controls all devices and collects and stores the data, and measuring parameters.
2.2. Measuring System Stability
Prior to the measuring rain attenuation, a system stability check was carried out under the same conditions as those for measurement. Figure 3 shows the received out put level at the video amplifier and corresponding ambient temperature and temperature of the detector plotted as a function of time for a 24-hours period from 19:14 on 24th April to 19:14 on 25th April. The wind speed and direction during the checking period near the measurement area were 2 to 5 m/s and NNE or SSE, and the weather was mostly sunny. The measuring time interval was one minute.
2.3. Measuring Rain Attenuation
Measurement was carried out at the National Defense Academy in Yokosuka City, Japan during March and April 2010. The propagation range was 33 m. Figure 3 shows the change attenuation coefficient at 355.2 GHz and the corresponding rain rate plotted as a function of time for one event, on 28 April, from 10:00 to 16:00, during that period. The wind speed and direction during the measurement period near the measurement area were 6 to 7 m/s and N or NNW. Temperature is shown in Figure 4. The measuring time interval was one minute, depending on the required accumulation time for the rain gauge.
Between 10:00 to 16:00, as shown in Figure 4, the rain could be characterized as widespread. The attenuation for this period corresponds to the rain rates in Figure 4.
3. Calculations
Rain attenuation was calculated by using four types of raindrop-size distributions and a specific attenuation model for use in the prediction method recommended by ITU-R.
3.1. Raindrop-Size Distributions
Marshall and Palmer [2] proposed the following wellknown empirical expression by fitting their data and the Laws and Parsons data. Their data was taken in Ottawa, Canada in 1946 using the filter paper method. The fit of this distribution to the experimental points was not very good for drops less than D = 1 mm.
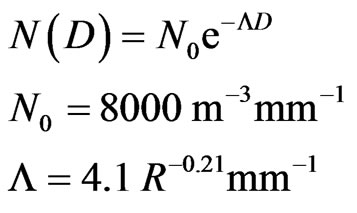 (1)
(1)
where D is the diameter in mm, and R is the precipitation rate in mm/hr.
Best [3] proposed a drop-size distribution model after analyzing a large amount of experimental data in 1950. This is written as:
 (2)
(2)
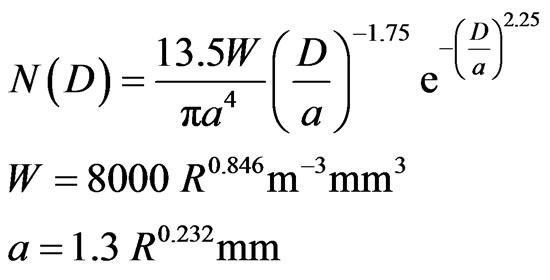
Litovinov proposed a model [4] in 1957 and [5] in 1958 due to Polyakva and Shifrin (P-S) using the Russian data for all three types of rain. This model was also described by Krasyuk, Rozenberg and Chistyakov [6] in 1968 and by University of Tennessee [7] in 1975. It was one case of Gamma distribution proposed by Atlas and Ulbrich [8] in 1984:
 (3)
(3)
 and
and  vary based on the rain types of thawing are shown in Table 2.
Sekine and Lind [9] proposed a Weibull distribution in 1982 by using the FOA data (from the National Defence Research Institute) in Sweden:
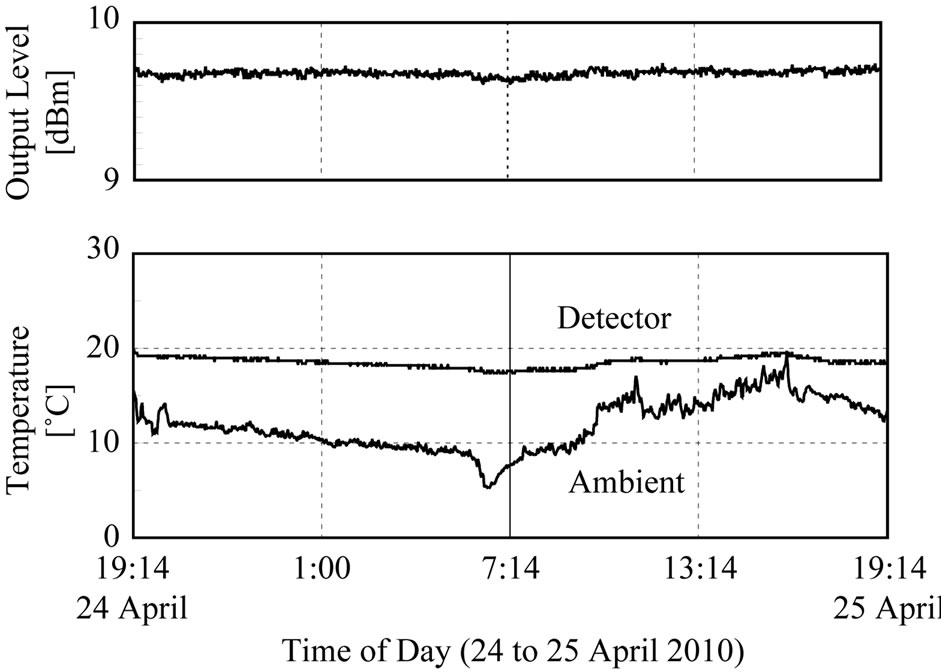
Figure 3. Received output level of video amp. and ambient temperature.
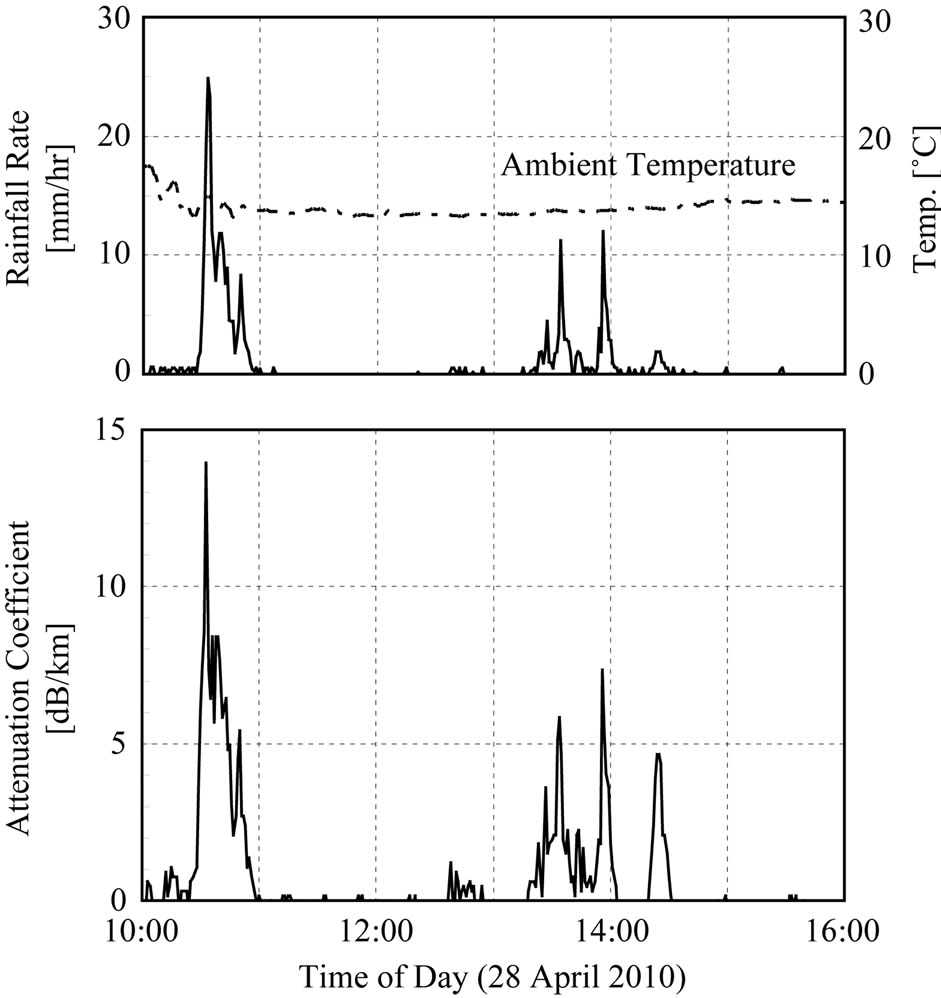
Figure 4. Attenuation coefficient at 355.2 GHz and corresponding rainfall rate.
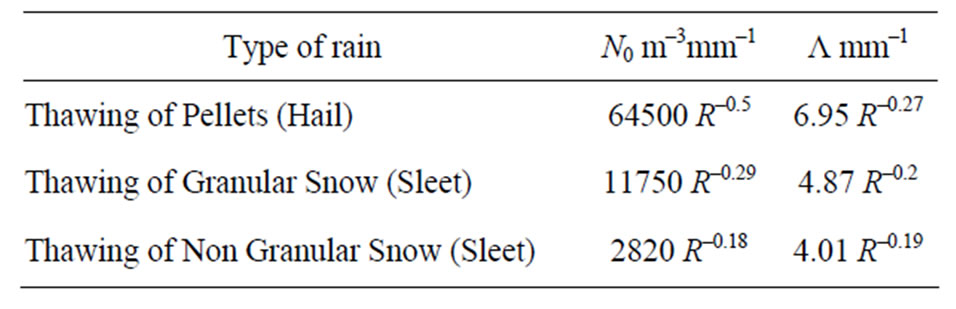
Table 2. Values for N0 and Λ.
 (4)
(4)
This distribution is retained for microwave and terahertz applications [10-23].
3.2. Calculations of Rain Attenuation
For calculations using by raindrop-size distributions, rain specific attenuation A in dB/km is calculated by integrating all of the drop sizes as
 (5)
(5)
where Q is the attenuation cross section which is a function of the drop diameter D, the wavelength of the radio wave λ, and the complex refractive index of the water drop m, which is a function of the frequency and the temperature, and  is the drop-size distribution.
The attenuation cross section Q is found by applying the classical Mie scattering theory for a plane wave radiation to an absorbing sphere particle. According to Hulst [24], the cross section Q is expanded as
 (6)
(6)
where an and bn are the Mie scattering coefficients, which are complex functions of m, D and λ. The “Mie scattering coefficients” an and bn in Equation (6) represent the contribution to the scattered field from the multi poles induced in a sphere, such as a raindrop. The complex refractive index of liquid water m was taken from Ray’s research [25].
For calculation by using the recommended prediction methods by ITU-R [26], rain specific attenuation  dB/km is obtained from the rain rate R mm/hr using the power-law relationship:
 (7)
(7)
The constant values for the constants for the coefficients k and α are determined as functions of frequency, f GHz, in the range from 1 to 1000 GHz, from the equations which have been developed from curve-fitting to power-law coefficients derived from scattering calculations. This is shown in ITU-R P.838-3 [26]. This calculation was carried out with a flat path elevation angle and the horizontal polarization of radiation because the experiments were conducted in a flat area. Also from our tentative calculation, variation of rain attenuation was less than 0.1 dB/km for each vertical, horizontal, and circular polarization at 355.2 GHz under a rainfall rate of up to 25 mm/hr.
3.3. Experiments and Computations
Figure 5 shows the results of experiments and computations for 355.2 GHz under a rainfall rate of up to 25 mm/hr. For the calculations of rain attenuation, the Marshall and Palmer (M-P), Best, Polyakva and Shifrin (P-S), and Weibull rain drop-size distributions, described in Equations (1)-(4), respectively, were used, and a specific attenuation model recommended by ITU-R was used for ITU-R described in Equation (7).
An experimental fit curve (shown by the broken line), derived using the aid of the least squares method from the raw data (triangles in Figure 5) is described as .
.
The experimental data was compared with the calculations. The deviation of the empirical data and the calculated attenuation coefficients were estimated by calculating the root mean square error (RMSE). The results are shown in Table 3. Results showed that the calculations from Weibull and ITU-R were in good agreement with the experimental data. The best fit was the calculation from ITU-R with the smallest RMSE.
4. Conclusions
Rain attenuation at 355.2 GHz was measured at the National Defense Academy and calculated using four raindrop-size distributions and an ITU-R specific attenuation

Figure 5. Comparison between calculations and measurements at 355.2 GHz.
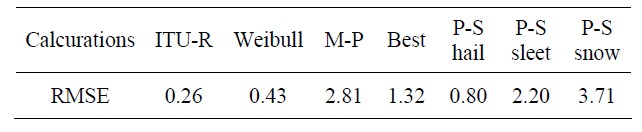
Table 3. RMSE values for attenuation coefficients.
model. The calculated results were compared with propagation experiments under rainfall intensities of up to 25 mm/hr. The propagation experimental results were in very good agreement with of the calculation from the specific attenuation model for use in prediction method recommended by ITU-R provided the best fit for the experimental data. Finally, there is greater interest in the rain attenuation at terahertz wave range. An experiment on rain attenuation above 300 GHz at different rainfall rates with various raindrop-size distributions is needed, especially at a higher rainfall rate that may cause fatally damage terahertz applications.
REFERENCES
- R. M. Langdon, V. Handerek, P. Harrison, H. Eisele, M. Stringer, C. F. Tae and M. H. Dunn, “Military Applications of Terahertz Imaging,” Proceedings of the 1st EMRS DTC Technical, Conference, Edinburgh, 2004. http://www.emrsdtc.com/
- J. S. Marshall and W. M. K. Palmer, “The Distribution of Raindrops with Size,” Journal of Meteorology, Vol. 5, No. 4, 1948, pp.165-166. doi:10.1175/1520-0469(1948)005<0165:TDORWS>2.0.CO;2
- A. C. Best, “The Size Distribution of Raindrops,” Quarterly Journal of the Royal Meteorological Society, Vol. 76, No. 327, 1950, pp. 16-36. doi:10.1002/qj.49707632704
- I. V. Litovinov, “On the Distribution Function of Particles of Rainfall,” Izvestia AN SSSR, Geophysical Series, No. 6, 1957, pp. 838-839.
- I. V. Litovinov, “Size Distribution of Raindrops from Melting Hail,” Izvestia, Geophysical Series, No. 6, 1958, pp. 903-912.
- N. P. Krasyuk, V. I. Rozenberg and D. A. Chistyakov, “Attenuation and Scattering of Radar Signals by Radio with Shifrin and Marshall-Palmer Drop Size Distributions,” Radio Engineering and Electronic Physics, Vol. 13, No. 10, 1968, pp. 1638-1640.
- “Investigation of Radar Rain Clutter Cancellation Using a Polarization Method,” RADC-TR-75-126, Final Technical Report, University of Tennessee, Knoxville, August 1975.
- C. W. Ulbrich and D. Atlas, “Assessment of the Contribution of Differential Polarization to Improve Rainfall Measurements,” Radio Science, Vol. 19, No. 1, 1984, pp. 49-57. doi:10.1029/RS019i001p00049
- M. Sekine and G. Lind, “Rain Attenuation of Centimeter, Millimeter and Submillimeter Radio Waves,” Proceedings of the 12th European Microwave Conference, Helsinki, 13-17 September 1982, pp. 584-589.
- M. Sekine and C. D. Chen, “Rain Attenuation in Terrestrial and Satellite Communications Links,” Proceedings of the 15th European Microwave Conference, Paris, 9-13 September 1985, pp. 985-990. doi:10.1109/EUMA.1985.333606
- C. D. Chen, Y. Okamoto and M. Sekine, “Cancellation of Radar Rain Clutter Using Circular Polarization,” Transactions on IECE of Japan (Section E), Vol. E68, No. 9, 1985, pp. 620-624.
- M. Sekine, “The Relationship between Radar Reflectivity and Rainfall Rate,” Transactions on IECE of Japan (Section E), Vol. E69, No. 5, 1986, pp. 581-582.
- M. Sekine, “Rain Attenuation from Various RaindropSize Distributions,” Transactions on IECE of Japan (Section E), Vol. E69, No. 6, 1986, pp. 711-712.
- M. Sekine, C. D. Chen and T. Musha, “Rain Attenuation from Log-Normal and Weibull Rain-Drop Distributions,” IEEE Transactions on Antennas Propagation, Vol. AP-35, No. 3, 1987, pp. 358-359. doi:10.1109/TAP.1987.1144099
- M. Sekine and C. D. Chen, “Inversion Problem in Rain Attenuation Calculations,” Proceedings of the 1989 URSI International Symposium on Electromagnetic Theory, Stockholm, 1989, pp. 23-25.
- H. Jiang, M. Sano and M. Sekine, “Radar Reflectivity and Rainfall Rate Relation from Weibull Rain Drop-Size Distribution,” IEICE Transactions on Communications, Vol. E79-B, No. 6, 1996, pp. 797-800.
- H. Jiang, M. Sano and M. Sekine, “Weibull RaindropSize Distribution and Its Application to Rain Attenuation,” IEEE Proc-Microwaves Antennas Propagation, Vol. 144, 1997, pp. 197-200. doi:10.1049/ip-map:19971193
- S. Sayama and M. Sekine, ”Influence of Raindrop-Size Distribution on the Differential Reflectivity up to Submillimeter Wavelength of 0.96 mm,” International Journal of Infrared and Millimeter Waves, Vol. 23, No. 5, 2002, pp. 775-784. doi:10.1023/A:1015770705113
- S. Ishii, “Rain Attenuation at Millimeter Wavelength of 1.33 mm,” International Journal of Infrared and Millimeter Waves, Vol. 25, No. 10, 2004, pp. 1495-1501. doi:10.1023/B:IJIM.0000047441.92970.e8
- T. Utsunomiya and M. Sekine, “Rain Attenuation at Millimeter and Submillimeter Wavelength,” International Journal of Infrared and Millimeter Waves, Vol. 26, No. 6, 2005, pp. 905-920. doi:10.1007/s10762-005-5662-5
- T. Utsunomiya and M. Sekine, “Rain Attenuation at 103 GHz in Millimeter Wave Ranges,” International Journal of Infrared and Millimeter Waves, Vol. 26, No. 11, 2005, pp. 1651-1660. doi:10.1007/s10762-005-0038-4
- M. Sekine, S. Ishii, S. Hwang and S. Sayama, “Weibull Raindrops-Size Distribution and Its Application to Rain Attenuation from 30 GHz To 1000 GHz,” International Journal of Infrared and Millimeter Waves, Vol. 28, No. 5, 2007, pp. 383-392. doi:10.1007/s10762-007-9221-0
- S. Ishii, S. Sayama and K. Mizutani, “Rain Attenuation at Terahertz,” Wireless Engineering and Technology, Vol. 1, No. 2, 2010, pp. 92-95. doi:10.4236/wet.2010.12014
- H. C. Hulst, “Light Scattering by Small Particles,” Wiley, New York, 1957.
- P. S. Ray, “Broadband Complex Refractive Indices of Ice and Water,” Applied Optics, Vol. 11, No. 8, 1972, pp. 1836-1844. doi:10.1364/AO.11.001836
- Recommendation, ITU-R, International Telecommunication Union, “Specific Attenuation Model for Rain for Use in Prediction Methods,” 2005, pp. 838-833.