Journal of Environmental Protection
Vol.07 No.10(2016), Article ID:70493,14 pages
10.4236/jep.2016.710110
Variability in the Levels of BTEX at a Pollution Hotspot in New Delhi, India
Manisha Gaur1, Rina Singh2, Anuradha Shukla2
1Academy of Scientific & Innovative Research (AcSIR), Environmental Science Division, CSIR-Central Road Research Institute (CRRI), New Delhi, India
2Environmental Science Division, CSIR-Central Road Research Institute (CRRI), New Delhi, India

Copyright © 2016 by authors and Scientific Research Publishing Inc.
This work is licensed under the Creative Commons Attribution International License (CC BY 4.0).
http://creativecommons.org/licenses/by/4.0/


Received: August 2, 2016; Accepted: September 4, 2016; Published: September 9, 2016
ABSTRACT
It is a matter of concern that despite taking measures to control aromatic content in gasoline in India, the levels of volatile organic compounds are rising again in many of the Indian cities. The transport sector has been one of the major sectors which are responsible for worsening the air quality of Delhi city. While thousands of toxic compounds are emitted from automobiles, industries, gasoline stations as well as service stations, however, volatile organic compounds are important due to their significant contribution to ozone formation, cancer, and non-cancer health risks. In this study, roadside levels of benzene, toluene, ethylbenzene and xylenes (BTEX) were investigated at the one of the major arterial road of Delhi city. Air samples were collected by activated coconut shell charcoal adsorbent tubes. The BTEX concentrations were determined by gas chromatography-flame ionization detector (GC-FID) technique. The mean concentrations of benzene, toluene, ethylbenzene and xylenes were, respectively, 60.22, 162.68, 49.42 and 25.25 μg/m3. The relative concentration distribution pattern and mutual correlation analysis indicated that in BTEX had sources other than vehicle emission at the study site. The samples collected, showed that BTEX had significantly higher concentrations in winter than those in spring and summer.
Keywords:
BTEX, Urban Air Pollution, Vehicle Emissions, Delhi

1. Introduction
Delhi is among the fastest growing economic centers of South Asia and has witnessed a rapid increase in the number of vehicles from 5.1 million in 2007 to 8.2 million in 2014 [1] . Among, motor vehicles in Delhi, two-wheelers (motorcycles and scooters) and four-wheelers (cars and jeeps) accounts for 64% and 31% of the total vehicle fleet while the remaining 5% comprises of public vehicles (auto-rickshaws, taxis, buses and goods vehicles) in Delhi [2] . This rapid growth in the number of vehicles has led to serious environmental and health related problems in the Delhi city. The major pollutants emitted from the transport sector are carbon monoxide (CO), oxides of nitrogen (NOx), volatile organic compounds (VOCs), particulate matter (PM), and black carbon (BC) [3] . In addition, there is a remarkable rise in the levels of secondary air pollutants such as ozone (O3) [4] - [6] .
According to the World Health Organization (WHO), any organic compound will be denoted as volatile organic compound (VOC) if the boiling point falls within the range from 50˚C - 100˚C up to 240˚C - 260˚C [7] - [9] . VOCs significantly affect human health and can cause respiratory diseases, headaches, and eye irritation [4] [9] . Benzene, toluene, ethylbenzene, and meta-, para- and ortho-, xylenes collectively known as BTEX, are a group of aromatic VOCs and constitute up to 60% of non-methane VOCs in an urban area [4] [10] [11] . BTEX acts as an important indicator to assess the degree of exposure of the human body to VOCs [9] . Several researchers have studied BTEX concentrations in ambient air [4] [9] [12] - [17] while others have focused on the adverse health effects [18] - [20] or their role in the tropospheric chemistry [21] - [23] . In India, regulations are made for fuels and vehicle emissions which are based on European standards. New requirements will be introduced first in Delhi, followed by other major cities, following the implementation at national level. A limit of 3% (vol) max has been introduced in the four mega cities w.e.f 1st April 2000. The content of benzene in the gasoline has been further reduced to 1% w.e.f 1st April 2005 in 11 mega-cities states ahead. How- ever, gasoline with 3% benzene content is made available throughout the country from April 01, 2005 [24] .
Key outdoor sources of BTEX include automobile exhaust, fuel evaporative losses, industrial emissions, petroleum refining and storage, surface coatings, using of solvents, fuel stations, and asphalt concrete factories [4] [9] [13] . On the other hand, indoor sources include tobacco smoke, cleaning products, heating, cooking fumes, varnishing and painting, use of computers, photocopiers and printers [25] - [27] .
Quantification of VOCs in ambient air is important for the assessment of air quality and for understanding the photochemical smog formation. One of the major components of photochemical smog is O3 and it is formed through a series of complex reactions between oxides of nitrogen (NOx) and VOCs in the presence of sunlight and under favorable meteorological conditions [23] [28] [29] . When aromatic compounds react with hydroxyl radicals (OH) and/or nitrate (NO3) radicals, the resulting products of the reaction contribute to the formation of secondary organic aerosol (SOA) by nucleation and condensation process [30] . Odum et al. [31] reported that the reaction between toluene and NOx in the presence of a light source formed SOA with a significant aerosol yield. Thus, BTEX influence gas phase pollutants directly as well as particle- phase pollutants indirectly and are considered to be the markers of human exposure to VOCs, therefore, they remain in the center of attention and hence their monitoring is very necessary.
This study focused on the determination of BTEX in ambient air at a pollution hotspot in Delhi and also determines the main sources for BTEX emission in the monitoring area. The obtained results allowed us to get some answers about the effectiveness of policies to reduce traffic-related emissions in India and established a new baseline to monitor future changes in the ozone layer precursor levels.
2. Materials and Methods
2.1. The Study Area
Delhi (28˚24'17" to 28˚53', 76˚20'37" to 77˚20'37"), the National Capital Territory of India, has a geographic area of 1483 km2 stretched in the east?west width approximately 51.9 km and northwest width approximately 48.48 km with a population 13.79 million. Samples were collected adjacent to the Delhi-Mathura Road/National Highway 2 shown in Figure 1. Mathura Road is one of the major arterial roads in Delhi with an average traffic flow of 170,000 vehicles per day [32] . Buses, cars, two-wheelers, three-wheelers and light commercial vehicles (LCVs) are not restricted but trucks are not allowed between 07:30 to 11:00 hours and 17:00 to 21:30 hours [33] .
2.2. BTEX Sampling Technique
Ambient BTEX samples were collected using an Organic auto sampler (Instrumex). The sampler consists of glass sampling tubes containing activated charcoal (40 - 60 mesh size) and air suctioning pump. Air was pumped at a rate of 0.2 L/min, for 2 hours.

Figure 1. Study area (Central Road Research Institute situated at Delhi-Mathura national highway).
After sampling activated charcoal tubes samples were sealed immediately in order to prevent further adsorption of compounds on the tubes and stored at 4˚C until analysis. Samples were extracted by adding 2 ml of carbon disulfide and shaking gently for 40 minutes Carbon disulfide was subsequently filtered out with Teflon syringe filter [4] .
All samples were analyzed using GC-FID (Shimadzu, GC-2010) equipped with an Omega SPTm column (100m × 0.25 mm id × 0.20 μm). GC oven was programmed for 60˚C, hold for two minutes and ramped to 260˚C at a rate of 10˚C/min with 12 minutes hold at 230˚C. Hydrogen was used as carrier gas. The standard calibration mixture containing benzene, toluene, ethylbenzene, o-xylene, m-xylene and p-xylene (Supelco) was used for calibration. Quality assurance and quality control (QA/QC) measures included laboratory and field blank and replicates were taken for measurements of samples. For laboratory blank, unexposed charcoal glass tubes were analyzed for VOCs similar to the exposed ones.
3. Results and Discussions
3.1. BTEX Levels
Average BTEX concentration was found to be 277.4 ± 80.22 μg/m3 and a summary of the data is presented in Table 1. Toluene (162.68 ± 49.91 μg/m3) was found to be the most abundant compound followed by benzene (60.22 ± 10.60 μg/m3) and ethylbenzene (49.42 ± 10.86 μg/m3). Xylene isomers i.e. m, p-xylene (28.44 ± 26.42 μg/m3), o- xylene (20.25 ± 16.64 μg/m3) were present at a lower concentration at the sampling site. In several studies, toluene has been reported as the most abundant compound in the urban environment including India [4] [34] - [37] , Iran [16] , Spain [38] , Mexico [39] . The concentration levels observed in this study are comparable to data reported for India [4] [12] [35] , in Texas [40] , China [41] and Michigan [42] .
This high concentration of BTEX around the sampling site may have been the result of its close proximity to the arterial road, characterized by heterogeneous traffic and high-intensity movement of motor vehicles and service station and petrol pump nearby.
The annual mean concentration of benzene in ambient air according to National Ambient Air Quality Standards (NAAQS) must not exceed 5 μg/m3. In this study, the average concentration of benzene was found 12 times higher from its prescribed limit. Toluene does not have the standard limit, but WHO establishes a guideline value of 260 μg/m3, as a weekly average for the protection of human health. In this case, the guideline level remains much above the measured levels of toluene in this study.
3.2. Seasonal Concentration of BTEX
A clear seasonal variation was observed for all species, and concentrations were highest in the winter season followed by summer and spring (Figure 2). A large statistically significant (p < 0.05) variation was observed in seasonal BTEX levels, ranging from 413.35 ± 207.30 μg/m3 in Winter to 210.95 ± 46.61 μg/m3 in Spring. The concentration

Table 1. Monthly BTEX (μg/m3) concentration at the sampling site.
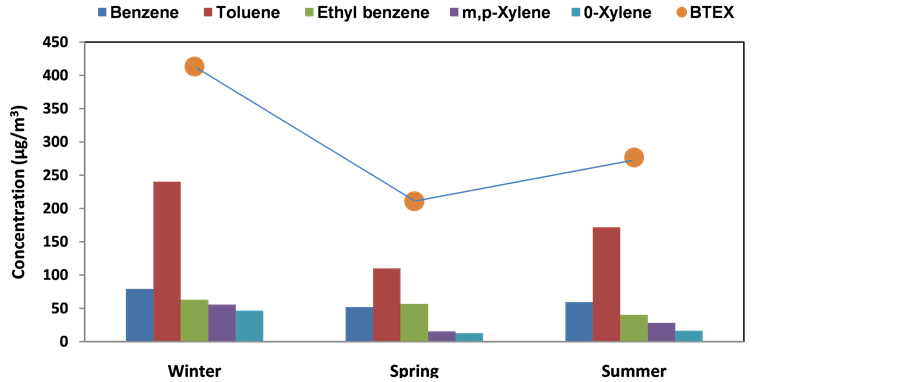
Figure 2. Seasonal variation of BTEX at the sampling site, Delhi.
of BTEX in the winter (January 2015) was significantly higher than the concentration of BTEX in the spring (February to March 2015) and summer months (April to June 2015) (Figure 3). The average concentration during the period from April to June was 276.67 ± 36.67 μg/m3 with the average temperature of atmospheric air of 38˚C, while in the spring the average concentration was found to be 210.95 ± 46.61 μg/m3, with the average atmospheric temperature of 22˚C.
Toluene was the most abundant species which contributed 60% - 62%, 50% - 52% and from 60% - 67% of the total BTEX in winter, spring, and summer, respectively, followed by benzene and ethylbenzene. During winter, the calm meteorological conditions, low solar radiation, temperature inversion, low mixing heights, and high stability of the atmosphere restrict the mixing up of pollutants among the different air layers, thereby increasing the atmospheric pollutant concentration. Thus, the BTEX generally show a higher level of concentration in winter months [4] [28] . Cold start gasoline engines could be another source of BTEX emissions during winter.
During the spring season, a drop was noticed in the BTEX concentration because of OH radical production from O3 photolysis and of mixing height increase in the warmest hours of the day, which lead to the dilution of the BTEX compounds [4] . BTEX seasonal concentrations have decreased from winter to spring reaching minimum levels and subsequently increased from spring to summer season. The BTEX concentrations were slightly higher in summer because these are emitted to the atmosphere from anthropogenic activities such as automobile exhausts and evaporation of gasoline vapors from motor vehicles and there is more evaporation during summer period from the filling stations.
There is not much difference in the levels of ethylbenzene and isomers of xylenes across the three seasons. The reason may be that these compounds are less stable in the

Figure 3. Box plots showing the concentration of BTEX during different seasons.
atmospheric air as compared to benzene and toluene [9] . BTEX concentrations were generally lower in spring and summer than in winter, as found in many other studies [4] [28] . BTEX levels observed in this study are in the same range as reported in studies of Delhi and Mumbai, India [34] [35] . However, Kumar and Tyagi [36] reported the lower concentration of the BTEX compounds in Delhi relative to the concentrations observed in this study.
3.3. BTEX Ratios
Toluene/benzene (T/B), ethylbenzene/benzene (EB/B), m,p-xylene/benzene (m,p-Xy/B), o-xylene/benzene (o-Xy/B) and m,p-xylene/ethylbenzene (m,p-Xy/EB) ratios were investigated and are summarized in Table 2. Variations in all the ratios were not due to the variations in the distance to emission sources, because the location of the sampling site stayed the same throughout the sampling period. The numerical values of BTEX inter-species ratio provide the useful information about the main sources contributing to BTEX emissions at the monitoring area. BTEX interspecies ratio values largely depend on the climatic conditions of the area, the types of organic compound emission sources into the air, and the age of air parcels [9] [43] .
3.3.1. Toluene/Benzene
Benzene and toluene are relatively stable aromatic VOCs than xylenes and ethylbenzene, with atmospheric lifetimes of 9.4 and 1.9 days, respectively [5] [29] . T/B ratio approaching a value of 1 indicates traffic-originating emission sources and there is an increase in this value with the closeness to the pollution source [44] . Values of T/B much greater than 1 indicate the presence of other sources of toluene at the sampling site. The high T/B ratio observed in this study, are in agreement with typical values of vehicular emissions plus the other sources, such as evaporation of solvents from factories and emissions from other stationary sources like fuel stations, could make a noticeable contribution to atmospheric BTEX [45] . During the summer season, an increase in T/B ratio was observed. This may be due to the enhanced evaporation of BTEX from the nearby local emissions from industrial area, service stations, gasoline stations, vehicle emissions and waste decomposition at waste dumping lands.
3.3.2. Xylenes/Ethylbenzene
The ratio of m, p-xylenes to ethyl benzene (m, p-Xy/EB) has been used to obtain information about the intensity of the photochemical reactions occurring in the atmosphere i.e. photochemical age of air mass [19] [46] . The main sources of these two VOCs are vehicle exhaust and solvent use. The atmospheric lifetime of ethylbenzene and
Table 2. Seasonal average variation in inter-species ratios of aromatic VOCs.
m,p-xylenes are 1.7 days and 14 - 31 h, respectively. Low m,p-Xy/EB values are associated with active photochemical reactions [5] [47] . A value of 3.6:1 of this ratio has been established as a typical emission relation for xylenes and ethylbenzene [10] [48] . In this study, low values for m,p-Xy/EB, indicates aging of the air mass and effects of photochemical reaction. A mean value of 0.67 for this ratio was obtained for summer. During winter and spring, the mean values were 0.30 and 0.26 respectively. This indicates that the photochemical reactions were active during daytime.
3.3.3. Ethyl Benzene/Benzene
The key sources of ethylbenzene are fuel evaporation, vehicular exhaust, and solvents. The highest EB/B ratio was observed in spring (1.09) followed by summer (0.68) and then winter (0.39) at the sampling location. In this study, low ethylbenzene/benzene (EB/B) ratios were observed (0.39 to 1.09), which implies aging of the air masses. It indicates that benzene concentration is higher and more reactive species have been exposed to photochemical degradation. It also implies that ethylbenzene has been transported to the sampling site from the nearby areas [4] .
3.3.4. Xylenes/Benzene
Xylenes are used in solvents, and as compared to benzene, xylene has a higher reactivity with radicals. The highest Xy/B ratio was observed in winter (0.95) followed by summer (0.46) and then spring (0.26). The low Xy/B ratios observed in this study indicate the contribution of photochemical reactions during daytime [4] [9] [13] .
3.4. BTEX Correlations
Figure 4 shows the scatter plots of benzene against ethylbenzene, toluene, and xylenes at the monitoring site. As shown in Table 3, moderate positive BTEX correlation was observed at the monitoring site. Noticeably, benzene and toluene showed a significant linear correlation (p < 0.01) at the monitoring site. A high correlation among toluene and benzene indicate a common source, possibly vehicular emissions. Poor correlation between ethylbenzene and xylenes with other BTEX species might imply that ethylbenzene had sources other than vehicular emissions. The poor correlation can be explained by the mixed sources of BTEX that appeared at different times like some sources of BTEX only gets emitted at a certain time, such as the evaporation of solvents during cleaning and painting processes. Even toluene had a moderate positive correlation with
Table 3. Summary of BTEX linear correlation coefficients (R) at the monitoring site.

Figure 4. Scatter plots of benzene levels against those of (a) toluene vs benzene (b) ethylbenzene vs benzene and (c) xylenes vs benzene at the site.
other BTEX species except benzene. The moderate mutual correlations of BTEX except between benzene and toluene might suggest that there were various sources of BTEX at the monitoring site. Lower correlations of ethylbenzene and xylenes with the other compounds could be related to their relatively long atmospheric life, which induces an accumulation in the atmospheric air.
4. Conclusions
In this study, characterization of VOCs (benzene, toluene, ethylbenzene and m-, p-, o-xylene) was carried out at one of the major arterial roads in Delhi. The concentrations of VOCs ranged from undetectable to 546 µg/m3. Among BTEX species, toluene had the highest concentration followed by benzene. The results of this study showed distinct seasonal and spatial variability in atmospheric BTEX concentrations at sampling site (which comprises of important industries, incinerator plant, high traffic volume, and many service and gasoline stations). For a complete understanding of BTEX sources, identification of various sources requires the use of a more robust tool such as receptor modeling.
T/B ratios were observed to be higher in winter than summer and suggest that the main sources for BTEX in two seasons were attributed to vehicle emissions, and sources other than vehicle emission also made a great contribution to atmospheric BTEX. Even after the reduction (<1%) of aromatic compounds in gasoline, exposure to BTEX is quite high. Interestingly, the BTEX ratios showed a seasonal trend, which could be indicative of differential reactivity of different BTEX species in different seasons. Given that benzene and ethyl benzene were major cancer-causing pollutants from vehicle exhaust, there is a need to tighten emission standards for such toxic compounds.
Even if the monitoring was done in a single location, our results pointed out that the high levels might cause health risks to the people working or residing near the sampling location. The increase in VOC levels could be the result of high moving traffic and the different point sources near the study area, which emphasis on the adoption of more stringent emission norms and improvement in fuel quality as well as in vehicle technology. Further analysis is necessary for a comprehensive estimation of emissions as well as exposure and risks associated with these aromatic hydrocarbons in areas with high-density traffic.
Acknowledgements
Authors acknowledge financial assistance provided by the University Grant Commission (UGC) in the form of Senior Research Fellowship. We thank Advanced Instrumentation Research Facility, Jawaharlal Nehru University, for the GC-FID facility and technical help provided by Mr. Ajai Kumar during GC-FID operation is also appreciated.
Cite this paper
Gaur, M., Singh, R. and Shukla, A. (2016) Variability in the Le- vels of BTEX at a Pollution Hotspot in New Delhi, India. Journal of Environmental Pro- tection, 7, 1245-1258. http://dx.doi.org/10.4236/jep.2016.710110
References
- 1. Delhi Statistical Handbook: Registered vehicles in Delhi (2014) Directorate of Economics and Statistics. Govt. of National Capital Territory of Delhi.
http://www.des.delhigovt.nic.in - 2. Economic Survey of Delhi (2014-2015).
http://delhi.gov.in/wps/wcm/connect/DoIT_Planning/planning/economic+survey+of+dehli/economic+survey+of+delhi+2014+-+2015 - 3. Sindhwani, R. and Goyal, P. (2014) Assessment of Traffic-Generated Gaseous and Particulate Matter Emissions and Trends over Delhi (2000-2010). Atmospheric Pollution Research, 5, 438-446.
http://dx.doi.org/10.5094/APR.2014.051 - 4. Hoque, R.R., Khillare, P.S., Agarwal, T., Shridhar, V. and Balachandran, S. (2008) Spatial and Temporal Variation of BTEX in the Urban Atmosphere of Delhi, India. Science of the total Environment, 392, 30-40.
http://dx.doi.org/10.1016/j.scitotenv.2007.08.036 - 5. Garzon, J.P., Huertas, J.I., Magana, M., Huertas, M.E., Cardenas, B., Watanabe, T., Maeda, T., Wakamatsu, S. and Blanco, S. (2015) Volatile Organic Compounds in the Atmosphere of Mexico City. Atmospheric Environment, 119, 415-429.
http://dx.doi.org/10.1016/j.atmosenv.2015.08.014 - 6. Gaur, M., Singh, R. and Shukla, A. (2015) Weekday/Weekend Differences in Concentrations of Ozone, Oxides of Nitrogen and Carbon Monoxide at a Busy Arterial Road in Delhi, India. Journal of Environmental Research and Development, 9, 1088-1094.
- 7. World Health Organization (1980) Indoor Air Quality: Organic Pollutants, EURO Reports and Studies No. 111; 1980, Copenhagen, Denmark.
- 8. Srivastava, A. and Mazumdar, D. (2011) Monitoring and Reporting VOCs in Ambient Air. In: Mazzeo, N., Ed., Air Quality Monitoring, Assessment, and Management, InTech, Croatia
EUROPEAN UNION.
http://www.intechopen.com/books/air-quality-monitoring-assessment-andmanagement/monitoring-and-reporting-vocs-in-ambient-air - 9. Marc, M., Bielawska, M., Wardencki, W., Namiesnik, J. and Zabiegala, B. (2015) The Influence of Meteorological Conditions and Anthropogenic Activities on the Seasonal Fluctuations of BTEX in the Urban Air of the Hanseatic City of Gdansk, Poland. Environmental Science and Pollution Research, 22, 11940-11954.
http://dx.doi.org/10.1007/s11356-015-4484-9 - 10. Lee, S.C., Chiu, M.Y., Ho, K.F., Zou, S.C. and Wang, X. (2002) Volatile Organic Compounds (VOCs) in Urban Atmosphere of Hong Kong. Chemosphere, 48, 375-382.
http://dx.doi.org/10.1016/S0045-6535(02)00040-1 - 11. Saxena, P. and Ghosh, C. (2012) A Review of Assessment of Benzene, Toluene, Ethylbenzene and Xylene (BTEX) Concentration in Urban Atmosphere of Delhi. International Journal of the Physical Sciences, 7, 850-860.
- 12. Srivastava, A., Sengupta, B. and Dutta, S.A. (2005) Source Apportionment of Ambient VOCs in Delhi City. Science of the Total Environment, 343, 207-220.
http://dx.doi.org/10.1016/j.scitotenv.2004.10.008 - 13. Buczynska, A.J., Krata, A., Stranger, M., Godoi, A.F.L., Kontozova-Deutsch, V., Bencs, L., Naveau, I., Roekens, E. and Van Grieken, R. (2009) Atmospheric BTEX-Concentrations in an Area with Intensive Street Traffic. Atmospheric Environment, 43, 311-318.
http://dx.doi.org/10.1016/j.atmosenv.2008.09.071 - 14. Majumdar, D., Mukherjeea, A.K. and Sen, S. (2011)TEX in Ambient Air of a Metropolitan City. Journal of Environmental Protection, 2, 11-20.
http://dx.doi.org/10.4236/jep.2011.21002 - 15. Oanh, N.K., Kongpran, J., Hang, N.T., Parkpian, P., Hung, N.T.Q., Lee, S.B. and Bae, G.N. (2013) Characterization of Gaseous Pollutants and PM2.5 at Fixed Roadsides and along Vehicle Traveling Routes in Bangkok Metropolitan Region. Atmospheric Environment, 77, 674-685.
http://dx.doi.org/10.1016/j.atmosenv.2013.06.001 - 16. Rad, H.D., Babaei, A.A., Goudarzi, G., Angali, K.A., Ramezani, Z. and Mohammadi, M.M. (2014) Levels and Sources of BTEX in Ambient Air of Ahvaz Metropolitan City. Air Quality, Atmosphere & Health, 7, 515-524.
http://dx.doi.org/10.1007/s11869-014-0254-y - 17. De Castro, B.P., de Souza Machado, G., Bauerfeldt, G.F., Fortes, J.D.N. and Martins, E.M. (2015) Assessment of the BTEX Concentrations and Reactivity in a Confined Parking Area in Rio de Janeiro, Brazil. Atmospheric Environment, 104, 22-26.
http://dx.doi.org/10.1016/j.atmosenv.2015.01.013 - 18. Dutta, C., Som, D., Chatterjee, A., Mukherjee, A.K., Jana, T.K. and Sen, S. (2009) Mixing Ratios of Carbonyls and BTEX in Ambient Air of Kolkata, India and Their Associated Health Risk. Environmental Monitoring and Assessment, 148, 97-107.
http://dx.doi.org/10.1007/s10661-007-0142-0 - 19. Zhang, Y., Mu, Y., Liu, J. and Mellouki, A. (2012) Levels, Sources and Health Risks of Carbonyls and BTEX in the Ambient Air of Beijing, China. Journal of Environmental Sciences, 24, 124-130.
http://dx.doi.org/10.1016/S1001-0742(11)60735-3 - 20. Miller, L., Xu, X., Wheeler, A., Atari, D.O., Grgicak-Mannion, A. and Luginaah, I. (2011) Spatial Variability and Application of Ratios between BTEX in Two Canadian Cities. The Scientific World Journal, 11, 2536-2549.
http://dx.doi.org/10.1100/2011/167973 - 21. Elbir, T., Cetin, B., Cetin, E., Bayram, A. and Odabasi, M. (2007) Characterization of Volatile Organic Compounds (VOCs) and Their Sources in the Air of Izmir, Turkey. Environmental Monitoring and Assessment, 133,149-160.
http://dx.doi.org/10.1007/s10661-006-9568-z - 22. Sahu, L.K. (2012) Volatile Organic Compounds and Their Measurements in the Troposphere. Current Science, 102, 1645-1649.
- 23. Shen, X., Zhao, Y., Chen, Z. and Huang, D. (2013) Heterogeneous Reactions of Volatile Organic Compounds in the Atmosphere. Atmospheric Environment, 68, 297-314.
http://dx.doi.org/10.1016/j.atmosenv.2012.11.027 - 24. Kamyotra, J.S., Mahwar, R.S., Saxena, R.C., Thirumurthy, G., Puri, M. and Debroy, R. (2010) Status of the Vehicular Pollution Control Programme in India. Central Pollution Control Board, Ministry of Environment and Forests, Government of India.
http://cpcb.nic.in/upload/NewItems/NewItem_157_VPC_REPORT.pdf - 25. Destaillats, H., Maddalena, R.L., Singer, B.C., Hodgson, A.T. and McKone, T.E. (2008) Indoor Pollutants Emitted by Office Equipment: A Review of Reported Data and Information Needs. Atmospheric Environment, 42, 1371-1388.
http://dx.doi.org/10.1016/j.atmosenv.2007.10.080 - 26. Jia, C., Batterman, S. and Godwin, C. (2008) VOCs in Industrial, Urban and Suburban Neighborhoods, Part 1: Indoor and Outdoor Concentrations, Variation, and Risk Drivers. Atmospheric Environment, 42, 2083-2100.
http://dx.doi.org/10.1016/j.atmosenv.2007.11.055 - 27. Wu, X., Apte, M.G., Maddalena, R. and Bennett, D.H. (2011) Volatile Organic Compounds in Small
and Medium-Sized Commercial Buildings in California. Environmental Science & Technology, 45, 9075-9083.
http://dx.doi.org/10.1021/es202132u - 28. Fanizza, C., Incoronato, F., Baiguera, S., Schiro, R. and Brocco, D. (2014) Volatile Organic Compound Levels at One Site in Rome Urban Air. Atmospheric Pollution Research, 5, 303
314.
http://dx.doi.org/10.5094/APR.2014.036 - 29. Atkinson, R. (2000) Atmospheric Chemistry of VOCs and NOx. Atmospheric Environment, 34, 2063-2101.
http://dx.doi.org/10.1016/S1352-2310(99)00460-4 - 30. Brocco, D., Fratarcangeli, R., Lepore, L., Petricca, M. and Ventrone, I. (1997) Determination of Aromatic Hydrocarbons in Urban Air of Rome. Atmospheric Environment, 31, 557
566.
http://dx.doi.org/10.1016/S1352-2310(96)00226-9 - 31. Odum, J.R., Hoffmann, T., Bowman, F., Collins, D., Flagan, R.C. and Seinfeld, J.H. (1996) Gas/Particle Partitioning and Secondary Organic Aerosol Yields. Environmental Science & Technology, 30, 2580-2585.
http://dx.doi.org/10.1021/es950943+ - 32. Pant, P., Shukla, A., Kohl, S.D., Chow, J.C., Watson, J.G. and Harrison, R.M. (2015) Characterization of Ambient PM 2.5 at a Pollution Hotspot in New Delhi, India and Inference of Sources. Atmospheric Environment, 109, 178-189.
http://dx.doi.org/10.1016/j.atmosenv.2015.02.074 - 33. Delhi Police (2014) Restriction on the Movement of LGV and HGV/MGV Vehicles.
https://delhitrafficpolice.nic.in/about-us/notifications/ - 34. Srivastava, A. (2005) Variability in VOC Concentrations in an Urban Area of Delhi. Environmental Monitoring and Assessment, 107, 363-373.
http://dx.doi.org/10.1007/s10661-005-3546-8 - 35. Srivastava, A., Joseph, A.E. and Devotta, S. (2006) Volatile Organic Compounds in Ambient air of Mumbai-India. Atmospheric Environment, 40, 892-903.
http://dx.doi.org/10.1016/j.atmosenv.2005.10.045 - 36. Kumar, A. and Tyagi, S.K. (2006) Benzene and Toluene Profiles in Ambient Air of Delhi as Determined by Active Sampling and GC Analysis. Journal of Scientific and Industrial Research, 65, 252-257.
- 37. Bauri, N., Bauri, P., Kumar, K. and Jain, V.K. (2015) Evaluation of Seasonal Variations in Abundance of BTXE Hydrocarbons and Their Ozone forming Potential in Ambient Urban Atmosphere of Dehradun (India). Air Quality, Atmosphere & Health, 9, 95-106.
http://dx.doi.org/10.1007/s11869-015-0313-z - 38. Parra, M.A., González, L., Elustondo, D., Garrigó, J., Bermejo, R. and Santamaría, J.M. (2006) Spatial and Temporal Trends of Volatile Organic Compounds (VOC) in a Rural Area of Northern Spain. Science of the Total Environment, 370, 157-167.
http://dx.doi.org/10.1016/j.scitotenv.2006.06.022 - 39. Cerón-Bretón, J.G., Cerón-Bretón, R.M., Kahl, J.D.W., Ramírez-Lara, E., Guarnaccia, C., Aguilar-Ucán, C.A., López-Chuken, U., et al. (2014) Diurnal and Seasonal Variation of BTEX in the Air of Monterrey, Mexico: Preliminary Study of Sources and Photochemical Ozone Pollution. Air Quality, Atmosphere & Health, 8, 469-482.
http://dx.doi.org/10.1007/s11869-014-0296-1 - 40. Smith, L.A., Stock, T.H., Chung, K.C., Mukerjee, S., Liao, X.L., Stallings, C. and Afshar, M. (2007) Spatial Analysis of Volatile Organic Compounds from a Community-Based Air Toxics Monitoring Network in Deer Park, Texas, USA. Environmental Monitoring and Assessment, 128, 369-379.
http://dx.doi.org/10.1007/s10661-006-9320-8 - 41. Wang, X.M., Sheng, G.Y., Fu, J.M., Chan, C.Y., Lee, S.C., Chan, L.Y. and Wang, Z.S. (2002) Urban Roadside Aromatic Hydrocarbons in Three Cities of the Pearl River Delta, People’s Republic of China. Atmospheric Environment, 36, 5141-5148.
http://dx.doi.org/10.1016/S1352-2310(02)00640-4 - 42. Johnson, M.M., Williams, R., Fan, Z., Lin, L., Hudgens, E., Gallagher, J., Vette, A., Neas, L. and Ozkaynak, H. (2010) Participant-Based Monitoring of Indoor and Outdoor Nitrogen Dioxide, Volatile Organic Compounds, and Polycyclic Aromatic Hydrocarbons among MICA-Air Households. Atmospheric Environment, 44, 4927-4936.
http://dx.doi.org/10.1016/j.atmosenv.2010.08.027 - 43. Vardoulakis, S., Solazzo, E. and Lumbreras, J. (2011) Intra-Urban and Street Scale Variability of BTEX, NO2 and O3 in Birmingham, UK: Implications for Exposure Assessment. Atmospheric Environment, 45, 5069-5078.
http://dx.doi.org/10.1016/j.atmosenv.2011.06.038 - 44. Gelencsér, A., Siszler, K. and Hlavay, J. (1997) Toluene-Benzene Concentration Ratio as a Tool for Characterizing the Distance from Vehicular Emission Sources. Environmental Science & Technology, 31, 2869-2872.
http://dx.doi.org/10.1021/es970004c - 45. Liu, P.W.G., Yao, Y.C., Tsai, J.-H., Hsu, Y.-C., Chang, L.P. and Chang, K.H. (2008) Source Impacts by Volatile Organic Compounds in an Industrial City of Southern Taiwan. Science of Total Environment, 398, 154-163.
http://dx.doi.org/10.1016/j.scitotenv.2008.02.053 - 46. Hsieh, L.T., Wang, Y.F., Yang, H.H. and Mi, H.H. (2011) Measurements and Correlations of MTBE and BETX in Traffic Tunnels. Aerosol and Air Quality Research, 11, 763-775.
http://dx.doi.org/10.4209/aaqr.2011.03.0035 - 47. Zalel, A. and Broday, D.M. (2008) Revealing Source Signatures in Ambient BTEX Concentrations. Environmental Pollution, 156, 553-562.
http://dx.doi.org/10.1016/j.envpol.2008.01.016 - 48. Keymeulen, R., Gorgényi, M., Héberger, K., Priksane, A. and Van Langenhove, H. (2001) Benzene, Toluene, Ethyl Benzene and Xylenes in Ambient Air and Pinus sylvestris L. Needles: A Comparative Study between Belgium, Hungary and Latvia. Atmospheric Environment, 35, 6327-6335.
http://dx.doi.org/10.1016/S1352-2310(01)00424-1