Journal of Environmental Protection
Vol.4 No.4(2013), Article ID:30225,6 pages DOI:10.4236/jep.2013.44036
Agricultural Solids Waste in South of Jordan: Facts and Figures
![]()
1Chemical Engineering Department, Mutah University, Karak, Jordan; 2Civil Engineering Department, Al al-Bayt University, Mafraq, Jordan.
Email: *fares1233@mutah.edu.jo
Copyright © 2013 Fares A. Al Momani, Moayyed Shawaqfah. This is an open access article distributed under the Creative Commons Attribution License, which permits unrestricted use, distribution, and reproduction in any medium, provided the original work is properly cited.
Received September 14th, 2012; revised January 17th, 2013; accepted February 18th, 2013
Keywords: Agricultural; Anaerobic Digestion; Solid Waste; Substrate
ABSTRACT
Agricultural solid wastes in the southern part of Jordan were estimated and classified. Data collection method was used to determine the types and quantities of different agricultural solid wastes. Human excreta and cattle manure were found to be serious environmental problems in the region. Chemical analysis of different solid wastes showed variable organic and nitrogen content which affect the selection of treatment process. Anaerobic digestion (AD) was tested and found to be a suitable unit operation to treat a wide variety of agricultural solid wastes. Biogas production rate from AD ranged from 0.3 m3/kg COD to 0.61 m3/kg COD which is considered 80% to 90% of yield. The optimum C/N ratio and TVS for AD was found to be 22 ± 2 and 70% ± 5%, respectively. The amount of energy that can be produced from energy crops and animal manures was estimated to be 12.8 Mtoe and 0.34 Mtoe, respectively. Methane biogas production rate was estimated to be 37 m3/ton for substrate consist of mixture of different agricultural solid waste of 50% wastewater, 40% Cattle manure, 5% straw and 5% sawdust.
1. Introduction
Millions of tons of solid wastes are generated from agricultural, municipal and industrial sources every year. These amounts are expected to increase exponentially due to the growth of the world’s population and the increase of urbanized areas. In 2001 for example, more than 350 million tons of municipal solid waste (MSW) were produced in North America alone [1,2].
One example of a solid waste material is agricultural waste, including animal manure. The quantity of animal manure produced in each country is estimated to be 110 times greater than the amount of human waste [3]. Recent reports identified manure waste as a major national environmental problem in various countries [4]. The potential pollutants from the decomposition of livestock manure are pathogens, nutrients, methane, and ammonia emissions [5].
The uncontrolled decomposition of the organic solid waste can produce large-scale contamination of different parts of ecosystem (soil, water, and air) [6,7]. It was reported that the decomposition of one metric ton of organic solid waste can potentially release 50 to 110 m3 of carbon dioxide and 90 to 140 m3 of methane into the atmosphere [6,8].
Organic components of the solid waste can be converted into a valuable source of energy by anaerobic digestion (AD). Anaerobic digestion uses bacteria to convert organic materials to biogas or fertilizer by fermentation. This technology will not only reduce the adverse impact on the environment but will also contribute to the reduction in consumption of fossil fuels.
Different organic materials have different bio-chemical characteristics; hence, their treatment methods also vary accordingly. The present work investigates the amount of solid waste in the southern part of Jordan. In this country high quantities of animal, human and agricultural wastes are produced every year. Different treatment options can be suggested to manage and solve solid waste problems. However any treatment process would require a comprehensive overview on the types and the quantities of wastes. It is the objective of this work to classify the solid waste pollutants. This classification will aim to characterize these pollutants, evaluate their quantities, estimate their impact and propose treatment solution.
2. Experimental Procedure
The experimental work was divided into two parts: solid waste data collection and solid waste characterization.
2.1. Data Collection
Agricultural data was collected based on a statistical survey in the southern part of Jordan mainly the following cities Karak, Maan, Tafilah and Aqaba. The estimation was based on interviews with 500 active farmers in each city and the collection of field data as well as the agricultural reports available at the Ministry of Agriculture for each city.
2.2. Analytical Methods
Several analytical methods and tests were used. Following is a list of these methods and tests:
2.2.1. Carbon to Nitrogen Ratio (C/N Ratio)
Two methods were used to determine the C/N ratio of different solid wastes. These methods are:
1) Total Kjeldahl’s nitrogen method (TKN): The method was performed according to a standard procedure in which each sample was analyzed in duplicate to verify the results. This method is used to analyze nitrogen contained in organic molecules and ammonium but not nitrate.
2) Simple combustion: This method was based on a simple combustion of the waste matter in the presence of excess oxygen. The wastes were completely converted into simple molecules or gases such as CO2, H2O and N2. The gases were separated and analyzed using chromatography techniques. The equipments used in this analysis were a total organic carbon analyzer (TOC) and gas chromatography (GC). A Hewlett Packard (HP 6890) gas chromatography equipped with a flame ionisation detector and HP PLOT-Q column (L = 30 m and I.D. 0.53 mm) was used. The oven temperature was held at 250˚C for 5 minutes. The TOC was measured using a Shimadzu TOC analyzer calibrated using a potassium phthalate standard solution and following the instrument standard method. Each sample was analyzed three times and measurements were averaged. Measurement reproducibility showed a precision in the range of ±0.1 mg·C·L−1.
2.2.2. Chemical Oxygen Demand
Chemical oxygen demand (COD) was measured following the standard method (SM 5220-D). The measurement was carried out using a photometer (Hach, Germany) and a dichromate solution as an oxidant in a strong acidic medium. The precision in the COD test was in the range of ±0.8 mg·O2·L−1.
2.2.3. Biological Oxygen Demand (BOD)
The biological oxygen demand (BOD) was measured according to the standard method [SM 5210-D] using an Oxitop system (VELP Scientifica). The results of BOD10 and BOD21 were comparable, therefore only the BOD5 result was considered in this study. The precision of the BOD test was in the range of ±0.5 mg·O2·L−1.
2.2.4. Energy Crop Calculations
Energy calculations were carried out based on the theoretical oil equivalent (TOE) method. TOE is the amount of energy released by burning one tone of crude oil. The calculations of energy crop values were performed based on the energy value conversion method. This method depends on the determination of the output energy produced upon combustion of a specific mass of wastes. These values were calculated in kcal and then converted to Mtoe.
2.2.5. Biogas Experiments and Feed Mixing
Anaerobic digestions were carried out in a two-step bioreactor with a volume of 5 L (total reactor volume of 10 L). The reactor feed was prepared in the pre-mixing step; a load of 10 kg of different portions of cow manure, wastewater, and sawdust were mixed together. The mixing step was controlled in such a way that yielded a feed with a specific carbon/nitrogen ratio and specific total volatile solids. The used wastewater was obtained from the wastewater treatment plant at Mutah City.
3. Results and Discussion
3.1. Solid Waste Data
Table 1 presents the type and amounts of agricultural solid waste produced the southern part of Jordan from the cities: Karak, Maan, Tafilah and Aqaba.
Table 1. Type and amounts of agricultural solid waste in southern part of Jordan (Karak, Maan, Tafilah and Aqaba).

1The data were estimated by farmer interview; 2Value was calculated based on the amount of wastewater and the average contained solids waste.
One hundred tons of straw and sawdust are produced each year in these cities; this can be added to the production of 40 tons/year of natural wood. Although these amounts are significant, they do not pose serious problem to the region; people have found different uses for these wastes: for example, wood and sawdust can be used as heating source in winter and straw can be used as food for domestic animals. It is believed that concern regarding solid wastes relates to the amounts of human excreta and cattle wastes. The estimation of human excreta was based on the per capita water consumption of 90 L/day and a rule of 67% of the per capita consumption discharged as wastewater. The large quantities of waste combined with complicated treatment presents a serious problem in the southern part of Jordan. Anaerobic digesters (AD) are an attractive treatment option. The advantages of this process are the valuable outcomes (biogas and fertilizer) and the low treatment cost.
3.2. Solid Waste Analysis
Detailed chemical analysis is essential to design efficient and effective treatment methods for the aforementioned solid wastes. Table 2 shows the chemical analysis of different solid presented in Table 1.
The relationship between the amounts of carbon and nitrogen present is expressed in terms of the carbon/nitrogen ratio (C/N). It was reported in literature that a C/N ratio ranging from 20 to 30 is considered optimum for conventional treatment methods (e.g. anaerobic digestion) [9]. If the C/N ratio is very high, the nitrogen will be consumed rapidly by bacteria and the carbon will no longer react. As a result, digestion efficiency as well as biodegradation will be low. On the other hand, if the C/N ratio is very low, nitrogen will be converted to ammonia (NH4). NH4 will increase the pH value of solution in the digester. A pH higher than 8.5 was found to be toxic to the bacterial population. It can be seen in Table 2 shows that animal waste, particularly cattle dung, has a average C/N ratio of about 24. Plant materials such as straw
Table 2. Chemical analysis of different solid waste in southern part of Jordan.

1Measured experimentally; 2Estimated.
sawdust and wood contain a higher C/N ratio. The human excreta have a C/N ratio as low as 8. Cow waste was also determined to have C/N ratio around 23. Seeing as obtained C/N ratios are not uniform, the treatment method is not effective and the requirements for the variable design must be increased. Consequently, the treatment cost will also increase. To overcome this problem, it was proposed to design influent pre-mixing stage where different ratios of solid wastes can be mixed in different proportions to bring the average C/N ratio of the composite input to a desirable level.
The COD and BOD tests were used to analyze the content of organic matter. The value of COD can be directly related to the total amount of organic matter present in the feed. Meanwhile, BOD deals with the portion of organic matter able to biodegradation. These two values are of great interest for biological degradation. A higher COD is related to a higher organic content and a higher BOD is related a higher amount of organic material that can be biodegraded. It was reported that the biogas (main product of AD) production rate ranges from 0.5 to 0.75 m3 biogas/kg COD [10]. As shown in Table 2, the COD and BOD5 values of the tested wastes vary from 120 to 450 mg/L and 111 to 435 mg/L, respectively. The biodegradability index of these wastes was found to range from 0.79 to 0.97. The theoretical biogas that can be produced by different agricultural wastes was estimated to range from 0.45 to 0.88 m3 biogas/kg of COD. Figure 1 illustrates the amount of biogas produced from different solid wastes in AD. Higher biogas production rates occurred in substrates with a C/N ratio of 32 ± 2, a COD from 380 to 450 mg/L and a biodegradability index of more than 0.9. Moreover, all solid wastes had a biogas production rate higher than 0.3 m3/kg COD with highest amount measuring 0.61 m3/kg COD. These values are a good indication of the high organic content of studied wastes. The experimental and theoretical biogas production rates are in same order of magnitude. The expected biogas yield was estimated to range from 80% to 90%.

Figure 1. The amount of biogas produced from different solid wastes.
3.3. Classification of Solid Waste
Based on their energy values, solid waste can be classified into:
3.3.1. Energy Crops
An energy crop is one that mainly consists of cellulose, lignin and hemicellulose. Lignin is a very poor material in anaerobic conditions. Crops grown for energy could be produced in large quantities [11,12].
Most of the soil in Jordan is not arable even if water is available; only 6% of Jordan’s territory is arable, a figure that is changing rapidly as dry-land areas became larger every year. The dramatic change of the arable area is based on the scarcity of rainfall, the lack of surface and ground water as well as economic problems. In recent years only about 15% of Jordan’s geographic area received more than 200 millimeters of rainfall per year, the minimum required for rain-fed agriculture. Much of this land was otherwise unsuitable for agriculture. Moreover, rainfall varied greatly from year to year, so crops were prone to be ruined by periodic drought. Now it is estimated that only 4.5% of Jordan’s land is being cultivation. Most of these cultivation areas depend mostly on irrigation, mainly from Jordan River valley. Agricultural activity is concentrated in two areas: northern and central areas of higher elevation. Agricultural energy crops such as wheat, barley, tobacco, lentils, and chick-peas were the most cultivated plants. Olives and olive oil were also produced in some regions.
It is difficult to draw an accurate description of the amount of crops that can be used as an input for energy production technology in southern part of Jordan. Variations in geography, amount of rainfall and type of crops between regions as well as the large surface area contribute to this difficulty. The total possible amount of energy crops was calculated for a usage of 10%, 20% and 30% of arable land in the southern part of Jordan. This mean that an estimation of the potential production of energy crops if 10% of arable land within the southern part of Jordan (30,000 km2) was successfully cultivated with energy crops. The present method is advantageous because it converts the amount of energy crops to their energy equivalent value (Mtoe = million tons of oil equivalents). For the purpose of comparison, these results will be compared with results related to the bio-energy production in European Union states (EU-states).
Tables 3 and 4 present the potential of energy crop based on 10%, 20% and 30% arable land utilization in the EU and in the southern part of Jordan, respectively. The values in Table 3 were adopted from the work of Nielson [13] whereas the values in Table 4 were calculated based on the procedure described in Section 2. A simple comparison between the agricultural area in EUStates and the southern part of Jordan lead to the conclusion that this part of Jordan has valuable sources of energy. Although the estimated energy values for Jordanian energy crops were very low compared with values related to the EU, the values in Table 5 are significant. When 10% of the land was cultivated the energy production in southern Jordan was found to be 2.2 Mtoe based on 3 tons of total solid productions while the EU-states produced 46 Mtoe under the same conditions.
However, this low amount of energy is considered to be important for Jordan and investment in this kind of project can save a lot of crude oil and natural gas expenses.
It is important to note that the estimated energy values were calculated based on complete biomass conversion (i.e. 100% conversion). However, biogas conversion efficiency does not exceed 80% due to the fact that not all of the compounds from biomass can be digested through the biological process, for example, lignin. Thus, these values should be taken into account before the application of this technology.
Table 5 presents the expected energy crop potential in terms of methane production through the anaerobic digestion process. The highest estimated amount of biogas production capacity by energy crops is equivalent to 12.8 Mtoe (15.3 million m3 of CH4). As a rough estimation
Table 3. Energy crop potential in EU-27 as function of utilized arable land.

Total solid (TS) = dry matter – biomass. Mtoe = million tons of oil equivalents.
Table 4. Energy crop potential in Jordan as function of utilized arable land.
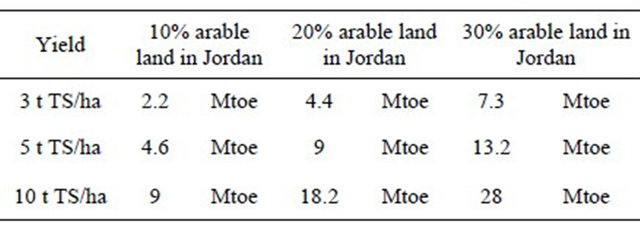
Table 5. Expected methane potential produced from energy crops of 5% of the arable land in Jordan.
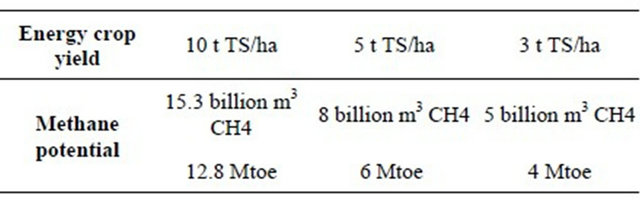
this amount of biogas can reduce the natural gas imported from Egypt by 5%.
3.3.2. Animal Wastes
Jordan has variable animal production resources; the type and quantity of animals produced in Jordan are presented in Table 6. Jordan produces more than 3400 tonnes of animal manure every year. When untreated or managed poorly, manure becomes a major source of ground and fresh water pollution, pathogen release, nutrient leaching, and ammonia emission. If handled appropriately, manure can be a renewable energy and an efficient source of nutrients for crop cultivation. Chicken, cattle and cow manure are considered the primary source of animal waste in Jordan.
It was calculated that animal production sector is responsible for 18% of the greenhouse gas emission (CO2 equivalent) and for 37% of the anthropogenic methane, which has 23 times the global warming potential of CO2.
The amount of energy that can be produced from manure wastes was estimated to be approximately 668 million m3/year (i.e. ≈ 381 million m3 of methane). This amount of methane is equivalent to 0.34 Mtoe. Moreover, biogas production through anaerobic fermentation of animal manure is an effective way to reduce greenhouse gas emissions, especially ammonia and methane from manure storage facilities. The fermentation of manure alone does not only result in high biogas yield, but also positively impacts the stability of the anaerobic digestion process due to its high buffer capacity and diverse elements. Higher methane yield can be achieved through co-digestion of manure with other substrates such as energy crops. The digested substrate resulting from this process can be further refined and can serve as an organic fertilizer that is rich in nitrogen, phosphorous, potassium and other macroand micro-nutrients necessary for the growth of the plants. Utilization of large amounts of animal manure for bio-energy purposes will reduce the nutrient runoffs and diminish the contamination of surface and ground water resources.
3.4. Potential Biogas Production
The biogas production rate from a mixture of the previ-
Table 6. The number of animals in Jordan and their manure production rate (*).
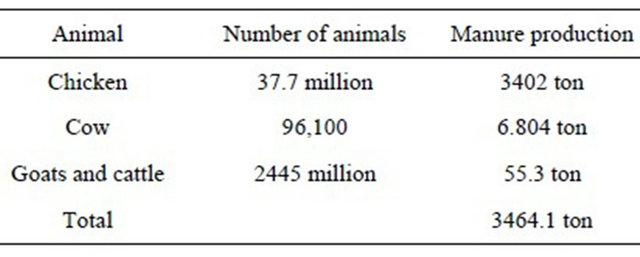
(*) Numbers are based on animal count for year 2009.
ous solid wastes was tested in AD. As human excreta, cattle manure are the solid wastes that have the most effect, the AD feed was prepared from 50% wastewater, 40% cattle manure, 5% straw and 5% sawdust. These percentages were chosen in such a way that C/N ratio of 22 ± 2 and TVS value of 70% ± 5% were obtained. Cumulative biogas production, methane production rate and percent methane in biogas are summarized in Figure 2. The methane content in the biogas produced in the experiments ranged between 55% and 65% by volume. Compared to a single-step reactor which produces biogas with methane content in the range 40% and 60% [14], this two-step reactor was more efficient in terms of biogas quality. Similar results were reported by Yu and colleagues [14]. The methane gas production rate of the reactor was estimated to be 37 m3/ton of dry waste. Other experiments were performed with different TVS contents; a TVS value below 55% shows a lower biogas production rate and increasing the TVS to more than 80% resulted in a decrease in the biogas production rate. Based on experimental conditions a percent TVS value approximately 70% was found to be optimal. The results show that the suitability of these solid wastes as influent to AD. Furthermore, it was observed that the transition period for the tested AD does not exceed more than three days.
• 4. Conclusions
• Human excreta, cattle and cow wastes generated in large quantities are considered serious problem in southern part of Jordan.
• Anaerobic digesters (AD) preceded with pre-mixing step was found to be an attractive treatment option due to valuable outcomes (biogas and fertilizer) and the low treatment cost.
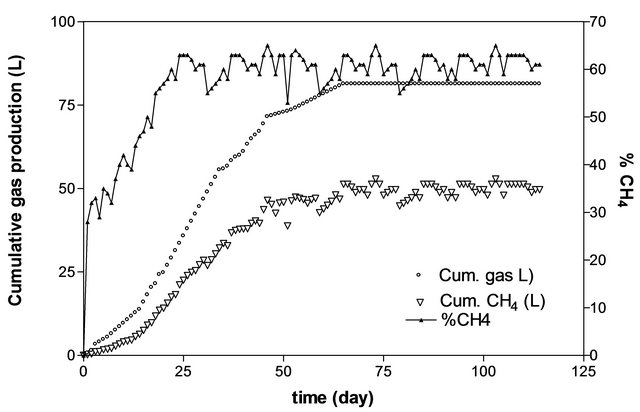
Figure 2. Cumulative biogas production, methane production rate and % Methane in biogas. Substrate composition: 50% wastewater, 20% cow manure, 20% Cattle manure, 5% straw and 5% sawdust. These percentages were chosen in such a way that C/N ratio of 22 ± 2 and TVS value of 70% ± 5% were obtained.
• C/N ratio ranging from 25 to 30 was found to be the optimal range for conventional treatment methods.
• The C/N ratio controlled the performance of the digestion process by balancing both the carbon content and pH of substrate.
• The variation of the C/N ratio between different agricultural solid wastes can be balanced by mixing different proportions of these wastes to bring the average C/N ratio to the optimal level.
• COD and BOD are of great interest for biological degradation. Biogas production rate was estimated to range from 0.45 to 0.88 m3 biogas/kg of COD.
• Energy crops and animal wastes in the southern part of Jordan can produce as much as 13 Mtoe/yr and save up to 5% of fossil fuel consumption.
• Methane production and percent methane in biogas can be controlled by manipulating the C/N ratio, the TVS and substrate composition.
5. Acknowledgements
The author greatly acknowledges the financial support provided by Jordanian Ministry of Higher Education Project 2008/1634/2-H.
REFERENCES
- EPA, “Municipal Solid Waste in the United States: 2005 Facts and Figures,” Environmental Protection Agency, Washington DC, 2006. www.epa.gov
- EPA, “Municipal Solid Waste Generation Recycling and Disposal in the United States: Facts and Figures,” Environmental Protection Agency, Washington DC, 2006. www.epa.gov
- L. Horrigan, R. S. Lawrence and P. Walker, “How Sustainable Agriculture Can Address the Environmental and Human Health Harms of Industrial Agriculture,” Environmental Health Perspectives, Vol. 110, No. 5, 2002, pp. 445-456. doi:10.1289/ehp.02110445
- M. D. Donald, G. Gray, P. Suto and C. Peck, “Anaerobic Digestion of Food Waste,” US Environmental Protection Agency Region, 2011 Final Report 9.
- EPA, “Municipal Solid Waste in the United States: 2007 Facts and Figures,” Environmental Protection, Washington DC, 2008. www.epa.gov
- S. Ghosh, E. R Vieitez, T. Liu and Y. Kato, “Biogasification of Solid Waste by Two Phase Anaerobic Fermentation,” Proceedings of the 3rd Biomass Conference of the Americas, Vol. 2, Montréal, 24-29 August 1997.
- E. Kwon, J. W. Kelly and J. C. Marco, “An Investigation into the Syngas Production from Municipal Solid Waste (msw) Gasification under Various Pressures and CO2 Concentration Atmospheres,” Proceedings of the 17th Annual North American Waste-to-Energy Conference, Chantilly, 18-20 May 2009, pp. 231-236. doi:10.1115/NAWTEC17-2351
- M. Macias-Corral, Z. Samani, A. Hanson, G. Smith, P. Funk, H. Yu and J. Longworth, “Anaerobic Digestion of Municipal Solid Waste and Agricultural Waste and the Effect of Co-Digestion with Dairy Cow Manure,” Bioresource Technology, Vol. 99, No. 17, 2008, pp. 8288-8293. doi:10.1016/j.biortech.2008.03.057
- P. M. Ndegw and S. A. Thompson, “Effects of C-to-N Ratio on Vermicomposting of Biosolids,” Bioresource Technology, Vol. 75, No. 1, 2000, pp. 7-12. doi:10.1016/S0960-8524(00)00038-9
- S. Shakya, “Two Stage Anaerobic Digestion for the Treatment of Dissolved Organic Fraction of Municipal Solid Waste,” PhD Theses, Asian Institute of Technology, Thani, 2010.
- C. Sherrington, J. Bartley and D. Moran, “Farm-Level Constraints on the Domestic Supply of Perennial Energy Crops in the UK,” Energy Policy, Vol. 36, No. 7, 2008, pp. 2504-2512. doi:10.1016/j.enpol.2008.03.004
- V. Skoulou, N. Mariolis, G. Zanakis and A. Zabaniotou, “Sustainable Management of Energy Crops for Integrated Biofuels and Green Energy Production in Greece,” Renewable and Sustainable Energy Reviews, Vol. 15, No. 4, 2011, pp. 1928-1936. doi:10.1016/j.rser.2010.12.019
- J. H. Nielsen and P. Oleskowicz-Popiel, “The Future of Biogas in Europe: Visions and Targets until 2020,” AEBIOM Workshop, European Parliament, 2008.
- H. W. Yu, Z. Samani, A. Hanson and G. Smith, “Energy Recovery from Grass Using Two-Phase Anaerobic Digestion,” Waste Manage, Vol. 22, No. 1, 2002, pp. 1-5.
NOTES
*Corresponding author.