Journal of Environmental Protection
Vol. 3 No. 12 (2012) , Article ID: 25647 , 8 pages DOI:10.4236/jep.2012.312177
Using Chemical Release Surveillance Data to Evaluate the Public Health Impacts of Chlorine and Its Alternatives
![]()
1Agency for Toxic Substances and Disease Registry, Division of Toxicology and Human Health Sciences, Atlanta, GA, USA; 2New York State Department of Health, Bureau of Toxic Substance Assessment, Albany, NY, USA.
Email: *pruckart@cdc.gov
Received September 10th, 2012; revised October 11th, 2012; accepted November 9th, 2012
Keywords: Chlorine; Substitution; Alternatives; Chemicals
ABSTRACT
Background: More than 80 million Americans may be at risk of a chemical exposure because they live near one of the 101 most hazardous chemical facilities or near routes used to transport hazardous chemicals. One approach to hazard reduction is to use less toxic alternatives. Chlorine, one of the chemicals posing the greatest public health danger, has several alternatives depending on the application. Methods: We analyzed data collected during 1993-2008 by 17 state health departments participating in the Agency for Toxic Substances and Disease Registry’s (ATSDR) active chemical incident surveillance program. We conducted descriptive analyses to evaluate whether five chlorine alternatives (calcium hypochlorite, hydrogen peroxide, sodium chlorate, sodium hydrosulfite, and sodium hypochlorite) resulted in less severe incidents. We used chi square and z-score analyses to test significance, where appropriate. Results: During 1993-2008, 2040 incidents involved chlorine, and 1246 incidents involved chlorine alternatives. Nearly 30% of chlorine releases resulted in injured persons, as compared to 13% of chlorine alternatives that resulted in injury. Although similar proportions of persons injured in chlorine or chlorine alternative releases were treated on scene (18% and 14%, respectively) and at a hospital (58% and 60%, respectively), there was a greater proportion of hospital admissions following chlorine releases than there was following releases of chlorine alternatives (10 % vs. 4%) (p < 0.01). There were significantly fewer victims per release for hydrogen peroxide (0.2) than there were for chlorine (1.3) in paper manufacturing (p < 0.01). Conclusion: Exposures to these five potential chlorine alternatives resulted in a lower proportion of exposed persons requiring hospital admission. To reduce acute public health injuries associated with chemical exposures, users should consider a chlorine alternative when such a substitution is reasonable.
1. Introduction
More than 80 million Americans may be at risk from a toxic chemical release because they live near one of the 101 most hazardous chemical facilities in the United States [1]. Additionally, millions more Americans may be at risk because they live near railroads and highways used for transporting hazardous chemicals. Fortunately, techniques exist to protect communities from the risk of a toxic release (Table 1) [2]. Recently, some facilities and transporters have begun implementing hazard reduction and inherently safer technology (IST) to prevent or minimize chemical exposures, accidents, waste, and environmental contamination [3-8]. One approach to hazard reduction is to use less toxic alternatives.
Chlorine has been identified as posing the greatest danger to public health at the 101 most hazardous chemical facilities and along shipping or delivery routes near these facilities [1]. A major chlorine gas spill in an urban area could potentially harm 17,500 people [9]. Chlorine is highly toxic and corrosive. Exposure to chlorine at doses as low as 5 - 15 parts per million (ppm) may cause nose, throat, lung, skin, and eye irritation [10,11].
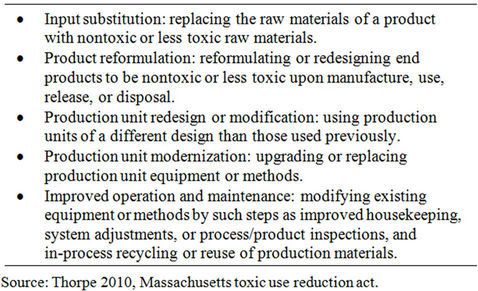
Table 1. Techniques to achieve toxics use reduction.
Breathing chlorine gas at doses of 25 ppm or higher may cause coughing, vomiting, changes in breathing rate, chest pain, dizziness, lung damage, and death.
Chlorine is most frequently (92%) used as a starting material for producing other chlorine-containing compounds, such as polyvinyl chloride (PVC) [12]. Chlorine is also used for water disinfection (4%), as a bleaching agent for paper and pulp (1%), and in the synthesis of numerous other products, such as refrigerants, aerosols, silicones, and pesticides (3%).
Safer chemical alternatives for chlorine are available, depending on the application. For this paper, we are defining “safer” to mean less likely to harm human health and/or the risk of a release is minimized. Less toxic alternatives for water disinfection include sodium hypochlorite and calcium hypochlorite [13-15]. Sodium hydrosulfite and hydrogen peroxide can be used as bleaching aids for paper, and sodium chlorate can be substituted in the copper etching process used to make circuit boards [11,16-18].
Although exposures to chlorine alternatives can produce adverse health effects, those alternatives are considered much safer than chlorine gas because of their physical properties. Hypochlorites are available in liquid and dry forms, and sodium chlorate comes in a liquid solution or as crystalline powder; these forms lessen the risk of a chlorine gas release [13-16,19,20]. Additionally, generating hypochlorites on site eliminates the need to transport chlorine [21].
We used data from 1993 through 2008 from the Agency for Toxic Substances and Disease Registry’s (ATSDR) chemical release surveillance system to compare releases of chlorine to its potential alternatives (“alternatives”). Our purpose was to evaluate whether the alternatives resulted in less severe incidents if releases do occur.
2. Methods
From 1990 through 2009, ATSDR maintained a statebased surveillance system called the Hazardous Substances Emergency Events Surveillance (HSEES) system to capture data on acute toxic chemical releases (both spills and air releases) and their public health consequences. A release was eligible for inclusion in the HSEES system if it was an uncontrolled or illegal spill or an air release of any hazardous substance meeting specific defined criteria [22]. A threatened release was included if it resulted in a public health action, such as an evacuation or a road closure. Releases of only petroleum (e.g., crude oil, gasoline) were excluded from HSEES, as specified in the Comprehensive Environmental Response Compensation and Liability Act [23], also known as the Superfund legislation. In October 2009, ATSDR replaced HSEES with the National Toxic Substance Incidents Program (NTSIP) [24]; NTSIP places a greater emphasis on conducting outreach activities that focus on inherently safer technology.
State health departments reporting to the HSEES system obtained data about chemical releases from various sources, including state and local environmental protection agencies, police and fire departments, poison control centers, hospitals, local media, and federal databases (e.g., the Hazardous Material Incident Reporting Systems [HMIRS] and the US Coast Guard National Response Center [NRC]). Prior to 2001, each state entered data into a system provided by ATSDR and then submitted the records quarterly. Beginning in 2001, states entered their data directly into a secure, Web-based application that enabled ATSDR to access the data immediately. Information collected for HSEES included the location of the release, the industry involved, the types of areas affected, the proximity to vulnerable populations, the chemicals and quantities released, the number of victims, the types and severity of injuries, evacuation details, and contributing factors for each incident. Severity of injury was measured by the level of medical treatment received (e.g., treated at a hospital). We used the 2-digit 2002 North American Industry Classification System (NAICS) to categorize the industries [25].
HSEES data from 1993 through 2008 are included in this analysis. Ten states participated in HSEES during the entire period: Colorado, Iowa, Minnesota, New York, North Carolina, Oregon, Texas, Utah, Washington, and Wisconsin. Seven additional states participated during portions of the period: Alabama (1993-2003), Florida (2005-2008), Louisiana (2001-2008), Michigan (2005- 2008), Missouri (1993-2005), Mississippi (1993-2003), and New Jersey (2000-2005 and 2007). This analysis compared the characteristics of chlorine releases with those involving the following chlorine alternatives: calcium hypochlorite, hydrogen peroxide, sodium chlorate, sodium hypochlorite, and sodium hydrosulfite. We excluded incidents involving multiple chemicals or chemical reactions and focused instead on incidents in which only one chemical was released.
We performed descriptive analysis of HSEES data by using Statistical Analysis System (SAS) version 9.2 [26]. Descriptive statistics presented in this analysis include number of releases, number of injured persons, evacuations, and decontaminations; industry type where release occurred; and medical disposition of injured persons. To determine whether differences between outcomes could be attributed to the quantities of the releases, we examined data on frequency of releases, releases with injured persons, and number of injured persons for chlorine and each alternative by the amount released. We restricted our analysis of quantity released to gallons and pounds because at least 90% of all releases were reported in these units. Chi square and z-score analyses were used to test significance, where appropriate; p-values are provided when tested and statistically significant. The reporting category “unknown” includes missing data and the field entries of “unknown” or “not reported”.
3. Results
From 1993-2008, a total of 2040 single chemical releases of chlorine were reported to HSEES, compared to 1246 single chemical releases involving a chlorine alternative, including 27 threatened releases of chlorine and 21 threatened releases of the alternatives. The number of releases for the alternatives ranged from 31 (sodium hydrosulfite) to 726 (sodium hypochlorite) (Table 2). During this timeframe for all HSEES data, chlorine was the tenth most frequently reported substance when only one chemical was released or threatened to be re leased (“single chemical incidents”) and the fourth most frequently reported substance in single chemical incidents with injured persons. Chlorine incidents represented 2.0% of all HSEES single chemical incidents and 7.3% of all persons injured in single chemical HSEES incidents. The alternatives represented 1.2% of all single chemical HSEES incidents and 1.3% of injured persons. Ratios of injured persons per release involving injured persons and injured persons for all releases were higher for chlorine (respectively, 3.4, 1.0) than for calcium hypochlorite (2.8, 0.6), hydrogen peroxide (3.1, 0.2), sodium chlorate (2.7, 0.2), sodium hydrosulfite (1.5, 0.5), and sodium hypochlorite (2.1, 0.4). We found that the quantity released did not affect these outcomes.
3.1. Industries Where Releases Occurred
The most commonly reported industry category involving chlorine releases (27.6%) was “Manufacturing of paper, printing, chemicals, petroleum, leather, lumber, and stone” (Table 3). Almost 25% of the chlorine releases in this category resulted in victims (Table 4). Within this category, paper manufacturing was involved in 32.3% of the chlorine releases, resulting in 122 injured persons (5.9% of all injured persons in chlorine releases). Compared to chlorine releases in paper manufacturing, hydrogen peroxide had fewer injured persons per release with injured persons and fewer injured persons for all releases: chlorine had 3.9 and 1.3, respectively, and hydrogen peroxide had 2.0 and 0.2, respectively. Hydrogen peroxide had significantly lower proportions of injured persons for all releases than did chlorine (p < 0.01). Additionally, there were no victims in sodium hydrosulfite releases in paper manufacturing.
“Utilities” was the second most commonly reported industry category involved in chlorine releases (24.0%). One alternative, sodium hypochlorite, had a high frequency of releases in the utilities industry (28.1%). Within this category, water and sewage (“water utilities”) accounted for 64.0% of the chlorine releases and resulted in 120 injured persons (5.8% of all injured persons in chlorine releases). Although calcium hypochlorite had a slightly higher ratio of injured persons for water utility releases with injury (2.0) compared to chlorine (1.8), it had a lower ratio of injured persons for all water utility releases (0.2) than chlorine (0.4). In contrast, sodium hypochlorite had a higher ratio of injured persons for all water utility releases (0.9) than chlorine (0.4) and a lower ratio of injured persons for all water utilities releases with injury (1.1) than chlorine (1.8).
3.2. Injured Persons
Chlorine releases resulted in a total of 2052 injured persons, as compared to 358 for chlorine alternatives. Chlorine releases resulted in more injured persons per release with injured persons than did all alternatives com bined (respectively, 3.4 vs. 2.3). The majority of persons injured by chlorine or the alternatives were treated at the
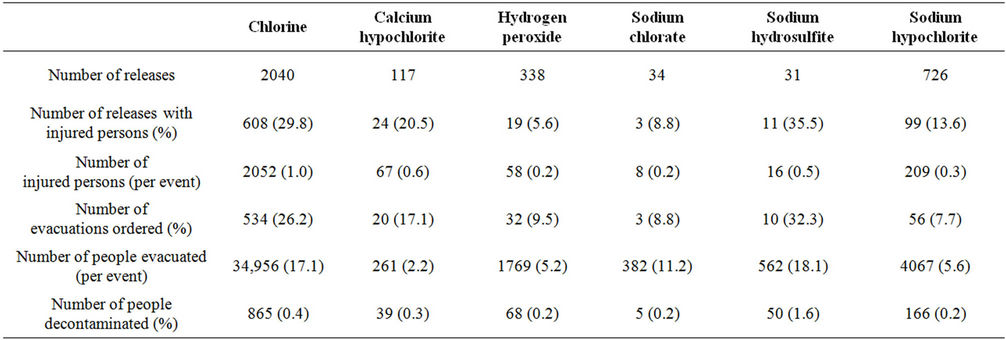
Table 2. Summary of chlorine and chlorine alternative releases, ATSDR chemical surveillance data, 1993-2008.
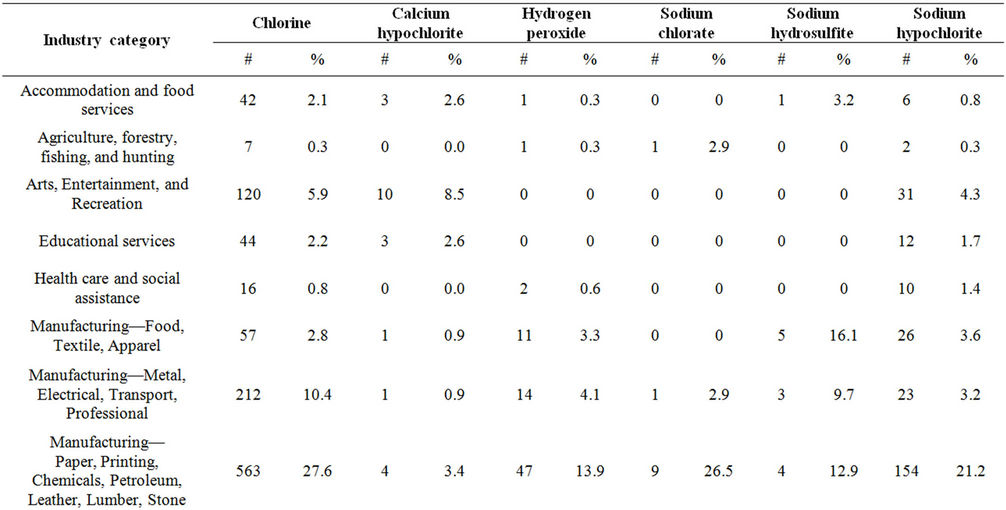
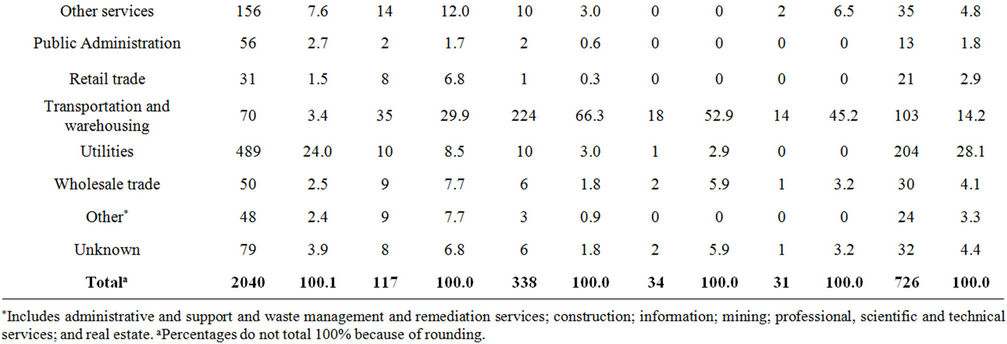
Table 3. Frequency of industries involved in chlorine and chlorine alternative releases, ATSDR chemical surveillance data, 1993-2008.
hospital but not admitted (Table 5). Chlorine releases also had a higher percentage of injured persons who were admitted to a hospital than did the alternatives (9.5% vs. 4.2%) (p < 0.01).
The most frequently reported injury for chlorine and each individual alternative was respiratory irritation. Chlorine had a higher frequency of respiratory irritation than all alternatives except for calcium hypochlorite. Respiratory and eye irritation accounted for over 60% of all injuries reported by persons injured in releases of chlorine, calcium hypochlorite, sodium chlorate, and sodium hypochlorite. Calcium hypochlorite and sodium hypochlorite were more likely to cause chemically related burns than chlorine (6.3%, 11.9%, and 1.1%, respectively). Hydrogen peroxide resulted in a higher proportion of reports of gastrointestinal problems and headaches (12.2% each) than chlorine (8.1% and 3.1%, respectively).
3.3. Transportation
There were 543 transportation-related releases involving chlorine or its alternatives; 100 involved chlorine and 443 involved chlorine alternatives. Sixty percent of the chlorine releases occurred during ground transportation, and 37.0% occurred during rail transportation. For releases of chlorine alternatives, ground transportation accounted for a much higher percentage (88.7%) and rail accounted for a much lower percentage (9.4%). Of these 543 transportation-related incidents, 62 (11.4%) releases resulted in injuries to 164 victims, with a maximum of 67 victims in one incident. For transportation-related releases involving chlorine, 23 (23.0% of all chlorine transportation-related releases) involved injuries to 113 injured persons. For the alternatives to chlorine, 39 (8.8% of all transportation-related releases among the
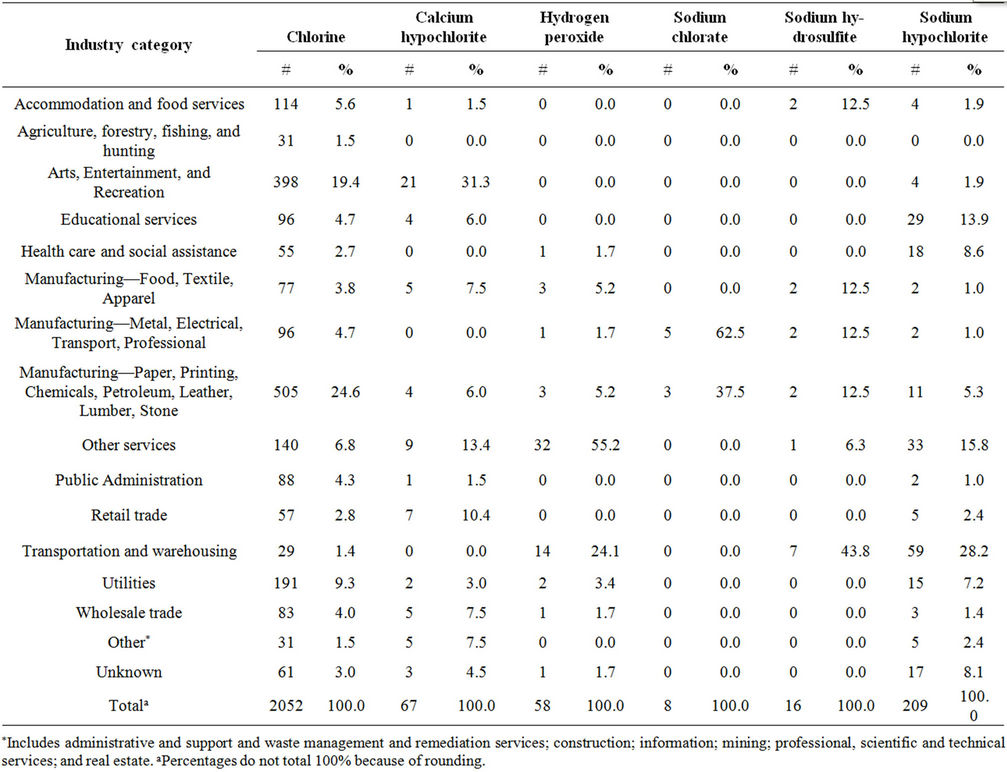
Table 4. Frequency of injured persons in chlorine and chlorine alternative releases by industry, ATSDR chemical surveillance data, 1993-2008.
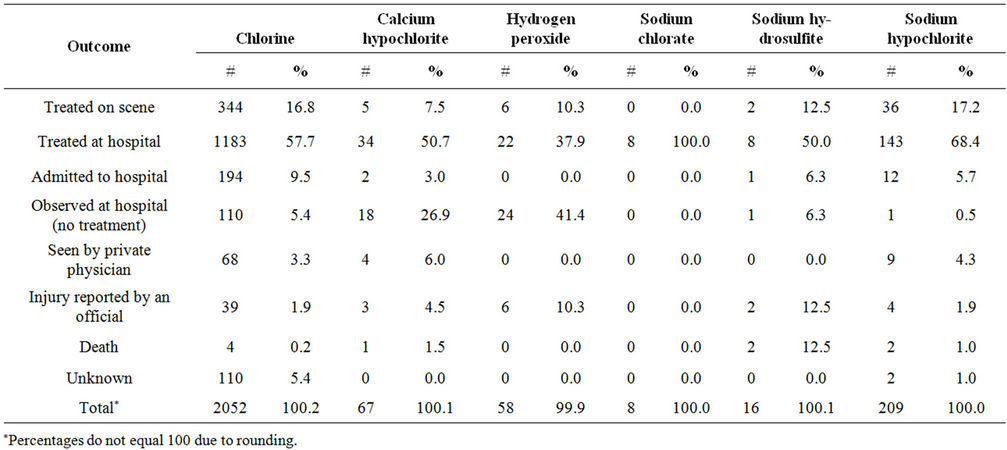
Table 5. Severity of injured persons in chlorine and chlorine alternative releases, ATSDR chemical surveillance data, 1993-2008.
alternatives) resulted in 51 injured persons.
A review of the 62 transportation-related releases with injuries showed that injuries were reported as chemical-related in 46 (74.2%) releases involving injury to 140 people; there was also one fatality due to non-chemical related trauma in one of these 46 releases. These incidents were nearly equal in the number involving chlorine (20, 43.5%) or the alternatives (26, 56.5%). A higher percentage of persons injured in transportation-related chlorine releases were admitted to a hospital than were persons injured by chlorine alternatives (4.7% and 2.9%, respectively). Medical disposition was unknown for one person injured in a chlorine release. Of the six releases with three or more injured persons, five involved chlorine and one involved an alternative (hydrogen peroxide).
3.4. Evacuations and Decontaminations
Evacuations were more likely to be ordered for chlorine (26.2%) releases than for releases involving calcium hypochlorite (17.1%), hydrogen peroxide (9.5%), sodium chlorate (8.8%), or sodium hypochlorite (7.7%). More people were evacuated or decontaminated per incident for chlorine releases (17.1, 0.42) than for calcium hypochlorite (2.2, 0.33), hydrogen peroxide (5.2, 0.20), sodium chlorate (11.2, 0.14), and sodium hypochlorite (5.6, 0.22).
4. Discussion
Toxics use reduction (Table 1) is an important strategy in lessening environmental pollution and in protecting human health. One aspect of toxics use reduction is to identify chemical alternatives and assess their value by using information from many categories, including human health [4]. HSEES data on releases of toxic substances, including their frequency and public health consequences, provide a unique information source for the evaluation of whether discernible reductions in injury frequency and injury outcome occur when chemical alternatives are used in specific applications.
In this analysis, fewer people were likely to be injured per release involving chlorine alternatives than per release of chlorine, and injuries were likely to be less severe following exposure to a chlorine alternative than in exposure to chlorine. Furthermore, injuries from chlorine releases resulted in more severe medical dispositions, as indicated by the higher percentage of injured persons who were admitted to the hospital following chlorine exposure than for any alternative. No injured persons were admitted to a hospital as a result of hydrogen peroxide or sodium chlorate releases. Additionally, fewer people were evacuated and decontaminated per release for all of the chlorine alternatives (except for sodium hydrosulfite) than for chlorine releases.
Calcium hypochlorite and sodium hypochlorite are viable alternatives to chlorine for wastewater disinfection, and hydrogen peroxide is a viable alternative to chlorine for bleaching paper [13,15,17,18]. For water utilities, calcium hypochlorite had a lower ratio of injured persons per release, and sodium hypochlorite had a lower ratio of injured persons per release with injured persons than did chlorine. Over 550 water treatment facilities have converted to safer alternatives to chlorine gas; about 175 have switched to using sodium hypochlorite [27]. However, more than 2500 water facilities still use large amounts of chlorine gas. At some of these facilities, substituting a chlorine alternative may be reasonable. The cost of a conversion is often a barrier to switching to an alternative method of water disinfection [21]. Facilities can use the National Association of Clean Water Agencies (NACWA) Chlorine Gas Decision Tool for Water and Wastewater Utilities to assess the benefits and limitations of alternatives to chlorine gas disinfection [28].
There were significantly fewer victims per release for hydrogen peroxide than for chlorine in paper manufacturing. In 2007, 16 pulp and paper mills filed Risk Management Plans (RMP) with the US Environmental Protection Agency (EPA) for collectively storing almost 4 million pounds of chlorine [29]. Switching these facilities to hydrogen peroxide would lessen the risk to over 2.5 million people. Additionally, an oxygenor ozonebased process can also be used to bleach paper, and ultraviolet (UV) radiation and ozone can be used to disinfect wastewater [1,11,18,29,30]. Although it would still be necessary to maintain a chlorine residual in the water, much less chlorine would be needed after the disinfection step is accomplished by ozone or UV radiation.
Although switching to safer chemical alternatives or processes may require an upfront investment, long-term savings can be achieved by lowering costs associated with pollution control, workplace safety requirements, emergency response, employee training, security, safety equipment, and lower insurance premiums [1,14,29]. We are unaware of any chemical alternative to using chlorine to make PVC. Since production of PVC is one of the biggest uses of chlorine, other alternatives to PVC should be explored. These alternatives include concrete, vitrified clay, steel, cast iron, and ductile iron for pipes and ducts [31,32]. The Center for Health, Environment and Justice produced a guide on PVC-free office supplies and building materials [33]. Using a PVC-alternative would lessen the amount of dioxins and furans that are released into the environment as result of burning chlorine-containing products in incinerators [11].
About 20% of transportation-related incidents involving chlorine resulted in chemically related injuries, as compared to only 6% of incidents that involved chemical alternatives to chlorine. The injuries were more severe in the chlorine incidents, as indicated by a higher percentage of persons injured in chlorine incidents requiring admission to a hospital. Thus, transportation-related releases involving chlorine alternatives led to outcomes with fewer injured persons and less severe injuries. Additionally, facilities that generate sodium hypochlorite on site reduce the need to transport chlorine and eliminate transportation injuries associated with any chemical for this application [21].
5. Limitations
The HSEES system was useful for collecting data regarding acute chemical releases and their associated public health impacts. However, there were limitations inherent in the system. The HSEES system collected data in only 17 states during 1993-2008, so the results may not be representative of the entire United States. However, HSEES was the only federal hazardous substances release database designed specifically to assess and record the public health consequences of acute chemical releases that existed during the 1993-2008 time period. Some of the results presented are based on small numbers of incidents and, therefore, may not be a stable estimate. The limited power of the small number of incidents also may have contributed to the lack of statistical significance observed for some results. In addition, incidents that produced chlorine as a reaction may have been inadvertently included in this analysis because of misreporting. Finally, this analysis did not consider the technical requirements necessary for a chemical substitution in the examination of the chemical alternatives.
6. Conclusion
In this analysis, exposures to chemical alternatives to chlorine resulted in a lower proportion of exposed persons who required hospital admission compared to chlorine exposures. Additionally, several of the chemical alternatives resulted in evacuation or decontamination of fewer people. The data presented support the expectation that there is a decreased impact on human health from exposure to chemical alternatives to chlorine as compared to chlorine, on the basis of the physical properties and on the potential health effects of these chemicals. Although the incidents analyzed involved many varied scenarios, together they suggest that overall these five chlorine alternatives result in fewer and less severe injuries and that they should be considered if process requirements and economic conditions allow. The benefits of using a non-chemical alternative should be carefully weighed as well.
7. Acknowledgements
The authors would like to thank Jennifer McNew from the North Carolina Department of Health and Human Services for her helpful suggestions and comments on this manuscript. The authors would also like to thank Frank Bove and Maureen Orr of the Agency for Toxic Substances and Disease Registry for their statistical and technical advice on this manuscript.
REFERENCES
- P. Orum, Center for American Progress, “Chemical Security 101,” 2008. http://www.americanprogress.org/issues/2008/11/pdf/chemical_security.pdf
- B. Thorpe, “How the Toxics Use Reduction Act Continues to Promote Clean Production Internationally,” Journal of Cleaner Production, Vol. 19, No. 5, 2011, pp. 552- 558. doi:10.1016/j.jclepro.2010.07.016
- American Chemistry Council, “Responsible Care Fact Sheet,” 2011. http://responsiblecare.americanchemistry.com/FactSheet
- P. Eliason and G. Morose, “Safer Alternatives Assessment: The Massachusetts Process as a Model for State Governments,” Journal of Cleaner Production, Vol. 19, No. 5, 2011, pp. 517-526. doi:10.1016/j.jclepro.2010.05.011
- F. Granek, “Business Value of Toxics Reduction and Pollution Prevention Planning,” Journal of Cleaner Production, Vol. 19, No. 5, 2011, pp. 559-560. doi:10.1016/j.jclepro.2010.09.012
- E. T. Lavoie, L. G. Heine, H. Holder, M. S. Rossi, R. E. Lee, E. A. Connor, M. A. Vrabel, D. M. DiFiore and C. L. Davies, “Chemical Alternatives Assessment: Enabling Substitution to Safer Chemicals,” Environmental Science & Technology, Vol. 44, No. 24, 2010, pp. 9244-9249. doi:10.1021/es1015789
- G. Morose, S. Shina and R. Farrell, “Supply chain Collaboration to Achieve Toxic Use Reduction,” Journal of Cleaner Production, Vol. 19, No. 5, 2011, pp. 397-407. doi:10.1016/j.jclepro.2010.04.004
- J. Onasch, P. Shoemaker, H. M. Nguyen and C. Roelofs, “Helping Small Businesses Implement Toxics Use Reduction Techniques: Dry Cleaners, Auto Shops, and Floor Finishers Assisted in Creating Safer and Healthier Workplaces,” Journal of Cleaner Production, Vol. 19, No. 5, 2011, pp. 408-413.
- Homeland Security Council and Department of Homeland Security, “National Planning Scenario 8: Chemical Attack—Chlorine Tank Explosion,” 2005.
- C. Winder, “The Toxicology of Chlorine,” Environmental Research, Vol. 85, No. 2, 2001, pp. 105-114. doi:10.1006/enrs.2000.4110
- Toxic Use Reduction Institute (TURI), “Massachusetts Chemical Fact Sheet Chlorine”. http://www.turi.org/About/Library/TURI-Publications/Masschusetts_Chemical_Fact_Sheets/Chlorine_Fact_Sheet/Printable_Chlorine_Fact_Sheet
- The Comprehensive Microbial Resource, “Chemical Profile: Chlorine,” Chemical Market Reporter, 2006.
- L. Ainsworth and J. Hampton, “A safe option for Disinfection: On-Site Sodium Hypochlorite Generation,” Water Engineering & Management, Vol. 144, No. 12, 1997, pp. 25-27.
- D. J. Applegate, “Creating Safer Work and Community Environments: Gaseous Chlorine to Liquid Bleach Conversions,” Water Engineering & Management, Vol. 145, No. 2, 1998, pp. 33-35.
- A. Garibi and L. A. Kazanowski, “On-Site Hypochlorite Generation,” Pollution Engineering, Vol. 38, No. 6, 2006, pp. 32-35.
- P. Orum, Preventing Center for American Progress, “Chemical Toxic Terrorism,” 2006. http://www.americanprogress.org/issues/2006/04/b681085_ct2556757.html/chem_survey.pdf
- Center for Health, Environment & Justice (CHEJ), “PVC Factsheet. CHEJ’s Guide to PVC-Free School Office Supplies and Building Materials”. http://www.chej.org/wp-content/uploads/Documents/PVC%20Alternatives%20Guide.pdf
- T. J. McDonough, “Bleaching Agents—Pulp and Paper Industry,” The 4th Edition of the Kirk-Othmer Encyclopedia of Chemical Technology, The Institute of Paper Science and Technology, 1991. http://smartech.gatech.edu/jspui/bitstream/1853/2461/1/tps-394.pdf
- B. Sudha, H. Veeramani, et al., “Bleaching of Bagasse Pulp with Enzyme Pre-Treatment,” Water Science and Technology, Vol. 47, No. 10, 2003, pp. 163-168.
- Black & Veatch, “White’s Handbook of Chlorination and Alternative Disinfectants,” John Wiley and Sons, Hoboken, 2010.
- Testimony of George S. Hawkins, 2011. http://homeland.house.gov/sites/homeland.house.gov/files/Testimony%20Hawkins_0.pdf
- Michigan Department of Environmental Quality, Report on Gaseous Chlorine Reduction Initiative in Michigan, 2008.
- Agency for Toxic Substances and Disease Registry (ATSDR), “HSEES Biennial Report 2007-2008,” 2009. http://www.atsdr.cdc.gov/HS/hsees/annual2008.html
- Comprehensive Environmental Response, Compensation, and Liability Act of 1980, Pub. L. No. 95510 (Dec. 11, 1980), as Amended by the Superfund Amendments and Reauthorization Act of 1986, Pub. L. No. 99499 (Oct. 17, 1986), 42 U.S.C. 9604(i).
- M. A. Duncan and M. F. Orr, “Evolving with the Times, the New National Toxic Substance Incidents Program,” Journal of Medical Toxicology, Vol. 6, No. 4, 2010, pp. 461-463. doi:10.1007/s13181-010-0114-6
- United States Census Bureau, “North American Industry Classification System,” 2004. http://www.census.gov/epcd/naics02/
- SAS Institute Inc., “SAS® 9.2 Enhanced Logging Facilities,” Cary, 2008.
- R. Rushing and P. Orum, Center for American Progress, “Leading Water Utilities Secure Their Chemicals,” 2010. http://www.americanprogress.org/issues/2010/03/chemical_security.html
- National Association of Clean Water Agencies (NACWA), “Chlorine Gas Decision Tool for Water and Wastewater Utilities,” 2006. http://www.nacwa.org/index.php?option=com_content&view=article&id=420%3A2006-chlorine-gas-decision-tool&catid=8%3Apublications&Itemid=7
- A. Fidis, “Pulp Fiction—Chemical Hazard Reduction at Pulp and Paper Mills,” US PIRG Education Fund, 2007. http://cdn.publicinterestnetwork.org/assets/uxkSaZ7QHw1AYimdulFRZg/PulpFictionFinalU.S.PIRG.pdf
- T. K. Das, “Evaluating the Life Cycle Environmental Performance of Chlorine Disinfection and Ultraviolet Technologies,” Clean Technologies and Environmental Policy, Vol. 4, No. 1, 2002, pp. 32-43. doi:10.1007/s10098-002-0139-x
- Greenpeace, “Building a PVC Free Future”. http://archive.greenpeace.org/toxics/reports/cfap/cfapm3.html
- Healthy Building Network, “PVC Free Materials List”. http://www.healthybuilding.net/pvc/PVCFreeAlts.html
NOTES
*Corresponding author.