Journal of Environmental Protection
Vol. 3 No. 10 (2012) , Article ID: 23820 , 11 pages DOI:10.4236/jep.2012.310145
The Effects of Sample Matrices on Immunoassays to Detect Microcystin-LR in Water
![]()
1Office of Research and Development, The US Environmental Protection Agency, Cincinnati, USA; 2School of Energy, Environmental, Biological, and Medical Engineering, University of Cincinnati, Cincinnati, USA.
Email: *delacruz.armah@epa.gov
Received April 26th, 2012; revised May 27th, 2012; accepted July 6th, 2012
Keywords: Microcystin; Immunoassay; Sample Matrix; Natural Organic Matter
ABSTRACT
Immunoassays are widely used biochemical techniques to detect microcystins in environmental samples. The use of immunoassays for the detection of microcystins is vulnerable to matrix components and other interferents. This study is an evaluation of the effects of interfering substances commonly found in drinking and ambient water samples using commercially-available immunoassay kits for microcystin toxins. The microplate and strip test immunoassay formats were tested in the study. For the microplate ELISA, the following were found to inhibit microcystin-LR (MC-LR) detection: 250 μg/mL Ca2+ or Mg2+, 0.01% ascorbic acid, 0.1% EDTA chelating agent, 0.05 M glycine-HCl, pH 3. The following exhibited no effect: sodium chloride (NaCl, 1% to 4%) and sodium thiosulfate (0.001% and 0.01%), 0.01 to 0.1 M phosphate buffers (PB), pH 7 and 0.067 M PB at pH 5, 6, 7 and 8. Overall, up to 50 μg/mL of standard and reference natural organic matter (NOM) from various sources did not interfere in the assay system (without MC-LR) but diminished the detection of MC-LR at varying degrees. This is the first study evaluating standard and reference humic and fulvic acids from various sources in immunoassays for microcystins. The strip test also showed variable effects on MC-LR detection in the presence of NOM. This assay format was also sensitive to varying pHs and ionic strengths. MC-LR binding was inhibited at low pH (0.05 M glycine-HCl, pH 3), whereas, 0.067 M PB with pH 6, 7 and 8 can yield false positive results. Lower ionic strength of 0.01 M PB, pH 7 showed no interference in MC-LR binding whereas higher ionic strengths can interfere with MC-LR detection. NaCl at 3% and 4% can interfere with the analysis giving false positive results. Mg2+ at 50 and 250 μg/mL showed no effect on the analysis while the same concentration of Ca2+ can yield false positive results. The performance in marine, brackish and hard waters should be tested given the potential sensitivity to salinity. Results of this study may assist in the further refinement of existing assays and the development of practical antibody-based methods to clean-up samples and detect cyanotoxins in water.
1. Introduction
One of the most pressing issues facing the world today is providing adequate supply and quality of water to meet the demand of increasing human population. Frequent occurrences of toxic cyanobacteria in surface waters and reservoirs pose a challenge in the production of safe drinking water [1]. Cyanobacterial harmful algal blooms (CHABs) are of major concern worldwide due to the production of vast array of secondary metabolites with diverse bioactivities which may pose health risks to humans primarily via untreated or inadequately treated drinking water [2]. Some of these metabolites bioaccumulate throughout the aquatic food webs and can be vectored into terrestrial biota including humans [3].
CHABs are becoming more common resulting in more cases of acute poisoning and increasing concern over the long-term exposure to cyanobacterial toxins or cyanotoxins [4-6]. A number of species of cyanobacteria produce toxins that have been linked to animal and human illness and death worldwide. Cyanobacterial toxins are often classified as hepatotoxins, cytotoxins, dermatotoxins and neurotoxins. A single species of toxic cyanobacterium can produce over a dozen toxins in a single culture [7]. Microcystin-LR (MC-LR), a hepatotoxin from a group of microcystins (cyanotoxins), is the most toxic and frequently occurring variant.
Immediate knowledge of the presence of these toxins in bodies of water (source, drinking water, aquaculture, recreational) is important so remedial measures can be instituted immediately to prevent human exposure. A variety of technologies have been developed for both laboratory and field detection and quantification of cyanotoxins that include several chromatographic techniques as well as biological and immunochemical assays. Conventional methods like HPLC with photodiode array (PDA) and mass spectrometry (MS) detections are expensive to perform, require highly technical skills and may need extraction/preconcentration step to reach minimum detection limits. The HPLC with PDA or MS detection methods are able to identify some cyanotoxin variants but it is impossible to identify all variants due to unavailability of variants (>80 for microcystin) and their analogues as standards.
Immunoassay-based tests are very popular for analyzing toxins in water. Immunoassays are widely used biochemical techniques based on the specificity of antibody-antigen interactions and are used in various formats (e.g., microplate, tube, dipstick) designed for clinical, agricultural, and environmental applications. They can be configured as qualitative (simple positive or negative test) or quantitative tests. Immunoassays have gained popularity because it is easy to perform, do not require a skilled technician, can be field-portable, inexpensive and may not require special storage conditions. The major disadvantages of immunoassays are that the antibody may be moderately or non-selective to the target and be predispose to interference to matrices and other components in the sample [8]. Needless to say, immunoassays are an established and accepted diagnostic tool in clinical and non-clinical settings. Its field portability, ease of use and low cost make it an attractive test especially in less developed areas of the world.
Previous studies with microcystin immunoassays have shown that assay kits using ground and surface waters were limited by matrix effect, detection of both inactive and active microcystins and nodularins, and detection of toxic and nontoxic microcystin variants [9]. Despite their disadvantages, immunoassays for microcystins can drastically reduce the number of samples that require further confirmation in the laboratory by more expensive but more specific LC/MS methods [9]. Furthermore, immunoassays can rapidly detect toxins without pretreatment in the field. Newer kits are available with improved reagents that may circumvent the shortcomings of earlier test kits.
The main objective of this study was to evaluate the parameters and the effects of interfering substances in water using immunoassay kits for microcystin toxins in drinking and ambient waters. Sample matrix components such as cations, natural organic matter (NOM), oxidants, chelating agent, and salt were evaluated. In addition, the effects of additives used in the analysis were also tested such as sodium thiosulfate, ascorbic acid, EDTA, various pHs and ionic strengths were also determined. Results in this study may assist in the further refinement of existing assays and the development of practical antibody-based methods to clean-up samples and detect cyanotoxins in water.
2. Experimental and Methods
2.1. Safety
All experiments involving MC-LR were performed in a biological safety cabinet (Advance SterilGARD III, The Baker Company, Sanford, ME, USA) and all supplies that came in contact with the toxin were treated with 10% bleach for at least 20 min prior to autoclaving.
2.2. Materials and Methods
The main goal of this study was to evaluate two different formats of commercially available immunoassay kits to detect MC-LR, the most toxic hepatotoxin from a group of microcystins in CHAB. The new strip (or dipstick; Abraxiskits, Warminster, PA, USA) test and the microplate assays (EnviroLogix, Inc., ME, USA) for microcystins are both competitive inhibition formats and were performed according to the manufacturers’ procedures. Both assays are qualitative and may be quantitative when appropriate standard microcystin controls are included. All incubations were performed using a shaker incubator (200 rpm, Innova 4080, New Brunswick Scientific, Edison, New Jersey, USA) at 25˚C. Briefly, for microplate assay, test samples or controls are first added to allow binding to anti-microcystin antibodies on the wells. After incubation, microcystin-enzyme conjugate was added, re-incubated, washed and then the substrate added. The enzymatic reaction was stopped, incubated for 10 min, air bubbles eliminated and then read at 450 nm (650 nm for turbidity blank control) using Spectramax M2 spectrophotometer (Molecular Devices, Sunnyvale, CA, USA). All samples were analyzed in triplicate except the kit negative control and MC-LR standard in Advantage A10 Milli-Q water (MQ-H2O, Millipore Corp., Billerica, MA, USA) in six replicates (three each loaded first and last on the 96-well plate). For water samples, a decrease in the optical density in the microplate test well compared to the negative control indicates the presence of microcystins in the water sample.
The dipstick test was developed as a preliminary qualitative screening of microcystins and nodularin in surface and finished water. For surface (raw) water, a lysis step was performed first to release intracellular cyanotoxins such that intracellular and soluble cyanotoxins already in the water are detected. Briefly, water sample or controls were first incubated with the chromogenic labeled anti-microcystin complex then a strip was dipped vertically in the sample whereby the sample moved upward by capillary movement. On the strip, microcystin conjugate was imprinted horizontally where the colored labeled anti-microcystin complex can bind forming a distinct line. If microcystins (and/or nodularin) are present in the sample, the colored line intensity is diminished. A control line is always included in each strip which is not affected by the presence of microcystins in the sample. The presence of the upper control band validates the assay system and the lower band is the test line. A negative test result shows both lines of similar intensity. If the test line has no visible line or less intensity than the control line, the test is positive for microcystin. Imprinted toxin on the strip competes with the toxins in the test sample thereby preventing or lessening the development of the colored test line. Control samples spiked with MC-LR may be used to approximate the quantity of the toxin in the test sample.
Quality control samples were included as part of the test matrix to ensure the integrity of the test. Stocks of potential inhibitory compounds were prepared separately in MQ-H2O. A single lot of purified MC-LR (Calbiochem, San Diego, CA, USA) with 98% purity (by HPLC) was used in the study. MC-LR stock solution at 500 μg/ mL was dissolved in methanol (MeOH), stored at –20˚C, and used within three months. Freshly dissolved MC-LR in MeOH was stored overnight prior to use. Samples were prepared fresh using these stock solutions and analyzed on the same day in every microplate and strip test analyses. In the microplate format, kit controls and MQH2O spiked with 0, 0.05, 0.2, 0.5, 0.75, and 0.83 ng/mL MC-LR were analyzed to determine the recovery of MC-LR. The method detection limit (MDL) was determined by fortifying negative surface water sample with 0.1 and 0.2 ng/mL MC-LR and assayed in eight replicates. For the strip test only 0, 0.5, 1.0, and 2.5 ng/mL in MQ-H2O were performed as controls. The effects of water matrices were analyzed twice using the strip test.
2.3. Assay Interferents and Conditions Evaluated
Some of the most common potential interferents in water samples are calcium (Ca), magnesium (Mg), humic acid, and fulvic acid. The upper level of Ca2+ and Mg2+ in drinking water is 250 μg/mL and the mid-low range is 50 μg/mL [10]. For total humic and fulvic acids, the final concentrations were from 1 up to 50 μg/mL. Various standard and reference fulvic and humic acids were obtained from the International Humic Substances Society (University of Minnesota, St. Paul, Minnesota, USA). The following were evaluated in this study: Suwannee River fulvic acid (SRFA), Suwannee River humic acid (SRHA), Nordic Aquatic fulvic acid (NAFA), Elliot Soil fulvic acid (ESFA), Florida Pahokee peat fulvic acid (FPPFA), Waskish peat fulvic acid (WPFA) and Waskish peat humic acid (WPHA). Solutions were prepared in MQ-H2O, sonicated for 1 hr (FS30, Fisher Scientific, Waltman, MA, USA) and then filtered in 0.45 μm glass fiber filter (Acrodisc GHP, Pall Corporation, East Hills, NY, USA). Humic and fulvic acids stock solutions were stored in amber glass bottles at 4˚C.
Other interferents evaluated were NaCl (1% - 4%), Ethylene Diamine Tetraacetoacetate (EDTA) disodium salt dihydrate (C10H14N2O8Na2·2H2O; 0.01% and 0.1%), ascorbic acid (0.01% & 0.001%), and sodium thiosulfate (0.001%, 0.01% and 0.1%). The concentrations selected here were the levels that can be found in the environment and used in water treatment [11]. Phosphate Buffers (PB), pH 7 at different ionic strengths (0.01, 0.05, 0.067, and 0.1 M) and 0.067 M PB at pH 5, 6, 7, and 8 were also tested. For pH 3, 0.05 M glycine-HCl was used. All chemicals were reagent grade or better and were purchased from Sigma-Aldrich (St. Louis, MO, USA).
2.4. Sample Collection and Processing
Environmental water samples were collected in amber glass bottles with Teflon-coated screw caps and transported on icepacks. Sample bottles were labeled with self-adhesive labels which included reference code, date and time of sampling, location of sampling point, type of water sampled, and the name of the sampler. A “hand dip” sampling method was used for surface waters. To sample tap and reversed osmosis waters, the line was flushed for about 1 min prior to sample collection. Water samples during bloom events were collected from a water treatment plant facility in Ohio and surface waters from Ohio, California, and Florida, USA. The sample bottle was filled leaving a small air gap. Once samples were collected, samples were kept on icepacks in cool boxes for transport to the laboratory. When samples were not analyzed immediately, samples were stored at 2˚C - 8˚C in the dark. Samples were analyzed within five days of collection. For ELISA analyses, samples were freezethawed three times (–20˚C and tap water). In the strip test analysis, samples were chemically disrupted. Freeze-thaw process and chemical disruption method showed no difference in this and other studies [12].
2.5. Water Quality Parameters
Water quality parameters (turbidity, TOC, pH, conductivity) were measured to determine their effects on the analysis. The conductivity was measured using a handheld YSI 30 salinity, conductivity and temperature system (YSI Inc., Yellow Springs, OH, USA). The total organic carbon (TOC) was analyzed using an automated Shimadzu TOC-V CSH/CSN analyzer. The pH was estimated using pH paper strip (Whatman Type CS, and EM ColorpHast Indicator strips) and turbidity was determined using a portable Orbeco-Hellige turbidimeter model 966 (Orbeco Analytical Systems, Inc., Farmingdale, NY, USA).
2.6. Statistical Analyses
Statistical analyses such as t-test, analysis of variance (ANOVA) and correlation coefficient (r2) were performed using Excel and S-Plus 2000 software. Analyses were undertaken to determine differences between the controls and treated samples (p < 0.05 was considered as a statistically significant difference). The method detection limit, MDL = t(n−1,1−α = 0.99)*(s) where t(n−1,1−α = 0.99) = the student’s t value appropriate for a 99% confidence level and a standard deviation estimate with n − 1 degrees of freedom and s = standard deviation of the replicate analyses. In t-test, a probability (p) value less than 0.05 indicate the two sets of data are different. The MDL was calculated from the standard deviation of the determined concentrations and the method quantitation limit was three times the MDL. The relative binding of MC-LR was normalized based on the negative control where B was the optical density at 450 nm of the test sample divided by Bo, the optical density of the negative control.
3. Results and Discussion
3.1. ELISA Controls
The microplate ELISA kit and the MC-LR standard controls showed correlation of >96% (r2 value) and recovery rate of >95% (Figure 1). The recovery rates were determined by spiking MQ-H2O with the same amounts of microcystin in the kit vials and standard MC-LR in every analysis. The minor discrepancy in the recovery rate is

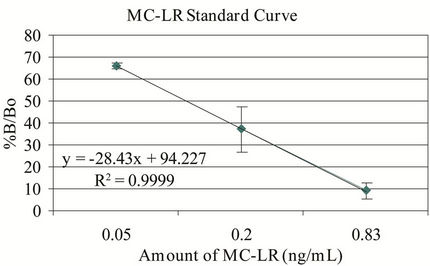
Figure 1. Microplate ELISA kit and MC-LR standard curves. %B/Bo = mean optical density of test sample ÷ mean optical density of negative control × 100; n = 3 - 6.
most likely due to the variability in the kit’s response to various variants of microcystins. Numerous congeners (>80) of microcystins can display variable affinity to the antibody used in this system [13]. The kit controls were within the expected %B/Bo ranges (B = binding of test or kit control samples and Bo = binding of negative control). The intervariability (n = 5) using 0.5 ng/mL MC-LR in MQ-H2O ranges from 3.14% - 10.7% CV with mean = 5.97 and for 0.75 ng/mL MC-LR, the %CV ranges from 2.21 - 12.47 with mean = 8.11. For intravariability with nine replicates of six different treatments, the %CV ranges from 2.17 - 6.30 with a mean of 4.40. The MDL was 0.18 ng/mL and 0.14 ng/mL for the standard and sensitive assay formats, respectively, which were close to the expected values.
3.2. Effects of Various Water Components on ELISA to Detect MC-LR
As previously mentioned, various immunodetection and separation methods can be hampered by other constituents present with the target analyte(s). The utility of a detection method depends on its ability to detect the target analyte with specificity and sensitivity while circumventing matrix effects that may be present in water samples. Interference can either yield false increases or decreases in the actual levels of target analyte. Table 1 shows the effects of common constituents or conditions in water sample for MC-LR detection by immunoassay. Sodium thiosulfate and ascorbic acid are commonly used to de-chlorinate drinking water; only the latter inhibited toxin detection at 0.01%. EDTA, a persistent pollutant in the environment used worldwide at home and in the industry, is a commonly used chelating agent [14]. There was a significant inhibition in presence of EDTA in the sample when 0.75 ng/mL MC-LR was used. The presence of high concentrations of Mg2+ or Ca2+ can also interfere with MC-LR detection by ELISA. In 250 μg/ mL Ca2+, the detection of 0.75 ng/mL MC-LR was inhibited by 15% (range 13% - 18%) and 250 μg/mL Mg2+ diminished the detection of 0.5 ng/mL MC-LR by 39% (range 29% - 48%) and in 0.75 ng/mL MC-LR by 52% (43% - 64%). Sodium chloride and PBs with varying ionic strengths had no effect on the assay (no added MCLR) and MC-LR detection which suggests that the microplate immunoassay can be used with marine and brackish water samples. PBs with pH 5, 6, 7, and 8 had no effect on the assay system and MC-LR detection. Only glycine-HCl, pH 3 showed interference in MC-LR detection at both levels. The detection of 0.5 ng/mL MC-LR was reduced by 42% (range 27% - 44%) and 0.75 ng/mL MC-LR by 66% (range 57% - 75%).
3.3. Natural Organic Matter
Humic substances, also known as natural organic matter
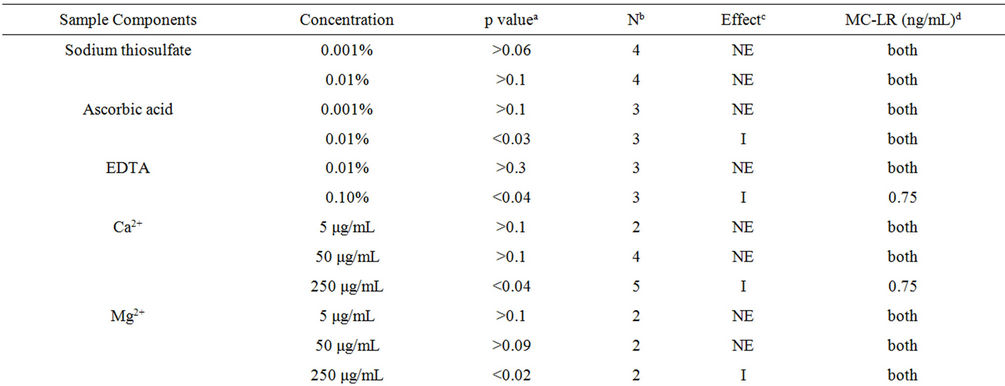
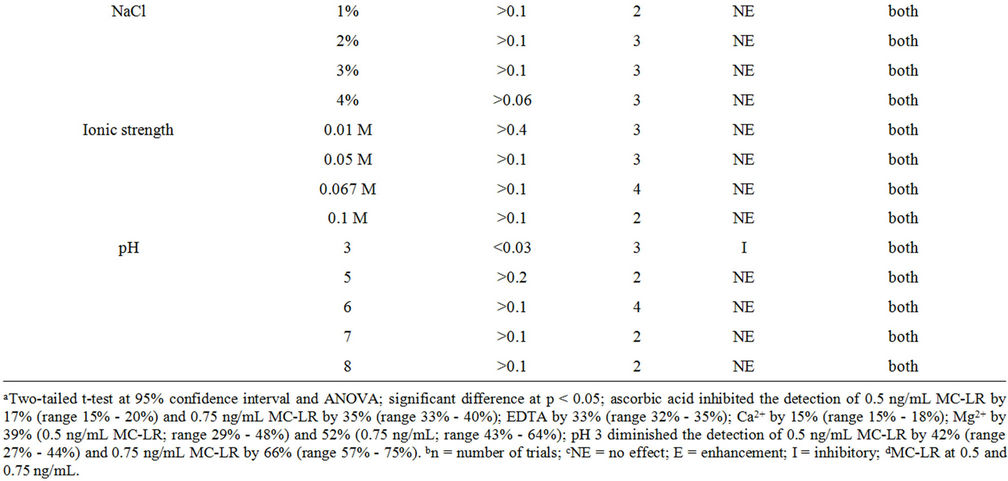
Table 1. The effects of various sample components in ELISA to detect MC-LR.
(NOM), which account for the major part of dissolved organic carbon (DOC) in aquatic ecosystems are normally found in drinking water at 2 - 15 μg/mL. NOM are breakdown products of plants, animals and microorganisms which are heterogeneous (size, structure, and functional chemistry) are yellow, brown and black in color. They are generally classified into four groups (humic, fulvic, humin and ulmin) depending on acid solubility, color, and molecular weight (MW) distribution. Fulvic acid has the lowest MW distribution, soluble at all pH, and yellowish in color; it comprises 80% - 90% of NOM in surface water [15]. The concentration of NOM in the environment can be estimated by TOC and/or dissolved organic carbon. Humic substances which are a mixture of varying proportions of hydrophobic, hydrophilic, acidic, basic and neutral chemicals are believed to interfere with the detection of compounds by photodiode array, mass spectrometry and immunoassays [16,17].
Different NOM at 1 - 50 μg/mL showed no effect on the microplate assay system (unspiked) but interfered with the detection of MC-LR (Table 2). In the presence of NOM only (unspiked), the assay showed no difference compared with the kit negative control. Overall, increasing amounts of NOM, showed increased inhibition of MC-LR detection (Figure 2).
The higher the optical density, the more the detection of MC-LR was inhibited. Figure 3 and Table 3 show the effects of 50 μg/mL NOM to detect 0.5 and 0.75 ng/mL MC-LR by ELISA. Only FPPFA statistically did not show any effect on MC-LR detection in both concentrations. However, subsequent analysis using 0 - 50 μg/mL of FPPFA with 0.5 and 1 ng/mL MC-LR showed some inhibition in MC-LR detection (Figure 2). FPPFA at ≥2.5 μg/mL inhibited both concentrations of MC-LR de-
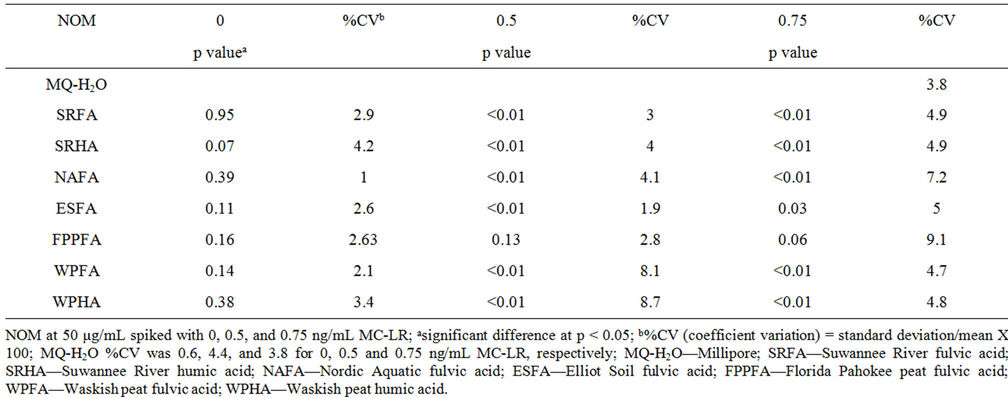
Table 2. ELISA of NOM spiked with MC-LR.

Figure 2. The effects of FPPFA on ELISA to detect MC-LR.
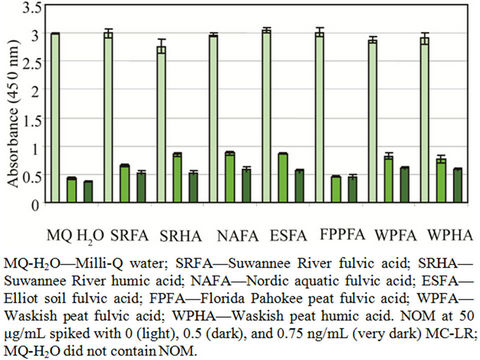
Figure 3. The effects of NOM in the detection of MC-LR by ELISA.
tection. The discrepancy in the results may be due to the assay variability. In similar studies, 5 μg/mL SRFA may inhibit detection of 0.75 ng/mL MC-LR (p = 0.84, 0.05, 0.05). ESFA at >10 μg/mL and NAFA at >5 μg/mL interfered with MC-LR binding. WPFA at ≥5 μg/mL
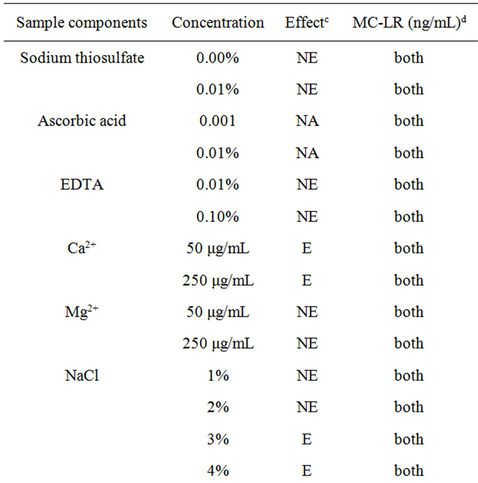
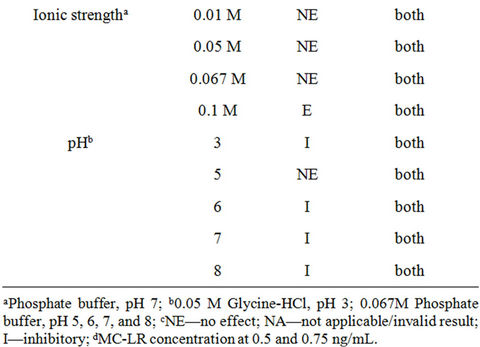
Table 3. The effects of various sample components in strip test to detect MC-LR.
inhibited binding of 0.5 ng/mL MC-LR and WPHA at >20 μg/mL inhibited 1 ng/mL MC-LR. Different NOM showed variable effects in the presence of MC-LR. The manufacturer’s product insert reported no interference to humic acid in concentrations up to 100 μg/mL. The source and the methods used to isolate and process humic acid can yield different components of the humic acid. The source of the humic acid and the manner it was evaluated were not reported.
Fulvic and humic acids from various natural sources and locations may have different effects on MC-LR detection. Better characterization of NOM components may lead to the further understanding of the effects of NOM in the presence of MC-LR. Soils with high clay and organic composition have been shown to be effective in removing cyanotoxins [18] and that hydrophobic interaction is the primary driving force in MC-LR adsorption [19]. Adsorption of microcystins in clays can underestimate the actual concentrations of microcystins in source water [20]. Lee et al. [21] have shown that SRFA can competitively inhibit MC-LR removal by powdered activated carbon and filtration with polyethersulfone filter. Furthermore, it has been shown that NOM can influence the photochemical degradation of MC-LR and in the presence of Ca2+ can enhance the adsorption of microcystins with humic acids [22]. NOM, like EDTA, can bind with metals which plays major role for bioavailability and toxicity of metals in the environment.
3.4. Strip Test Performance
This strip test (also known as dipstick or lateral flow test) is a simplified immunoassay format. The new strip (or dipstick) test for microcystins is a competitive inhibition format. The above control line is always included in each strip which is not affected by the presence of microcystins in the sample. The presence of the upper control band validates the assay system and the lower band is the test line. If microcystins (and/or nodularin) are present in the sample, the color intensity of the test line is diminished. A negative test result shows both lines of similar intensity. If the test line has no visible line or less intensity than the control line, the test is positive for microcystin.
The control lines were present in all the tests but at times less intense than the test negative line on the same strip. No guidance for interpretation was provided in the kit when the test line intensity is darker than the control line. The control line provides the maximum cut-off point established for the toxin. Variable results of the same sample even on the same run were observed. The color development was at times non-uniform and the intensity variable especially in the test line. The control line intensity was not as variable as the test line which is most probably due to imprinting process. The color development for samples with 0, 0.5, 1.0, 2.5, and 5.0 ng/mL MC-LR was as expected. The interpretation of strip test is often very subjective. Some may see faint lines better than others and the use of a scanner or densitometer may circumvent this ambiguity. Furthermore, proper training and interpretation of results are important when running such kits.
3.5. Effects of Various Water Components on Strip Test to Detect MC-LR
Similar to the microplate format, the strip test is also predisposed to sample matrix interference. Table 3 shows the effects of sample constituents in the detection of MC-LR by strip test. The oxidant, sodium thiosulfate, at 0.001% and 0.01%, altered the band color to dark red but had no effect on MC-LR detection. The other oxidant, ascorbic acid at 0.001% - 1% drastically reduced the intensity of both the control and test lines thereby, invalidating the results. EDTA at 0.0001% and 0.001% revealed no effect on the assay but showed higher band intensity in the former spiked with 0.5 and 0.75 ng/mL MC-LR than the latter. Samples with 50 and 250 μg/mL Mg2+ spiked with 0.5 and 0.75 ng/mL MC-LR showed no difference compared with the unspiked (no added MC-LR) samples. However, the same concentrations of Ca2+ can yield false positive results or overestimate the actual amounts of MC-LR in the sample. NaCl at ≤2% exhibited no effect on the assay (unspiked samples) and in the detection of MC-LR whereas at higher amounts can yield false positive results. Ionic strengths at >0.067 M PB, pH 7 resulted in false positive results. Figure 4 shows
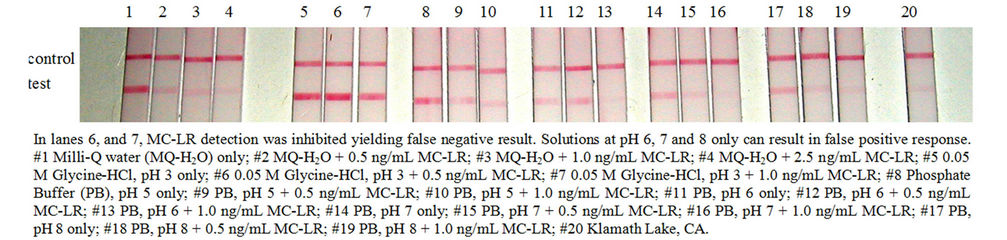
Figure 4. The effects of pH on strip test to detect MC-LR.
the effects of pH on strip test to detect MC-LR. Glycine-HCl, pH 3 yielded false negative result and at pH 6, 7, and 8 caused false positive response. There was no effect on MC-LR detection at pH 5. Lastly, like the microplate assay, NOM at 50 μg/mL also exerted variable effects in MC-LR detection in the strip test (Figure 5). SRHA had no effect on the assay and to detect MC-LR. WPFA and WPHA can interfere with the control line and may also yield false negative results in the presence of low levels of MC-LR. The presence of SRFA, FPPFA, NAFA and ESFA (data not shown for NAFA and ESFA) can exhibit false negative results and underestimate the actual levels of MC-LR in water. When evaluating immunoassay kit performance, it is prudent to test water variables typical of the system to obtain meaningful results. The presence of NOM in water with or without microcystins can yield variable results in strip test.
3.6. Analysis of Environmental Water Sample
Water samples from water treatment plant and surface waters during a cyanobacterial bloom were analyzed by ELISA and strip test. Water quality parameters were measured such as pH (7.3 - 8.2), turbidity (0.04 - 19 NTU), TOC (0.96 - 3.33 mg/L) and conductivity (352 - 378 μS). Figure 6 shows the strip test for samples from treatment plant and source water (R1) at various depths during a CHAB. Samples 1 to 4 were tested in duplicate to demonstrate within run variability. Table 4 is the
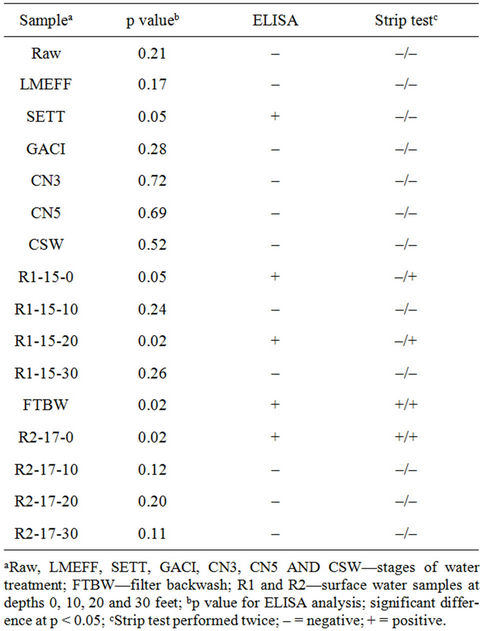
Table 4. ELISA and strip test for microcystins using source waters and at different stages of drinking water treatment process.
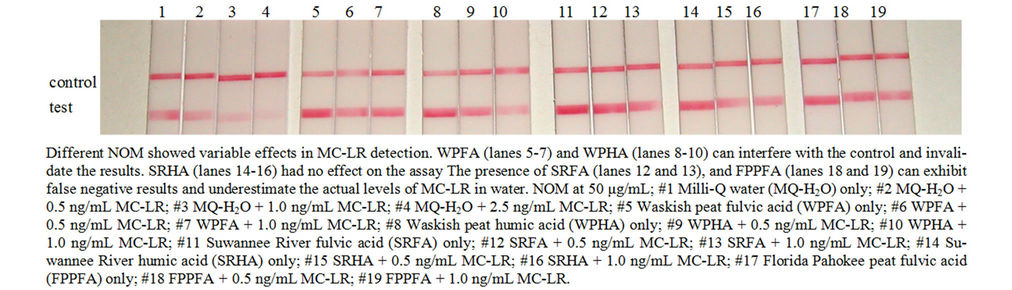
Figure 5. The effects of NOM to detect MC-LR by strip test.
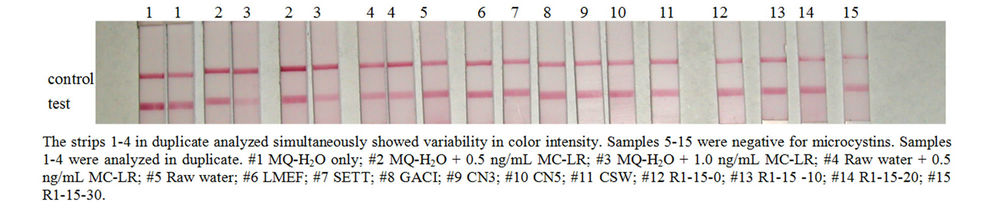
Figure 6. Strip test for samples from a treatment plant and source water (R1) at various depths during a cyanobacterial harmful algal bloom. Raw, LMEF, SETT, GACI, CN3, CN5 and CSW are stages of water treatment process and R1 is surface water sample at various depths.
corresponding ELISA and strip test results plus R2, another surface water sample. Five samples were positive for ELISA compared with two (first analysis) to four (second analysis) in strip test. Since the strip test appears to be sensitive to pH, it is possible that the discrepancy may be due to the high pH in the samples. Recently, Long et al. [23] reported that the stability, biological activities and the binding efficiency of MC-LR and anti-microcystin are affected by the pH of the solution.
3.7. Comparison with Antibody-Based Assays
Numerous studies have been published on the measurement of microcystin levels using antibody-based assays. Comparison with other systems may be difficult because reagents, assay formulations, and procedures are different. Antibodies (polyclonal, monoclonal or single-chain) vary in affinity and avidity to numerous variants of microcystins. The presence of salts, blocking, chelating, and buffering agents in the assay solutions can affect the evaluation of sample components. The new dipstick test evaluated here claimed no interference with numerous organic and inorganic compounds commonly found in water samples but added that matrix interference is possible. TippkÖtter et al. [24] showed inhibition of low microcystin levels (used 0, 1, 2, 5, 7.5 and 10 ng/mL) in tap water in their dipstick semi-quantitative assay for microcystin. In their system, the MC-LR detection limit of 5 ng/mL was similar in buffer, salt and pond water (pH 5.6 - 8.7; conductivity of 391 - 48,500 μS/cm).
Zeck et al. [13] reported that at pH 2, 1 mg/mL humic acid showed no effect in MC-LR detection in their microplate ELISA using monoclonal antibody MC10E7. The humic acid used in their study was obtained from a different source. Humic acid composition depends on the source and processing methods and therefore, may vary in their effects in assay evaluation. Furthermore, they reported that the antibody was stable in saturated solution NaCl, in pH 2 to 9.2, in 30% (v/v) methanol, and 20% (v/v) acetonitrile. Studies by Metcalf et al. [25] on the effects of salinity and pHs on microplate ELISA were variable. Changes in salts and ions can influence antigen-antibody interactions and effects can be mitigated by extra dilution step. Another microcystin plate kit yielded recoveries from 53% to 250% using spiked drinking water, 0.01 M phosphate-buffered saline, pH 7.5 (PBS, pH 7.5) solution, source waters and reservoirs by Rivasseau et al. [26]. The recovery rate was 205% in PBS, pH 7.5 spiked with 0.1 ng/mL MC-LR. In a separate study, antimicrocystin antibody reacted nonspecifically with herbicides (simazine, atrazine, isoproturon, diuron, terbutylazine and linuron) [27]. Using rabbit anti-MC-LR (used MC-LR-BSA as antigen) in direct competitive ELISA, Sheng et al. [28] reported recovery rates between 90% to 110% in spiked (0.2, 0.5, and 1 ng/mL MC-LR) tap, wastewater treatment effluent, and reservoir waters which were tested to contain <0.1 ng/mL microcystins. Mhadhbi et al. [29] observed matrix effect in their ELISA test and recommended using blank river water for use in calibration curve for consistency and reproduction of matrix effect. A study by Wang et al. [30] using single-walled carbon nanotubes incorporated with polyclonal anti-microcystin antibodies impregnated onto fibrous material showed that the detection of microcystin is highly influenced by media conditions such as buffer composition, pH, and temperature.
Several attempts have been made to utilize antibodies (immunoaffinity column) to clean-up and/or concentrate microcystins in environmental and food samples [31-35]. Lawrence and Menard [33] in one algal sample consistently resulted in 30% - 60% recovery rate regardless of spiking (1 - 4 μg toxin/g algae) or the amount of sample passed through 25 - 100 mg cartridges. Brown organic matter can interfere with the retention of microcystin, especially MC-RR, on to the immunoaffinity cartridges. Knowledge of specific interfering substances affecting the low recovery rates can provide insights to possible steps to amend this problem.
4. Conclusion
Antibodies when used for sample analysis, immunoaffinity enrichment, and as part of sensors or immunological detection must be evaluated for sample or matrix interference such as ions, NOM, salt, pH, metals, and organic solvents. The evaluated immunoassay microplate and strip formats to detect MC-LR were affected by sample components present with the target analyte. The NOM from various natural sources and location can have variable effects in the quantification of MC-LR in water. This study suggests caution when interpreting assay results and appropriate controls must be analyzed simultaneously when testing water samples for the results to be meaningful. The determination of various water quality parameters such as pH, turbidity, and TOC can also aid in the proper interpretation of immunoassay results.
5. Acknowledgements
We are thankful to Mr. Larry Wymer, in-house statistician, for his valuable statistical analyses advice and Dr. Kevin Oshima for his comments.
6. Disclaimer
Although this work was reviewed by the US EPA and approved for publication, it may not necessarily reflect official agency policy. Mention of trade names does not constitute endorsement.
REFERENCES
- M. G. Antoniou, A. A. de la Cruz and D. D. Dionysiou, “Cyanotoxins: A New Generation of Water Contaminants,” Journal of Environmental Engineering, Vol. 131, No. 9, 2005, pp. 1239-1243. doi:10.1061/(ASCE)0733-9372(2005)131:9(1239)
- M. Welker and H. von Döhren, “Cyanobacterial Peptides—Nature’s Own Combinatorial Biosynthesis,” FEMS Microbiological Review, Vol. 30, No. 4, 2006, pp. 530-563. doi:10.1111/j.1574-6976.2006.00022.x
- J. L. Smith, G. L. Boyer and P.V. Zimba, “A Review of Cyanobacterial Odorous and Bioactive Metabolite: Impacts and Management Alternatives in Aquaculture,” Aquaculture, Vol. 280, No. 1-4, 2008, pp. 5-20. doi:10.1016/j.aquaculture.2008.05.007
- L. Zhou, D. Yu and H. Yiu, “Drinking Water Types, Microcystins and Colorectal Cancer,” Chinese Journal of Preventive Medicine, Vol. 34, No. 4, 2000, pp. 224-226.
- L. E. Fleming, C. Rivero, J. Burns, C. Williams, J. A. Bean, K. A. O’Shea and J. Stinn, “Blue Green Algal (Cyanobacterial) Toxins, Surface Drinking Water, and Liver Cancer in Florida,” Harmful Algae, Vol. 1, No. 2, 2002, pp. 157-168. doi:10.1016/S1568-9883(02)00026-4
- Z. Svircev, S. Krstic, M. Miladinov-Mikov, V. Baltic and M. Vidovic, “Freshwater Cyanobacterial Blooms and Primary Liver Cancer Epidemiological Studies in Serbia,” Journal of Environmental Science and Health C Environmental Carcinogen and Ecotoxicological Review, Vol. 27, No. 1, 2009, pp. 36-55.
- S. A. Wood, D. Mountfort, A. I. Selwood, P. T. Holland, J. S. C. Puddick and S. C. Cary, “Widespread Distribution and Identification of Eight Novel Microcystins in Antarctic Cyanobacterial Mats,” Applied Environmental Microbiology, Vol. 74, No. 23, 2008, pp. 7243-7251. doi:10.1128/AEM.01243-08
- P. Babica, J. Kohoutek, L. Blaha, O. Adamovsky and B. Marsalek, “Evaluation of Extraction Approaches Linked to ELISA and HPLC for Analyses of Microcystin-LR, -RR and -YR in Freshwater Sediments with Different Organic Contents,” Analytical and Bioanalytical Chemistry, Vol. 385, No. 8, 2006, pp. 1545-1551. doi:10.1007/s00216-006-0545-8
- J. McElhiney and L. A. Lawton, “Detection of the Cyanobacterial Hepatotoxins Microcystins,” Toxicology and Applied Pharmacology, Vol. 203, No. 3, 2005, pp. 219- 230. doi:10.1016/j.taap.2004.06.002
- A. Azoulay, P. Garzon and M. J. Eisenberg, “Comparison of Mineral Content of Tap Water and Bottled Waters,” Journal of General Internal Medicine, Vol. 16, No. 3, 2000, pp. 168-175. doi:10.1111/j.1525-1497.2001.04189.x
- United States Environmental Protection Agency, “Water Quality Standards Handbook,” 2nd Edition, United States Environmental Protection Agency, Washington DC, 1994.
- K. A. Loftin, M. T. Meyer, F. Rubio, L. Kamp, E. Humphries and E. Whereat, “Comparison of Two Cell Lysis Procedures for Recovery of Microcystins in Water Samples from Silver Lake in Dover, Delaware with Microcystin Producing Cyanobacterial Accumulations,” USGS Open-File Report 2008-1341, p. 9.
- A. Zeck, A. Eikenberg, M. G. Weller and R. Niessner, “Highly Sensitive Immunoassay Based on a Monoclonal Antibody Specific for [4-Arginine] Microcystins,” Analytical Chimica Acta, Vol. 441, No. 1, 2001, pp. 1-13. doi:10.1016/S0003-2670(01)01092-3
- F. G. Kari and W. Giger, “Speciation and Fate of Ethylenediaminetetraacetate (EDTA) in Municipal Wastewater Treatment,” Water Research, Vol. 30, No. 1, 1996, pp. 122- 134. doi:10.1016/0043-1354(95)00125-5
- E. T. Gjessing, P. K. Egeberg and J. Hakedal, “Natural Organic Matter in Drinking Water—The ‘NOM Typing Project’ Background and Basic Characteristics of Original Water Samples and NOM Isolates,” Environment International, Vol. 25, No. 2-3, 1999, pp. 145-159. doi:10.1016/S0160-4120(98)00119-6
- M. A. González-Martínez, R. Puchades and A. Maquieira, “Optical Immunosensors for Environmental Monitoring: How Far Have We Come?” Analytical and Bioanalytical Chemistry, Vol. 387, No. 1, 2007, pp. 205-214. doi:10.1007/s00216-006-0849-8
- C. Schmidtkunz, H. B. Stich and T. Welsch, “Improving the Selectivity and Confidence in the HPLC Analysis of Microcystins in Lake Sediments,” Journal of Liquid Chromatography and Related Technology, Vol. 32, No. 6, 2009, pp. 801-821. doi:10.1080/10826070902767999
- M. J. Miller and H. J. Fallowfield, “Degradation of Cyanobacterial Hepatotoxins in Batch Experiments,” Water Science and Technology, Vol. 43, No. 12, 2001, pp. 229- 232.
- G. Liu, Y. Qian, S. Dai and N. Feng, “Adsorption of Microcystin LR and LW on Suspended Particulate Matter (SPM) at Different pH,” Water Air and Soil Pollution, Vol. 192, No. 1-4, 2008, pp. 1-4. doi:10.1007/s11270-008-9635-x
- H. Yan, A. Gong, H. He, J. Zhou, Y. Wei and L. Lu, “Adsorption of Microcystins by Carbon Nanotubes,” Chemosphere, Vol. 62, No. 1, 2006, pp. 142-148. doi:10.1016/j.chemosphere.2005.03.075
- J. Lee and H. W. Walker, “Effect of Process Variables and Natural Organic Matter on Removal of MicrocystinsLR by PAC-UF,” Environmental Science and Technology, Vol. 40, No. 23, 2006, pp. 7336-7342. doi:10.1021/es060352r
- M. Campinas and J. Rosa, “The Ionic Strength Effect on Microcystin and Natural Organic Matter Surrogate Adsorption onto PAC,” Journal of Colloid Interface Science, Vol. 299, No. 2, 2006, pp. 520-529. doi:10.1016/j.jcis.2006.02.042
- F. Long, A. Zhu, J.-W. Sheng, M. He and H.-C. Shi, “Matrix Effects on the Microcystin-LR Fluorescent Immunoassay Based on Optical Sensor,” Sensors, Vol. 9, No. 4, 2009, pp. 3000-3010. doi:10.3390/s90403000
- N. TippkÖtter, H. Stückmann, S. Kroll, G. Winkelmann, U Noack, T. Scheper and R. Ulber, “A Semi-Quantitative Dipstick Assay for Microcystin,” Analytical and Bioanalytical Chemistry, Vol. 394. No. 3, 2009, pp. 863-869.
- J. S. Metcalf, P. Hyendstand, K. A. Beattie and G. A. Codd, “Effects of Physicochemical Variables and Cyanobacterial Extracts on the Immunoassay of Microcystin-LR by Two ELISA Kits,” Journal of Applied Microbiology, Vol. 89, No. 3, 2000, pp. 532-538. doi:10.1046/j.1365-2672.2000.01141.x
- C. Rivasseau, P. Racaud, A. Deguin and M.-C. Hennion, “Evaluation of an ELISA Kit for the Monitoring of Microcystins (Cyanobacterial Toxins) in Water and Algae Environmental Samples,” Environmental Science and Technology, Vol. 33, No. 9, 1999, pp. 1520-1527. doi:10.1021/es980460g
- C. Rivasseau and M.-C. Hennion, “Potential Immunoextraction Coupled to Analytical and Bioanalytical Methods (Liquid Chromatography, ELISA Kit and Phosphatase Inhibition Test) for an Improved Environmental Monitoring of Cyanobacterial Toxins,” Analytica Chimica Acta, Vol. 399, No. 1, 1999, pp. 75-87. doi:10.1016/S0003-2670(99)00578-4
- J.-W. Sheng, M. He, H.-C. Shi and Y. Qian, “A Comprehensive Immunoassay for the Detection of Microcystins in Waters Based on Polyclonal Antibodies,” Analytica Chimica Acta, Vol. 527, No. 2, 2006, pp. 309-315. doi:10.1016/j.aca.2006.05.040
- H. Mhadhbi, S. Ben-Rejeb, C. Cleroux, A. Marte and P. Delahaut, “Generation and Characterization of Polyclonal Antibodies against Microcystins—Application to Immunoassays and Immunoaffinity Sample Preparation Prior to Analysis by Liquid Chromatography and UV Detection,” Talanta, Vol. 70, No. 2, 2006, pp. 225-235. doi:10.1016/j.talanta.2006.02.029
- L. Wang, W. Chen, D. Xu, B. S. Shim, Y. Zhu, F. Sun, L. Liu, C. Peng, Z. Jin, C. Xu and N. A. Kotov, “Simple, Rapid, Sensitive, and Versatile SWNT-Rapid Sensor for Environmental Toxin Detection Competitive with ELISA,” Nano Letters, Vol. 9, No. 12, 2009, pp. 4147-4152. doi:10.1021/nl902368r
- T. Tsutsumi, S. Nagata, A. Hasegawa and Y. Ueno, “Immunoaffinity Column as Clean-Up Tool for Determination of Trace Amounts of Microcystins in Tap Water,” Food Chemistry and Toxicology, Vol. 38, No. 7, 2000, pp. 593-597. doi:10.1016/S0278-6915(00)00044-2
- F. Kondo, H. Matsumoto, A. Yamada, K. Tsuji, Y. Ueno and K.-I. Harada, “Immunoaffinity Purification Method for Detection and Quantification of Microcystins in Lake Water,” Toxicon, Vol. 38, No. 7, 2000, pp. 813-823. doi:10.1016/S0041-0101(99)00194-4
- J. F. Lawrence and C. Menard, “Determination of Microcystins in Blue-Green Algae, Fish and Water Using Liquid Chromatography with Ultraviolet Detection after Sample Clean-Up Employing Immunoaffinity Chromatography,” Journal of Chromatography A, Vol. 922, No. 1-2, 2001, pp. 111-117. doi:10.1016/S0021-9673(01)00924-4
- J. McElhiney, M. Drever, L. A. Lawton and A. J. Porter, “Rapid Isolation of a Single-Chain Antibody against the Cyanobacterial Toxin Microcystin-LR by Phage Display and Its Use in the Immunoaffinity Concentration of Microcystins from Water,” Applied Environmental Microbiology, Vol. 68, No. 11, 2002, pp. 5288-5295. doi:10.1128/AEM.68.11.5288-5295.2002
- E. C. Aguete, A. Gago-Martinez, J. M. Leão and J. A. Rodriguez-Vazquez, “HPLC and HPCE Analysis of Microcystins RR, LR and YR Present in Cyanobacteria and Water by Using Immunoaffinity Extraction,” Talanta, Vol. 59, No. 4, 2003, pp. 697-705. doi:10.1016/S0039-9140(02)00610-0
NOTES
*Corresponding author.