Smart Grid and Renewable Energy
Vol.09 No.11(2018), Article ID:88839,22 pages
10.4236/sgre.2018.911015
Environmental Impacts of Grid Connected High Concentrated Photovoltaic Systems Adapted for Peak Load Minimization in Hot Climate
Talal H. Alzanki1, Kandil M. Kandil2, Mohammad R. Alenezi1, Adel A. Ghoneim2*
1Public Authority for Applied Education and Training (PAAET), Electronic Engineering Department, College of Technological Studies, Shuwaikh, Kuwait
2Public Authority for Applied Education and Training (PAAET), Applied Sciences Department, College of Technological Studies,Shuwaikh, Kuwait

Copyright © 2018 by authors and Scientific Research Publishing Inc.
This work is licensed under the Creative Commons Attribution International License (CC BY 4.0).
http://creativecommons.org/licenses/by/4.0/


Received: October 15, 2018; Accepted: November 26, 2018; Published: November 29, 2018
ABSTRACT
High concentrated PV multi-junction solar cells (HCPV) likely present a favorable alternative to achieve low cost of energy. However, multi-junction solar cell has different characteristics which should be settled before they can be adapted for large scale energy generation. Peak energy consumption in Kuwait usually occurs in periods of utilizing air conditioning systems which are essentially used in almost all year around in harsh climate like Kuwait. Power consumed at peak times is more costly than power needed to satisfy loads at regular consumption times. The main goal of the present research is to increase HCPV solar cells’ efficiency, to decrease maximum power cost in Kuwait. Multi-junction solar cells performance in weather conditions of Kuwait is investigated employing a single diode equivalent circuit model. The model developed considers the impacts of concentration ratio as well as temperature. Most research in literature review usually neglects shunt resistance of the diode, however this resistance is taken into consideration in current developed theoretical model. To calibrate the present model, current predictions are compared with corresponding measured data provided by multi-junction solar cell manufacturer. The total root mean square errors in the present model predictions are about 1.8%. This means that current developed model of single diode model which takes into account shunt resistance impacts gives precise and reliable data. HCP electrical efficiency is noticed to rise as concentration increases but to a certain concentration value, then it begins to decrease. In addition, utilizing HCPV linked to grid satisfies great decrease in maximum load. Power produced from HCPV modules is utilized to provide energy needs to a family in normal Kuwaiti family home to evaluate HCPV environmental effects. HCPV modules slopes and areas are changed to accomplish peak energy production all over the year. Present results reveal that optimum power production corresponds to HCPV modules directed to south and having latitude of 25˚. In addition, employing HCPV modules can avoid approximately 1.55 ton of emitted CO2 per year. In conclusion, current work reveals the advantage impacts of grid connected HCPV in Kuwait weather.
Keywords:
High Concentrated Photovoltaic Systems, Avoided CO2 Emission, Maximum Load

1. Introduction
Solar energy is a risk-free option to conventional fossil fuel that generates air pollution to our surroundings. Dangerous impacts of worldwide warming generated from traditional energy sources are also a significant issue in that matter. Solar energy is an important renewable energy resource because of its several benefits to human and environment. Multi-junction concentrator solar cells are a promising technology as they can satisfy the growing energy requirements with renewable resources. Concentrating sunlight on the aperture of multi-junction photovoltaic (PV) cells with high efficiency can produce a higher power densities compared to conventional PV cells. These cells have higher conversion efficiencies and decreased price because of employing smaller cell areas. Due to the fact of the growing need for sustainable energy, generation of solar cells has developed considerably in most recent years. Compound semiconductor cells are the overwhelming choice for space energy because of enhanced efficiency in comparison to other established solar cell techniques. However, Si cells continue to dominating the PV market due to their reduced cost. Direct integration of III-V compound semiconductors on larger diameter, less costly and already available Si substrate is highly required for much less costly photovoltaic. Upgrading expensive PV solar cells by lower price optical materials results in a realistic cost saving [1] [2] . Focusing sunlight concentrated on the aperture of high efficiency, multi-junction PV solar cell can generate much higher power densities than traditional PV cells. This concept can be achieved by utilizing concentrating solar rays into small cell area through optical systems. This approach is commonly introduced as concentrator photovoltaic technology (CPV). It minimizes PV cell area while device light intensity improves by equivalent factor. This approach is generally presented as concentrator photovoltaic technology (CPV).lent factor. A number of CPV providers have got working efficiencies of about 25% [3] [4] . In various sunshine areas, annually available power for tracking concentrator with two-axis is higher than total solar intensity supplied to systems utilizing flat plate collector [5] .
Concentrating photovoltaic systems can be categorized in variety of ways: geometric, optic, tracking, etc. [6] that are usually depending on the concentration ratio or factor “X”. Concentration factor (X) is defined geometrically as the ratio of primary optical area (receiver) to the active cell area and optically as the intensity ratio or Suns. Suns are the ratio between the concentrated light that attains the cells and the available maximum solar radiation (1000 W/m2). Depending on concentration factor X, the system can be classified as low concentration (X < 10 Suns), medium (10 < X < 100 Suns), high (100 < X < 2000 Suns) and ultrahigh (X > 2000 Suns). Modeling multi-junction solar cells efficiency is a crucial process for energy calculation of large concentration photovoltaic (HCPV) modules. Cells perform throughout diverse range of incident radiation and working temperature. Various solar cell models [7] [8] are introduced in literature review to identify cell efficiency correlated to temperature and incident radiation.
Many authors have suggested techniques for extracting the subcells variables by implementing a variety of simplifications and assumptions. Generally there are several methods based on both the single diode model [9] [10] [11] and the double diode model [12] [13] . Nevertheless, such techniques identify the parameters at specific running conditions and not for the entire range of practical conditions restricting using these models. The techniques addressed above depend on direct measurement on HCPV cells. This suggests that one should measure electrical variables of the module to determine temperature. Due to this particular situation, these types of strategies are more appropriate for practical analysis of HCPV systems. Conversely, utilizing introduced atmospherical parameters allow investigating HCPV at remote areas [14] . Complex artificial intelligent techniques are recommended to examine cells temperature from direct radiation, wind speed and air temperature. However, these imply neglecting the part of the irradiance not transformed to heat. Therefore, they are not acceptable to assess cell temperature when HCPV modules performing at maximum energy; as they overestimate cell temperature. In spite of the earlier published research, the combined effects of high incident radiation and temperature on HCPV performance in hot and severe weather like Kuwait climate have not been analyzed yet.
There are two types of PV systems; grid-connected or stand-alone. The PV is not linked to the grid in stand-alone system. In this case, batteries should be employed to supply electricity at night and when solar panels don’t produce the necessary energy. On the other hand, grid-connected system is designed for locations with utility service. No need for battery storage in grid-connected system since the lack in PV energy generation can be delivered by the utility grid. Grid connected PV systems usually incorporate solar modules, inverters and wiring. Advanced technology significantly enhanced solar cells efficiencies and at the same time greatly decreased solar cells price. All over the world, various grid-connected PV systems have been established and running well [15] [16] [17] [18] . These kinds of techniques can significantly improve the efficiency of distribution system as well as minimizing transmission lines losses [19] . Mondol et al. [20] evaluated optimum inverter sizes in certain European areas based on system generation. Jung So et al. [21] compared the simulated efficiency of PV systems to the monitored PV performance. Outcomes revealed that it is essential to improve the currently established technology.
The impact of surface slope on performance of grid connected PV for maritime weather conditions was inspected by Mondol et al. [22] using simulations. The monthly optimum collection angle that optimizes solar radiation deviates from 10˚ up to 70˚. Hamrouni et al. [23] examined PV system in both regular and disturbed systems. The plant examined comprises of solar modules and a three-phase inverter. The theoretical and experimental data suggested the control performance of grid connected PV system in both situations. The four parameter model [24] is generally employed for studying solar cells characteristics. Two diode characteristics, the series resistance and the light current are the four parameters necessary for the IV equation. Dussault et al. [25] explored the possibility of decreasing the load exhausted by standard office building with low thermal mass in Quebec city, Canada for lighting, heating and cooling using smart windows. Vick et al. [26] demonstrated that there is a difference amongst the energy provided and the wind energy output in the Texas Panhandle. An economic evaluation carried out on the solar systems studied. Estimated levelized cost of energy (LCOE) of a hybrid wind farm and concentrated photovoltaic plant was in the range of $108/MW h to $129/MW h. They reported that their evaluation can be adapted for other countries.
Passos et al. [27] analyzed the visibility of solar hot water systems in Brazilian climate. In addition, they evaluated the influence of solar water heating in decreasing the peak load requirements in Brazil. They decided that implementing solar energy for domestic water heating is feasible in Brazil. In addition, they stated that the peak demand is constant even in extreme climate conditions. Experimental and numerical studies are presented by Stathopoulos et al. [28] to review the impact of phase change materials. The heat storage system is composed of paraffin plates fixed at heat exchanger. Furthermore, a numerical model was introduced implementing finite differences technique. Additionally, they recommended a preliminary control strategy demonstrating the capabilities of this system in peak load control. There is a significant increase in energy consumption in Kuwait particularly for air conditioning systems in summer time. To satisfy the ever-growing load demand, extra power plants are set up continuously in Kuwait. This obviously indicates the imperative requirements for renewable energy systems to provide most of the power consumption especially in peak load times. This clearly demonstrates the potential need of HCPV systems to displace significant portions of conventional energy resources.
Zhuk [29] et al. analyzed the price of controlling a variety of power plants. Their study revealed that utilizing battery is feasible for small peak demand times less than 1 h. On the other hand for prolonged durations, the traditional power plants are more feasible. Gu et al. [30] analyzed China’s coal-fired power units׳ peak management with a comprehensive setup capacity and peak shaving process. They reported rules guidelines to manage the peak shaving problem and to guarantee sustainable enhancement of power system. Decrease of peak load in the Polish electrical power system is demonstrated by Werminski et al. [31] . They applied a decentralized active demand response system to decrease peak loads. The simulation outcomes revealed that adapting a decentralized active demand response system results in a considerable reduction in peak load. A novel system for heating, electricity generation and cooling using energy peak load shifting is recommended by Lv et al. [32] . A brand new strategy is established to inspect the economic feasibility of such technique. The results revealed that system functions professionally for minimal pressure conditions. The suggested system saves about 53.9% yearly. Nazi et al. [33] developed a model for peak load decrease based on building’s thermal analysis. Outcomes demonstrated that lighting system and windows heat gain account for 71% of the building’s heat gain and 40.2% reduction in cooling load can decrease total power consumption by about 47%.
In current research, single diode equivalent circuit model is developed to analyze multi-junction cells efficiency in Kuwait weather conditions considering the impacts of both temperature and concentration ratio. Furthermore, the shunt resistance of the diode that is normally ignored in the existing models is taken into consideration in the present developed numerical model. Model results are compared to reported measured data to assess its accuracy and durability. The model predictions agree well with reported measured data. The combined impacts of high incident radiation and temperature on HCPV efficiency in hot and extreme climate similar to Kuwait climate are analyzed. Grid connected high concentrated PV is recommended to decrease the peak demand in Kuwait. Transient simulation program [34] implemented to examine the performance of HCPV in Kuwait weather conditions. Various solar modules area and orientation are studied to accomplish maximum energy generation from grid connected HCPV system. Restored power from HCPV is adapted to supply the energy consumption of people in standard Kuwaiti house. Different PV slopes and areas are assessed to maximize yearly energy outcomes from HCPV system. Finally, the CO2 emission conserved is determined to examine environmental impacts of high concentrated photovoltaic in Kuwait climate. To our knowledge this is the first study assessing grid connected high concentrated photovoltaic systems for peak load reduction in Kuwait climate.
2. Numerical Modeling
The numerical model outlining the solar modules efficiency must properly determine the change of solar module power with surrounding radiation and temperature. This model is previously discussed in detail [35] . In Solar cell production power is function of radiation intensity and temperature since it is a nonlinear power supply. Figure 1 represents single diode model circuit for triple-junction solar cells.
An increase in solar cell power under concentration is primarily attributed to an increase in the open circuit voltage (Voc) which is given by:
(1)
where Isc is the short circuit current, n is the diode ideality factor, (ni), Io is the diode reverse saturation current, q is the electron charge, k the Boltzmann constant.
Cell output power reaches peak at maximum power point (MPP). Fill factor (FF) measures square similarity of IV characteristics output and is defined as:
(2)
where Im and Vm are maximum voltage and maximum current at maximum power Pm. Proportion of solar cell output energy to energy input from sunlight is the most important criteria adapted to assess solar cell efficiency, η, and it is given by:
(3)
The functioning under focused sunlight enhances the efficiency of the solar cell. For concentration factor X, the short circuit current Isc (Xsun):
(4)

Figure 1. Single diode model circuit for triple-junction solar cells.
where Isc (1sun) the short circuit current at 1 sun and 1 sun equals to1000 W/m2.
Absolute temperature coefficient of Isc is function of concentration factor (X):
(5)
The triple junction solar cell is composed of three junction linked in series. Every junction expressed by the single diode model. I − V relation for cell junction considering the shunt resistance:
(6)
Each sub cell specified using set of 5 factors: short circuit current (Isc), diode ideality factor (ni), diode reverse saturation current (Io,i), series resistance (Rs,i), and shunt resistance (Rsh,i). The terminal voltage is V, q electron charge of the, Boltzmann constant, kB, Ji is load current; T is cell temperature and represent cell junction (1 for top cell, 2 for medium cell and 3 for top cell). Reverse saturation current is the main factor influencing Voc, so I0, is a measure of minority carriers loss throughout p − n junction in reverse bias. Diode ideality factor, n, accounts for diffusion diode non-idealities. Based on Shockley theory of diodes, n should equal unity, but a value of n > 1 is more appropriate to include imperfections produced through manufacturing process. The series resistance is the sum of the bulk resistance of semiconductor materials, metal grids bulk resistance and interconnections and resistance contacting metal contact and the semiconductor. The most significant factor in obtaining high efficiency concentrated solar cells is Rs. Shunt resistance is caused by the leakage current across the p − n junction, either at cell perimeter or in the crystal close to the junction due to defects or deposition of impurities. Open circuit voltage (Voc) is attained by setting I = 0 in Equation (6).
The last term in Equation (6) makes the equation, nonlinear and implicit needing outstanding computational attempts to be solved. That is the reason why the last term in Equation (6) is ignored in the published models considering the shunt resistance is infinity. This estimate can greatly impact the precision of the model predictions. So, shunt resistance is considered in the present work. Using the Lambert W-function [36] , Equation (6) can be transformed from implicit nonlinear equation to explicit nonlinear equation. Applying Lambert W-function, Jain and Kapoor [37] expressed Equation (6) as:
(7)
Because of its explicit nature, Equation (7) has recently been adapted to analyze PV systems [38] [39] . Lambert W-function is solved using already mathematical software packages. In present study, Maple software is employed to conduct the calculations of the developed numerical model. To numerically solve Equation (7), five parameters should evaluated; n, Isc, I0, Rs, and Rsh. These factors have a significant role in the behavior of PV devices. The method carried out by Ghani et al. [40] is followed to determine these five parameters.
Summing the voltages of each subcell, multi-junction total voltage (V) is:
(8)
For single diode model of multi-junction cell, 10 empirical factors are evaluated by calibration versus measurements. Dark saturation current density (Io,i), current per unit cell area, is strongly temperature dependent and can be expressed as:
(9)
where Eg,I is energy and k and γ are constants. Recombination in both quasi state neutral and depletion region is utilized to model Io. Energy band gap decreases with temperature; so Isc increases with temperature. In spite of that, this change is usually ignored in reported models as the band gap is usually considered constant. This effect must be considered if high accuracy of cell performance over a broad range of temperatures is required. Solar cells working temperature in CPV system is much higher than surrounding temperature. So, temperature impact on cell performance is extremely significant for CPV system design considerations. The band gap energy of semiconductors decreases with increasing temperature as expressed by the empirical expression introduced by Grey et al. [41] :
(10)
where Eg,i(0) band gap energy of i sub cell at zero Kelvin and α, β are material constants. As a result, Isc of solar cells increases slightly with temperature, while Voc and FF both decrease. So, efficiency of cell also drops in linear trend with temperature for certain intensity. Considering the effect of material composition allows the model to handle various cells types.
The above equations are formulated in a FORTRRAN code to develop a model to analyze the performance of multi-junction solar cells. The model developed considers the impacts of concentration ratio as well as temperature. The models is calibrated against published experimental data by AZURSPACE manufacturer. The developed model is found to agree well with published experimental data by AZURSPACE manufacturer. The total root mean square errors in the present model predictions are about 1.8%.
3. System Data
3.1. Electricity Consumption in Kuwait
Energy consumption in Kuwait is increasing very rapidly at a rate of about 7% annually. This is completely due to the building of new residential places, fast economic and development growth as well as the harsh climatic conditions. The peak load achieved 12,410 MW in summer 2014. So, the Kuwaiti government continuously set up brand new power production plants to fulfill the demand increase in energy consumption. Power plants size has expanded sharply from 70 MW in 1960 to 18,259 MW in 2015. Consequently, energy produced has developed from 1000 Million kWh in 1960 to 68,288 Million kWh in 2015 [42] . Additionally, the peak demand has considerably increased from 2100 MW in 1980 to 12,810 MW in 2015. Nearly about 50% of energy produced in Kuwait is consumed in domestic applications as the government and people construct additional urban areas. Also, air conditioning (AC) load represents significant part of the energy consumption in Kuwait. Figure 2 presents development of power stations capacity in Kuwait for the period 1960-2015.
The installed power capacity and peak power is evaluated for all years. Results indicate that peak power every time is smaller than the power generated by available power plants implying the capability of power plants to generate peak power required.
3.2. Load Data Analysis
The load each hour is calculated at 30 minutes steps throughout the period from 1960 to 2016. The load for each 30 minutes is recorded and analyzed by a program model. In hot months (June-September), a significant increase in energy consumption is noticed. This is due to the increase in AC load through summer months. It is worthy to point out that in summer, hourly load follow same order and at 15:00 hour the power reaches its maximum value. Figure 3 shows the
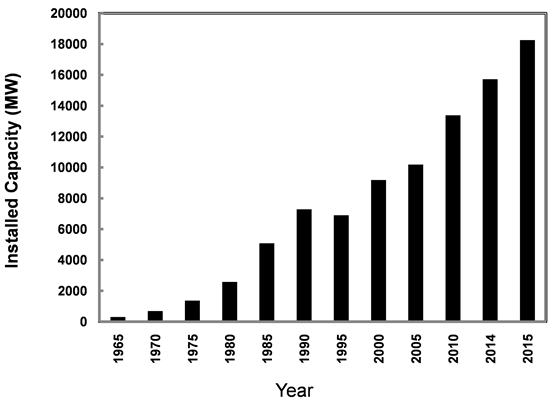
Figure 2. Evolution of the capacity of power stations in Kuwait.

Figure 3. Electrical load variation for the day of peak load (30th August, 2015).
variation of load with time at peak load day (30th August, 2015) in the year 2015 [42] .
The peak load of March 2015 is the minimum peak load during the duration of the year. This is due to the fact that in March residents usually stop using power for heating or cooling. So, loads higher than the load of March and in the period April to November is employed for air conditioning. On the contrary, the load from December to February is utilized in heating applications since extra apparatus are standard for each month. So, peak power at March is almost the load for appliances other than air conditioning (AC) systems. Therefore, the air conditioning power are those larger than peak power of March through April-November (hot months of the year). On the other hand, heating loads are those larger than the peak load of March through December-February (cool months of the year). Analysis of load data revealed that air conditioning loads in hot months represents about 68% of the peak loads. In addition, load data indicated that peak power generally occurs between 14:00-16:00 hour in summer days, and between 19:00-21:00 hour in winter days.
3.3. System Components
In addition to HCPV modules, PV systems need batteries, system wiring, inverters, support structures, over current protection and disconnects switches. Inverter and protection devices are the main link amongst utility grid and PV system. Most PV systems utilize system control besides DC to AC converters. To ensure power aspect and fast separation of grid from PV system in accidents, PV systems include precise control circuit. Disconnect switches are necessary for safety and they typically utilize over current protection as circuit breakers or fuses. Grid connected system is suggested for the present work. In this situation, batteries are not necessary as power from grid utilized to supply power if required power is greater than the power produced by PV system. In addition, PV system generally necessitate maximum power point tracker [43] to control PV outputs so it continuously runs close to maximum power point. Figure 4 illustrates the proposed system adapted for the present study.
3.4. Methodology
The goal of present study is to examine the capability of high concentrated PV modules to minimize total and peak power in Kuwait. The targeted load decrease is affected by HCPV performance in addition to the instantaneous occurrence of both HCPV output and peak load. The HCPV power is evaluated utilizing recorded hourly electrical loads and weather data for Kuwait. The single diode equivalent circuit model developed for this work is employed to calculate multi-junction cells performance in Kuwait climate taking into account the impacts of both temperature and concentration ratio. Transient simulation program [34] is adapted to evaluate HCPV system hourly energy output utilizing both ambient temperature and radiation incident on array surface. The HCPV system is assumed to be due south and inclined at a 31˚ (Kuwait latitude). TYPE 16 (solar radiation subroutine) built in TRNSYS is utilized to evaluate angle of incident. Duffie and Beckman [44] suggested correlations are utilized to evaluate effective angle of incident. Each simulation has a one year period and utilize gallium indium phosphide/gallium indium arsenide/germanium (GaInP/GaInAs/Ge) triple junction Azurspace cells [45] . Grid connected HCPV energy output greatly ruled by the location weather data. A FORTRAN code is introduced to create hourly weather data from available monthly data for surrounding temperature and horizontal radiation. Weather data employed in this work have been monitored and recorded for five years in the College of Technological Studies, Kuwait. A specific model is developed to calculate hourly loads then address the load style to a data file.

Figure 4. Diagram of grid connected HCPV.
4. Environmental Life Cycle Assessment
If a PV power facility (low or non CO2 emitting plant) is established as an alternative to conventional power plant (higher CO2 emitting plant), this will definitely results in a reduction of CO2 emission. Avoided CO2 emission is the difference between emissions generated by conventional energy sources and the ones generated throughout the manufacture of PV through entire system duration (25 years). Spiegel et al. [46] examined offset potential of the pollutant emission for distributed photovoltaic plant. Power generated used to determine offset emissions of SO2, CO2, and NOx. The emission decrease of greenhouse gases are evaluated by Delarue et al. [47] at different European regions. They mentioned that greenhouse gases emission reduction in power generated may accomplish a value of 19%.
In current study, a numerical model is introduced to determine avoided CO2 emission achieved due to the utilization of grid-connected HCPV system. Grid connected HCPV system is suggested to provide electricity consumption demands (lighting and household appliances) for people in an standard Kuwaiti house. The emissions produced in the fabrication procedures of PV systems can be disregarded [48] since they are substantially lower than the emissions produced by conventional sources. Avoided CO2 emission is primary the CO2 emissions that generated by traditional sources. To carry out CO2 emission reduction computations for PV, the reference case of the electricity system must be specified. This of course will require identifying the conventional source and associated fuel (oil, natural gas, coal). The standard emission parameters as well as conversion efficiencies of a variety of fuel types [49] are input to the model.
5. Results and Discussions
The data used for the present study is measured and recorded by the outdoor test facility set up at College of Technological Studies, Kuwait (Latitude 31˚). The weather data include continuous measurements of hourly surrounding temperature, solar global radiation and solar direct radiation on horizontal surface at Kuwait for five years in the period from 1st October 2011 till 31st Septmber 2016. The HCPV module adapted to conduct current work and to calibrate predictions of present developed model is: gallium indium phosphide/gallium indium arsenide /germanium (GaInP/GaInAs/Ge) triple-junction data of Azurspace 2016. Predicted parameters for Azurspace cells using present single diode model is presented in Table 1.

Table 1. Predicted Azurspace cell parameters using single diode model.
Figures 5 demonstrates the variation of the predicted cell efficiency (η) versus concentration factor at two different temperatures along the experimental data for the HCPV module studied. As seen, η increases with concentration until concentration factor equal to 400 approximately for Azurspace cells. This increase is controlled by Voc logarithmic increase with intensity. However, as concentration goes up, this effect is compromised by cell fill factor reduction because of losses in series resistance. Consequently, efficiency decreases over a specific concentration degree. The efficiency behavior follows the same trend in Voc, which agrees well with earlier results [50] . The root mean square error in efficiency calculation is found to be 1.8%. These results clearly indicate that the present model predictions for Azurspace cellagree well with the corresponding experimental data. So, present predictions, let us conclude that the present developed model accurately determines HCPV cells performance over the temperature range studied.
The recommended PV system does not provide power to utility grid but it is expected to generate the load requirements. So, the energy produced is lost when the output of HCPV is larger than the load demand. The HCPV output and the load demand should be equal at each run hour. To confirm that concept, the simulated HCPV energy is correlated with hourly load data. The HCPV factors were changed till achieving the equality among HCPV output and corresponding hourly and annual energy.
An illustration for the output of this process is presented in Figure 6 for the day of maximum load (30th August, 2015) for HCPV of 1000 MW. As the figure

Figure 5. Variation of efficiency versus concentration factor for Azurspace cell.

Figure 6. HCPV energy shaves electrical load on 30th August, 2015.
shows, for 1000 MW HCPV output shaves the peak load by about 32%. Consequently this obviously illustrates the excellent match among the HCPV output and the hourly electrical load. This figure indicates that the HCPV system produces energy at peak load, i.e. the HCPV can definitely decrease peak load all over day while HCPV power not ever surpass the load.
Maximum monthly electrical energy load for the year 2015 is shown in Figure 7 for capacities of 0 MW, 1000 MW, and 2000 MW respectively. As figure illustrates, increasing HCPV system size results in significant decrease in peak load. Also, peak load during the whole year, can be reduced by utilizing HCPV system with capacity of 1000 MW.
Calculation of the individual impact on load reduction is an alternative strategy to examine the capability of the HCPV system. That can be carried out by assessing total decrease in load demand by including all effects. Load requirements reduction is defined as monthly average load reduction at all day times during complete months. Figure 8 presents the change of the ratio of monthly average load reduction against HCPV size.
The ratio of average monthly demand reduction is defined as the average monthly demand reduction in MW for each 1 MW PV output. The relationship among HCPV size and average monthly load reduction is straight till HCPV size of 1000 MW. So, this ratio is constant and equal to about 0.69 till 1000 MWs. Increasing HCPV capacity above 1000 MW results in a decrease in this ratio. The reduction is mainly attributed to energy loss as HCPV energy starts to be

Figure 7. Monthly peak load for various HCPV capacity.

Figure 8. Ratio of load reduction against HCPV capacity.
larger than the required load. Consequently, the effect of HCPV on load reduction becomes insignificant specifically for HCPV sizes larger than 6000 MW. This results reveals that utilizing HCPV systems can significantly improve the efficiency of conventional utility sources.
The generated power from HCPV is proposed to supply domestic hot water load and electricity consumption for citizens in an ordinary Kuwaiti house. The hot water demand is 280 liter/day presuming a 40 liters/person/day. The computer model is supplied with the ordinary loads consumption. The two-story house comprised 2 living rooms, dining room, 5 bedroom, 2 kitchen as well as a set of household apparatus. An hourly load pattern is provided to subroutine to be utilized during simulation. The model program is also supplied with the hours in which the load is employed throughout the whole for household appliances.
Various HCPV array azimuth angle and slopes are examined to achieve maximum annual HCPV energy generation. The maximum energy generation from the HCPV system occurs at array inclination of 25˚ (Kuwait latitude-5˚) and due south. Peak energy generation at angles lower than region altitude agree well with the weather condition in Kuwait since much radiation is available in summer more in winter.
Emission produced in manufacture process of PV system parts should be considered to get precise results. However, the CO2 emission rate from PV is generally greatly smaller than the CO2 emission rate from fuel sources, so it is ignored in the present work. The change of CO2 emission avoided annually with tilt angle is shown in Figure 9.
As seen from Figure 9, once again the optimum tilt angle corresponding to maximum avoided CO2 emission is 25˚. The avoided CO2 emission at this optimum angle approximately equals to 1.55 ton/year clearly proofing the important effects of grid connected HCPV on environment in Kuwait weather conditions.

Figure 9. Variation of CO2 emission avoided with array inclination (azimuth angle = 0).
Furthermore applying Kyoto Protocol that enforce penalties on greenhouse gases emissions will increase the price of conventional energy resources making HCPV more feasible. Though, this protocol is not activated currently in Kuwait, but its activation will endorse the economical and environmental impacts of PV systems much more. Finally, it is worth to point out that economic analysis of HCPV grid connected system is not taken into account in this study. However, it is necessary to continue this research by investigating the feasibility of HCPV systems. These results can assist Kuwaiti government in considering the application of renewable energy resources in Kuwait.
6. Conclusions
The present study has assessed the ability of HCPV to minimize peak load in addition to the environmental analysis of these systems in Kuwait weather conditions. The following conclusions can be stated out depending on the present outcomes:
・ Single diode model is satisfactory for practical applications rather than using the complex two-diode model. The total root mean square errors in the present model predictions are lower than 2% compared with published experimental data.
・ The electrical efficiency (η) of HCPV module is noticed to increase with concentration to a certain concentration level after which it decreases.
・ Employing grid connected HCPV system significantly decreases the peak load.
・ The peak load can be reduced by about 32% by using 1000 MW HCPV capacity.
・ For HCPV capacity up to 1000 MW, the average peak demand is reduced to 0.69 MW for each 1 MW HCPV capacity.
・ Energy generated from grid connected HCPV system is maximum for arrays due south and with inclination to the horizontal of 25˚ (Kuwait latitude-5˚).
・ The avoided CO2 emission is approximately 1.55 ton/year at the optimum conditions.
・ The present work clearly proves the environmental effects of the HCPV system in Kuwait climate.
Acknowledgements
This work supported and funded by the Public Authority for Applied Education and Training (PAAET), Kuwait, Research Project No. (TS-17-07), Research Title “Optimization of Grid Connected High Concentrated Photovoltaic Systems for Peak Load Shaving in Kuwait”.
Conflicts of Interest
The authors declare no conflicts of interest regarding the publication of this paper.
Cite this paper
Alzanki, T.H., Kandil, K.M., Alenezi, M.R. and Ghoneim, A.A. (2018) Environmental Impacts of Grid Connected High Concentrated Photovoltaic Systems Adapted for Peak Load Minimization in Hot Climate. Smart Grid and Renewable Energy, 9, 237-258. https://doi.org/10.4236/sgre.2018.911015
References
- 1. Bett, A.W., et al. (2007) The Needs of Industrialization for CPV Technologies. 4th International Conference on Solar Concentrators for the Generation of Electricity or Hydrogen, San Lorenzo del Escorial, Spain, 12-16 March 2007, XLIV-LIV.
- 2. Reis, F., Pina, L., et al. (2011) LCOE Analysis as a Decision Tool for Design of Concentrated Photovoltaic Systems. 26th European Photovoltaic Solar Energy Conf. and Exhibition, Hamburg, Germany, 5-9 September 2011, 4581-4583.
- 3. Gombert, A., Heile, I., Wullner, J., Gerstmaier, T., van Riesen, S., Gerster, E. and Rottger, M. (2010) Field Performance of FLATCON Power Plants and Demo Systems. Proceedings of the 6th International Conference on Concentrating Photovoltaic Systems (CPV-6), Freiburg, Germany, 7-9 April 2010, 243-247.
- 4. Gordon, R., Kinsey, G.S., Nayak, A.B. and Garboushian, V. (2010) CPV 30% Module Efficiency Milestone. Proceedings of the 6th International Conference on Concentrating Photovoltaic Systems (CPV-6), Freiburg, Germany, 7-9 April 2010, 171-174.
- 5. Reis, F., Wemans,J., et al. (2011) Photovoltaic Potential in Terceira Island (Azores). 26th European Photovoltaic Solar Energy Conf. and Exhibition, Hamburg, Germany, 5-9 September 2011, 4317-4319.
- 6. Shanks, K., Senthilarasu, S. and Mallick, T.K. (2016) Optics of Concentrated Photovoltaics: Trends, Limits, and Opportunities for Materials & Design. Renewable and Sustainable Energy Review, 60, 394-404. https://doi.org/10.1016/j.rser.2016.01.089
- 7. Olivier, R. (2016) Simulation of a Through Cell via Contacts Architecture for HCPV Multi-Junction Solar Cells. Solar Energy Materials & Solar Cells, 144, 173-180. https://doi.org/10.1016/j.solmat.2015.08.032
- 8. Xing, X., et al. (2016) Numerical Simulation and Experimental Validation of a High Concentration Photovoltaic/Thermal Module Based on Point-Focus Fresnel Lens. Applied Energy, 168, 269-281. https://doi.org/10.1016/j.apenergy.2016.01.077
- 9. Dominguez, C., Anton, I. and Sala, G. (2010) Solar Cell Model for Translating IV Characteristics as a Function of Irradiance, Spectrum and Cell Temperature. Progress in Photovoltaics: Research and Applications, 18, 272–284.
- 10. Segev, G., Mittelman, G. and Kribus, A. (2012) Equivalent Circuit Models for Triple-Junction Concentrator Solar Cells. Solar Energy Materials & Solar Cells, 98, 57-65. https://doi.org/10.1016/j.solmat.2011.10.013
- 11. Ben Or, A. and Appelbaum, J. (2013) Estimation of Multi-Junction Solar Cell Parameters. Progress in Photovoltaics: Research and Applications, 21, 713-723.
- 12. Reinhardt, K.C., Mayberry, C.S. and Lewis, B.P. (2000) Multi-Junction Solar Cell Iso-Junction Dark Current Study. Conference Record of the 28th IEEE Photovoltaic Specialists Conference-2000 (Cat. No.00CH37036), Anchorage, AK, 15-22 September 2000, 1118-1121.
- 13. Nishioka, K., Sueto, T., Uchina, M. and Ota, Y. (2010) Detailed Analysis of Temperature Characteristics of an InGaP/InGaAs/Ge Triple-Junction Solar Cell. Journal of Electronic Materials, 39, 704-708. https://doi.org/10.1007/s11664-010-1171-y
- 14. Rodrigo, P., Fernandez, E., Almonacid, F. and Perez-Higueras, P. (2014) Review of Methods for the Calculation of Cell Temperature in High Concentration Photovoltaic Modules for Electrical Characterization. Renewable Sustainable Energy Review, 38, 478-488. https://doi.org/10.1016/j.rser.2014.06.008
- 15. Goldstein, L., Mortensen, J. and Trickett, D. (1999) Grid-Connected Renewable Electric Policies in the European Union. NREL Report NREL/TP.620.26247. https://doi.org/10.2172/9790
- 16. Swezey, B. and Bird, L. (2001) Utility Green Pricing Programs What Defines Success? NREL Report No. NREL/TP.620.29831.
- 17. Chokmaviroj, S., Wattanapong, R. and Suchart, Y. (2006) Performance of a 500 kWP Grid Connected Photovoltaic System at Mae Hong Son Province, Thailand. Renewable Energy, 31, 19-28. https://doi.org/10.1016/j.renene.2005.03.004
- 18. Mondol, J., Yigzaw, G., Yohanis, G. and Norton, B. (2007) Comparison of Measured and Predicted Long Term Performance of Grid a Connected Photovoltaic System. Energy Conversion and Management, 48, 1065-1080. https://doi.org/10.1016/j.enconman.2006.10.021
- 19. Wenger, H., Hoff, T. and Perez, R. (1992) Photovoltaics as a Demand-Side Management Option: The Benefits of a Utility-Customer Partnership. World Energy Engineering Congress, Atlanta.
- 20. Mondol, J., Yigzaw, G. and Norton, B. (2006) Optimal Sizing of Array and Inverter for Grid-Connected Photovoltaic Systems. Solar Energy, 80, 1517-1539. https://doi.org/10.1016/j.solener.2006.01.006
- 21. So, J., Jung, Y., Yu, G., Choi, J. and Choi, J. (2007) Performance Results and Analysis of 3 kW Grid-Connected PV Systems. Renewable Energy, 32, 1858-1872. https://doi.org/10.1016/j.renene.2006.10.003
- 22. Mondol, J., Yigzaw, G., Yohanis, G. and Norton, B. (2009) The Impact of Array Inclination and Orientation on the Performance of a Grid-Connected Photovoltaic System. Renewable Energy, 32, 118-140. https://doi.org/10.1016/j.renene.2006.05.006
- 23. Hamrouni, N., Jraidi, M. and Chérif, A. (2008) New Control Strategy for 2-Stage Grid-Connected Photovoltaic Power System. Renewable Energy, 33, 2212-2221. https://doi.org/10.1016/j.renene.2007.12.021
- 24. Townsend, T.U. (1989) A Method for Estimating the Long Term Performance of Direct Coupled Photovoltaic Systems. M.Sc. Thesis, Mech. Eng. Univ. of Wisconsin, Madison.
- 25. Dussault, J., Gosselin, L. and Galstian, T. (2012) Integration of Smart Windows into Building Design for Reduction of Yearly Overall Energy Consumption and Peak Loads. Solar Energy, 86, 3405-3416. https://doi.org/10.1016/j.solener.2012.07.016
- 26. Vick, B. and Moss, T. (2013) Adding Concentrated Solar Power Plants to Wind Farms to Achieve a Good Utility Electrical Load Match. Solar Energy, 92, 298-312. https://doi.org/10.1016/j.solener.2013.03.007
- 27. Passos, L., Ardemil, J. and Colle, S. (2014) Feasibility Study of Using Domestic Solar Hot Water Systems as Alternative to Reduce the Electricity Peak Demand in Brazil. Energy Procedia, 57, 2487-2495. https://doi.org/10.1016/j.egypro.2014.10.258
- 28. Stathopoulos, N., El Mankibi, M., Issoglio, R., Michel, P. and Haghighat, F. (2016) Air-PCM Heat Exchanger for Peak Load Management: Experimental and Simulation. Solar Energy, 132, 453-466. https://doi.org/10.1016/j.solener.2016.03.030
- 29. Zhuk, A., Zeigarnik, Yu., Buzoverov, E. and Sheindlin, A. (2016) Managing Peak Loads in Energy Grids: Comparative Economic Analysis. Energy Policy, 88, 39-44. https://doi.org/10.1016/j.enpol.2015.10.006
- 30. Gu, Y., Xu, J., Chen, D., Wang, Z. and Li, Q. (2016) Overall Review of Peak Shaving for Coal-Fired Power Units in China. Renewable and Sustainable Energy Reviews, 54, 723-731. https://doi.org/10.1016/j.rser.2015.10.052
- 31. Werminski, S., Jarnut, M., Benysek, G. and Bojarski, J. (2017) Demand Side Management Using DADR Automation in the Peak Load Reduction. Renewable and Sustainable Energy Reviews, 67, 998-1007. https://doi.org/10.1016/j.rser.2016.09.049
- 32. Lv, S., He, W., Zhang, A., Li, G., Luo, B. and Liu, X. (2017) Modelling and Analysis of a Novel Compressed Air Energy Storage System for Trigeneration Based on Electrical Energy Peak Load Shifting. Energy Conversion and Management, 135, 394-401. https://doi.org/10.1016/j.enconman.2016.12.089
- 33. Nazi, W., Royapoor, M., Wang, Y. and Roskilly, A. (2017) Office Building Cooling Load Reduction Using Thermal Analysis Method—A Case Study. Applied Energy, 185, 1574-1584. https://doi.org/10.1016/j.apenergy.2015.12.053
- 34. Klein, S.A., et al. (2013) TRNSYS: A Transient Simulation Program. Version 16, University of Wisconsin, Madison.
- 35. Ghoneim, A.A., Kandil, K.M., Alzanki, T.H. and Alenezi, M.R. (2018) Performance Analysis of High Concentrated Multi-Junction Solar Cells in Hot Climate. International Journal of Sustainable Energy, 37, 294-310.
- 36. Banwell, T.C. and Jayakumar, A. (2000) Exact Analytical Solution for Current Flow through Diode with Series Resistance. Electronics Letters, 36, 291-292. https://doi.org/10.1049/el:20000301
- 37. Jain, A. and Kapoor, A. (2004) Exact Analytical Solutions of the Parameters of Real Solar Cells Using Lambert W-Function. Solar Energy Materials & Solar Cells, 81, 269-277. https://doi.org/10.1016/j.solmat.2003.11.018
- 38. Ghani, F. and Duke, M. (2011) Numerical Determination of Parasitic Resistances of a Solar Cell Using the Lambert W-Function. Solar Energy, 85, 2386-2394. https://doi.org/10.1016/j.solener.2011.07.001
- 39. Ghani, F., Rosengarten, G., Duke, M. and Carson, J.K. (2015) On the Influence of Temperature on Crystalline Silicon Solar Cell Characterization Parameters. Solar Energy, 112, 437-445. https://doi.org/10.1016/j.solener.2014.12.018
- 40. Ghani, F., Duke, M. and Carson, J.K. (2013) Numerical Calculation of Series and Shunt Resistances and Diode Quality Factor of a Photovoltaic Cell Using the Lambert W-Function. Solar Energy, 91, 422-431. https://doi.org/10.1016/j.solener.2012.09.005
- 41. Grey, J.L. (2003) The Physics of the Solar Cells. In: Luque, A. and Hegedus, S., Eds., Handbook of Photovoltaics Science and Engineering, Wiley & Sons, Inc., New York, 61-112. https://doi.org/10.1002/0470014008.ch3
- 42. Ministry of Electricity & Water, Kuwait (2016) Electrical Energy, Statistical Year Book.
- 43. Osborn, D.E. and Collier, D.E. (1996) Utility Grid Connected Photovoltaic Distributed Power Systems.
- 44. Duffie, J.A. and Beckman, W.A. (2013) Solar Engineering of Thermal Processes. 4th Edition, John Wiley & Sons Inc., New York. https://doi.org/10.1002/9781118671603
- 45. AZUR SPACE Solar Power GmbH (2016). http://www.azurspace.com
- 46. Spiegel, R.J., Leadbetter, M.R. and Chamú, F. (2005) Distributed Grid-Connected Photovoltaic Power System Emission Offset Assessment: Statistical Test of Simulated and Measured-Based Data. Solar Energy, 78, 717-726. https://doi.org/10.1016/j.solener.2004.09.010
- 47. Delarue, E. and D’haeseleer, W. (2008) Greenhouse Gas Emission Reduction by Means of Fuel Switching in Electricity Generation: Addressing the Potentials. Energy Conversion and Management, 49, 843-853. https://doi.org/10.1016/j.enconman.2007.06.026
- 48. Hill, R. and Baumann, A.E. (1993) Environmental Costs of Photovoltaics. IEEE Proceedings, 140, 76-80. https://doi.org/10.1049/ip-a-3.1993.0013
- 49. Energy Information Administration (1999) Emissions of Greenhouse Gases in the United States 1998. Chapter 2, Carbon Dioxide Emissions, DOE/EIA-0573(98), Washington DC.
- 50. Nishioka, K., et al. (2006) Annual Output Estimation of Concentrator Photovoltaic Systems Using High-Efficiency InGaP/InGaAs/Ge Triple Junction Solar Cells Based on Experimental Solar Cell’s Characteristics and Field-Test Meteorological Data. Solar Energy Materials and Solar Cells, 90, 57-67. https://doi.org/10.1016/j.solmat.2005.01.011
Nomenclature
A: area (m2)
Eg: energy band gap (eV)
FF: fill factor (FF)
G: global radiation(W/m2)
I: current (A)
Io: dark saturation current (A)
Im: maximum power point current (A)
Isc: short-circuit current (A)
J: current density (A/m2)
Jsc: density of short-circuit current (A/m2)
Jo: density of dark saturation current (A/m2)
kB: Boltzmann constant (1.381 x l0-23J/K)
n: diode ideality factor (?)
Pin: incident power (W)
Pm: maximum power output (W)
q: electron charge (C)
Rs: series resistance (W)
Rsh: shunt resistance (W)
T: temperature (˚C)
Tamb: ambient temperature (˚C)
Tc: solar cell temperature (˚C)
V: voltage (V)
Vm: maximum power voltage (V)
Voc: open-circuit voltage (V)
X: concentration factor (−)
Greek letters
β: solar cell latitude (−)
γ: constant (−)
Δ: T temperature change (˚C)
η: efficiency of the cell (−)