Energy and Power Engineering
Vol. 4 No. 6 (2012) , Article ID: 24589 , 5 pages DOI:10.4236/epe.2012.46051
Market-Based Transmission Expansion Planning
Laboratory of Development of Electric Power Systems, Energy Systems Institute, Irkutsk, Russia
Email: drachev@isem.sei.irk.ru, truf@isem.sei.irk.ru
Received June 20, 2012; revised July 25, 2012; accepted August 8, 2012
Keywords: Electricity Market Modeling; Long-Term Transmission Planning; Social Welfare
ABSTRACT
The paper presents the main features of transmission expansion problem (TEP). In accord with review the aims and influencing factors are defined. The competitive behaviors of market participants, transmission losses, discrete investment costs, various operating conditions are considered in the model. The model is a mixed-integer linear programming formulation for a static TEP in the competitive environment. The presented methodology is applied to six-node system. In order to point out efficiency of the model the results obtained are compared with traditional problem solution.
1. Introduction
Most of the countries started restructuring of the electricity sector two decades ago. The restructuring has resulted in separation of competitive kinds of electricity business and natural monopolies; and development of the wholesale competitive electricity markets based on the incentives of social welfare maximization. In market conditions transmission plays an important role in providing parties with economically efficient open access to the trading. Insufficient transfer capability of transmission lines in some regions of Russia limits commodity exchange and creates significant price disproportions. Nowadays, the tools and models intended for transmission planning do not meet practical requirements of the new market conditions.
1.1. Transmission Planning Approaches
The main goal of transmission expansion planning in regulated power systems is reliable supply of growing consumption. The task of centralized planner is to design the most economical scenario that defines where, when and how many transmission facilities must be installed subject to minimum of investment. Generally, the market approach suggests providing nondiscriminatory, effective and competitive environment for all participants. Particularly, the transmission expansion should achieve the following aims [1]:
1) encouraging and facilitating competition among market participants;
2) providing access to cheap generation;
3) minimizing investment;
4) increasing the system reliability;
5) minimizing environmental impacts.
Due to emergence of independently acting “players” and decrease in coordination of generation and network expansion the planning is related to the uncertainty of future conditions. Since the above mentioned aims should be taken into account the new criteria of planning should differ from the previous ones. Hence, the traditional cost-minimization formulation is no longer suitable to solve TEP in market conditions. In the framework of market approaches there are many techniques [2] for TEP such as long-term financial transmission rights, regulatory mechanisms, etc.
1.2. Review of Publications
Modeling of transmission expansion has been developing since the early 1960s. The reasons for that are formulation of basic principles of power system operation, expansion and control. The detailed analysis of models and studies on transmission expansion planning within the scope of regulated power systems has been carried out in [3]. There are several highlight publications on the transmission expansion problems in market environment [4,5]. Creation of a market model is a complex research problem since it should take into account pricing mechanism; different forms of market trading; various interests of participants, etc. Based on the available models one can mark out the following criteria for transmission expansion [6]:
1) social welfare maximization;
2) investment minimization;
3) investor’s revenue maximization;
4) transmission loss minimization;
5) minimization of power outage costs.
The necessity to take into account many aspects results in creation of multi-objective models in which criteria 3)-5) are one of the problem solving objective. Criterion 1) can be represented as market efficiency loss minimization, minimization of locational marginal price difference, and minimization of congestion costs. At the same time the models with criterion 1) are divided into two types—optimization models and evaluation ones. Optimization models contain cost-based characteristic of transmission that allows one to choose the optimal topology. On the other hand, evaluation models are useful for economic analysis. The models with criterion 2) do not consider the market interaction of participants and are needed to study such factors as reliability and uncertainty.
Allowing for a number of influencing factors makes it possible to solve the problem more accurately. These factors are uncertainty of future conditions; reliability of system operation; discrete character of investment; dynamic nature of problem; technical constraints; various operating conditions of system; environmental impacts. The tools suggested to obtain a solution are classified as mathematical optimization methods (linear, nonlinear, mixed-integer, dynamic programming) and other techniques such as genetic algorithm, game theory, expert system, “greedy” procedure, etc.
Transmission expansion results in positive economical effects such as decreasing of electric energy price and increasing of participants’ profit. In [7] these effects are considered by example of two-node system.
Currently the share of wholesale market in deregulated power system in Russia has reached 100 percent. However, transmission planning is carried out without application of market models and consideration of competition. Therefore, development and practical implementation of such models are a present-day trend in the area of transmission expansion planning. The next section presents a market model that takes into account competitive conditions, discrete investment and various operating conditions of system.
2. Formulation of Transmission Expansion Planning Model
The transmission expansion model is formulated as follows:
maximize objective:
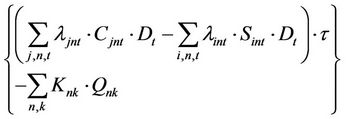 (1)
(1)
subject to constraints:
 (2)
(2)
 (3)
(3)
 (4)
(4)
 (5)
(5)
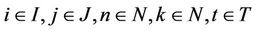
where indices:
i is sellers; j is buyers; n is origin node of line nk; k is destination node of line nk; t is operating condition;
variables:
 are generation and consumption by seller i and buyer j at node n in operating condition t, MWh;
  is power flow in line nk in operating condition t, MWh;
  is the number of new circuits in line nk (mixed-integer variable);
constants:
 are generation offer and demand bid prices, $/MWh;
  is duration of operating condition t, hours;
 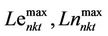 are transfer capabilities of existing lines and new circuits in line nk, MW;
  are minimum levels of generation and consumption under the bilateral contracts, MWh;
  are available generation capacity and load, MW; r is linear loss coefficient, MWh/km;
  is length of line nk, km;
  is investment in circuit nk, $; and
  is payback period, years.
Objective function (1) presents aggregate social welfare (first line in (1)) minus the investment costs of new transmission lines (second line). One-hour social welfare is determined as a spot surplus of consumers minus generation marginal costs. Aggregate welfare is calculated by multiplying surplus of participants by the corresponding duration of time this surplus takes place. Finally, the obtained value is estimated over a payback period of transmission line. In other words, the model evaluates economic effect of line construction on market. If the effect is larger than the investment there is much to gain from the transmission expansion.
Constraint (2) is a node balance according to the Kirchhoff’s current law. Dual variable of node balance is the locational marginal price (LMP) at node n in operating condition t. Equation (3) defines the upper bound of power flow in line nk. Note, that mixed-integer variable equals 1 if power flow in line nk is nonzero, and equals 0 otherwise. Constraints (4)-(5) describe generation and load capacities of producers and consumers; and set up the minimum values of bilateral transactions (if needed) accordingly.
Thus, problems (1)-(5) is a mixed-integer problem. The variables for each operating condition are generation, load, power flows and the final decision whether to expand the existing line or construct new ones or do nothing. All variables are positive.
3. Case Study
3.1. Data
The presented model was applied to the six-node Garver’s system [8] for testing purposes. The data used in the example are particularly taken from [9]. Economic analysis implies consideration of problem solving from different perspectives of market participants and is compared with a traditional model solution. Producers and consumers send offers and bids to the commercial market operator (CO) to participate in auction in order to maximize profit. CO gets offers and bids and sorts offers in ascending order and bids in descending order. The cross point represents an equilibrium value and price of electric energy traded for each node of system.
The considered system (Figure 1) consists of six nodes; initially node 6 is isolated from the main system. Market structure includes independent generators-sellers, consumers-buyers and transmission company (TC). Table 1 shows generation data, namely locations, available capacities and price offers. Table 2 shows similar information about load demands. Each node contains five consumers with different loads and bids (note that in this case study the values of basic load are half the size of bids in [9]). Thereby, based on the data from Tables 1 and 2 it is possible to construct supply and demand curves. Data on transmission line are presented in Table 3 in which the seventh column shows whether the line initially exists (1) or not (0). Investment costs depend on line length and for the sake of simplicity equal one million dollars per kilometer.

Figure 1. Six-node Garver’s system.
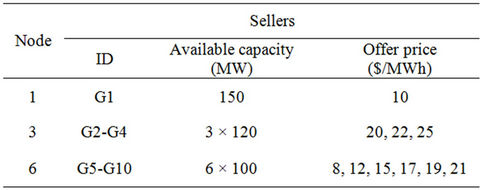
Table 1. Generation data.

Table 2. Demand data.
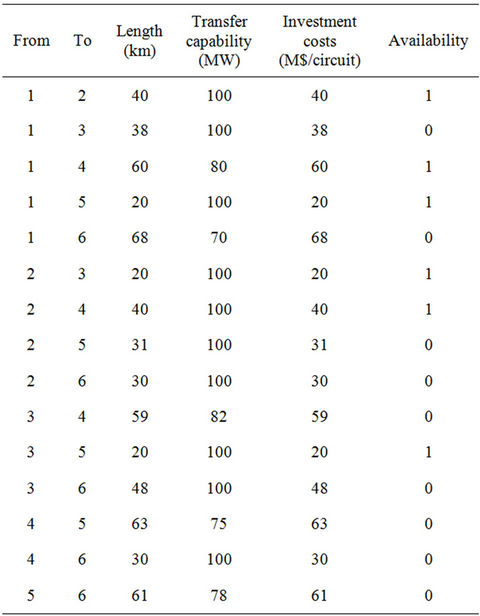
Table 3. Line data.
In the example four operating conditions are considered. Each operating condition is described by its duration and load coefficient. Table 4 presents characteristics of operating conditions. The payback period considered is 10 years.
For example, to calculate demand of consumers located at node 1 in operating condition 4, the corresponding load coefficient (1.7) is multiplied by basic load (40 MW in Table 1). Thereof impossibility to take into account all details of system operation while modeling makes it necessary to introduce a number of simplifications:
1) dispatch of reactive power is not considered;
2) transfer capability of line is assumed as reference data;
3) market with perfect competition is considered.
3.2. Traditional Problem Solution
The traditional approach implies supply of growing consumption at minimum investment costs, the security considerations being taken into account. Initial data in the scope of the traditional approach are available capacities of generators, values of maximum loads and transmission line characteristics. The solution obtained is as follows: construction of two new lines connecting nodes 6 and 4 and increase in transfer capability of existing lines 2 - 3 and 3 - 5. Investment costs are $100M. Graphically the solution is presented in Figure 2 (by dashed lines).
In the main part of the system in operating condition 4 the shortage of 136 MW of generating capacity arises that causes construction of two cheapest lines from generating node 6. At the same time the capacity of generators at node 3 is constrained by transfer capability of lines 2 - 3 and 3 - 5 and therefore, reinforcement of these lines is needed.
3.3. System without Expansion
Analysis of system functioning without transmission expansion is essential to quantitatively estimate future results. For that reason problems (1)-(5) is solved on the assumption that no lines can be built using initial data in Tables 1-4. In the five-node part of the system in operating conditions 1 and 2 the load increases at all nodes

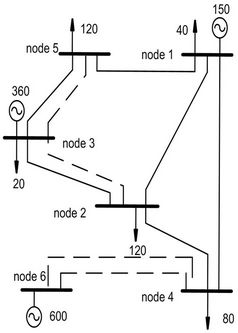
Figure 2. Solutions for the problem: left—traditional model, right—market model.
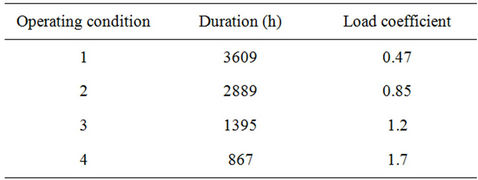
Table 4. Characteristic of operating conditions.
except node 3. At this node the maximum bid of consumers D11-D15 is below the market price. Therefore, it is profitable for generators to sell energy in different nodes. In operating conditions 3 and 4 consumption of nodes 4 and 5 decreases due to unavailability of consumers D15-D25 to pay an increasing price. Thus, consumers D1-D10 having the highest bids are “ousting” the others from the market. Increasing load in the system is covered by generators G2 and G3. G1 is always in operation due to the lowest generation costs ($10/MWh). The annual surpluses of market participants are (in M$): sellers—14.3, buyers—12 and TC—1.2. The social welfare is 27.5. Efficiency of trading can be enhanced by connection of isolated node 6 with cheap generators.
3.4. Expansion in the Market Conditions
As opposed to the traditional approach, transmission expansion planning in the market conditions takes into consideration possibility of participants to generate/consume electric energy according to its price. The aim of expansion is to increase trade efficiency. In these conditions the load of each consumer depends on both technological facility and availability to pay. Producers also load their generators in accord with costs and benefits, until it is profitable for them. Consequently, in the market conditions participants will not close losing bargains.
The results of solving problems (1)-(5) are: construction of two new one-circuit lines with the investment costs of $60M. Transmission lines connect node 6 to nodes 2 and 4, allowing the electric energy generated by G5-G6 to be consumed by all nodes of the system. Construction of the lines results from competition of cheap generators at node 6 with others. In operating condition 1 G1 and G2 decrease generation. Then, with load growth the generators are loaded in the following order—G5- G1-G6-G3.
Table 5 presents solution results. All indices are annual values.
There are three problems solution confronted. The solutions are compared in terms of values of production, consumption, invested costs and surpluses.
3.5. Economic Analysis
From the economic standpoint the solution obtained by

Table 5. Summary results.
using the market approach can be analyzed from the position of producers (in M$ per year): costs –28.7, revenue –36.5, surplus –7.8 (21.4% of revenue). Transmission expansion decreased generators’ surplus by 45.5% due to substitution of expensive generators (G1-G3) by relatively cheap ones (G5-G6). From the standpoint of consumers the solution is (in M$ per year): costs –41.2, utility –68.6, surplus –27.4 (40% of utility). Consumers that got access to cheap generators at transmission expansion increased their surplus by 128%. Consumers and producers buy and sell electric energy at their LMP that equals the local marginal cost of production. In the case of line congestion the sufficient price difference arises between nodes of the congested line. Congested lines create a merchandising surplus. Annual merchandising surplus is $4.7M. Summing up all the participants’ surpluses and subtracting the amount of investment costs, the social welfare will make up $339M. Efficiency of expansion is evaluated as the change in the social welfare due to the line expansion divided by the amount of investment costs. For the market approach the efficiency is calculated as follows: (399 − 275)/60 = 2.07 that is one dollar invested in expansion benefits 2.07 dollars as social welfare.
3.6. Comparison of Results
The results obtained by the traditional model (namely, amounts of electric energy traded and network topology) are transferred to the model of market functioning and the calculated values are placed in Table 5 in the section “Traditional model”. Electric energy produced and consumed is lower in the market approach. Decrease of production is a result of unavailability of some consumers to pay market price due to the lowest bids. The number of such consumers in operating condition 1 is 1, in 2 - 4, in 3 - 8, and in operating condition 4 is 13. The aggregate social welfare in the traditional solution decreases by 15% because of overinvestment and negative surpluses of the following buyers: D4, D5, D10-D15, D19, D20, D23-D25. Efficiency of the approach is (391 − 275)/100 = 1.16.
4. Conclusion
The transmission expansion planning model is presented. The model allows to take into account discrete character of investments, various operating conditions while simulating market conditions. The objective is to maximize social welfare. The methodology is applied to the Garver’s six-node system. The results obtained are compared with traditional cost-minimization solution. An economic analysis demonstrates that application of market model allows making well-grounded and quality decisions.
REFERENCES
- M. O. Buygi, H. M. Shanechi and M. Shahidehpour, “Transmission Planning in Deregulated Environment,” International Journal of Engineering, Vol. 15, No. 3, 2002, pp. 249-256.
- J. Rosellon, “Different Approaches towards Electricity Transmission Expansion, Centro de Investigacion y Docencia Economicas and Harvard University,” Review of Network Economics, Vol. 2, No. 3, 2003, p. 32.
- G. Latorre, R. D. Cruz, J. M. Areiza and A. Villegas, “Classification of Publications and Models on Transmission Expansion Planning,” IEEE Transactions on PWRS, Vol. 18, No. 2, 2003, pp. 938-944.
- P. Joscow and J. Tirole, “Merchant Transmission Investment,” University of Cambrige, Cambrige; Massachusetts Institute of Technology, Cambridge, 2003.
- W. Hogan, “Market-Based Transmission Investments and Competitive Electricity Markets,” Center of Business and Government, J. F. K. School of Government, Harvard University, Cambrige, 1999.
- P. Drachev, “Modelling of Transmission System Expansion in Competitive Conditions,” Proceedings of 2011 Control, Information, Optimization in Electrical Power Systems, Novosibirsk, 21-24 September 2011, pp. 75-85.
- P. Drachev, “Transmission Expansion in Market Conditions,” Proceedings of 2010 System Research in Power Engineering, Irkutsk, 21-28 March 2010, pp. 21-30.
- L. L. Garver, “Transmission Network Estimation Using Linear Programming,” IEEE Transactions on Power Application System, Vol. PAS-89, No. 7, 1970, pp. 1688- 1697. doi:10.1109/TPAS.1970.292825
- S. de la Torre, A. J. Conejo and J. Contreras, “Transmission Expansion Planning in Electricity Markets,” IEEE Transactions on PWRS, Vol. 23, No. 1, 2008, pp. 238-248.