Energy and Power Engineering
Vol.6 No.5(2014), Article ID:45563,13 pages DOI:10.4236/epe.2014.65008
Feasibility Study of Optimal Sizing of Micro-Cogeneration System for Convenience Stores in Bangkok
Suapphong Kritsanawonghong1, Weijun Gao1, Pawinee Iamtrakul2
1Department of Architecture, Faculty of Environmental Engineering, The University of Kitakyushu, Kitakyushu, Japan
2Department of Urban Environmental Planning and Development, Faculty of Architecture and Planning, Thammasat University, Pathum Thani, Thailand
Email: suapphong@yahoo.com
Copyright © 2014 by authors and Scientific Research Publishing Inc.
This work is licensed under the Creative Commons Attribution International License (CC BY).
http://creativecommons.org/licenses/by/4.0/


Received 22 March 2014; revised 22 April 2014; accepted 29 April 2014
ABSTRACT
In this paper, the optimization of micro-cogeneration (µ-CHP) system sizing for convenience stores in Thailand is conducted under the present condition of fuel prices and tariff rates. The assessment of (µ-CHP) system performance is analyzed by using Primary Energy Saving (PES) Ratio for evaluating the energy performance. Also, the Annual Cost Saving Ratio (CSR) and Payback Period (PBP) are used for evaluating the economic performance of µ-CHP system. The analysis results show the optimal size of µ-CHP system under possible conditions including the operating schedule and system’s efficiency were conducted.
Keywords:Convenience Stores, Micro-Cogeneration System, Energy Efficiency, Economic Assessment, Thailand

1. Introduction
The utilization of alternative energy is one of the effective methods to improve the energy efficiency and reduction of primary energy demand, i.e. the implementation of PV system or other available energy sources in each area. Cogeneration, which was also called Combined Heat and Power or CHP, is the high efficient system to generate power (electricity) and thermal energy from a single fuel source. The CHP system has been widely used as the effective technology for power generation with lower cost and also reduced environmental emissions [1] [2] . CHP system is also recognized as the key alternative for de-centralized power generation in order to improve the nation’s energy security, i.e. Thailand, the energy consumptions for most residential and commercial buildings are supplied from centralized power generation plant over the electricity grid. From the previous studies [3] [4] , the utilization of CHP system for Thailand’s commercial buildings by using gas engines together with absorption chillers, this system is effective method in order to reduce Thailand’s peak generation requirements.
The success of CHP system is well proven in industrial and large-scale applications and is being further investigated to meet the needs of small-scale commercial and residential applications [5] . Many studies have been reported on this topic. H. Ren et al. [1] developed the nonlinear programming model to minimize the annual cost of energy system for residential building which equipped with the CHP plant integrated with the storage tank and a back-up boiler in order to introduce the optimal sizing for CHP system and storage tank from the consideration of economic assessment. The results showed that capital cost, energy prices and electricity buy backs are the significant parameters affecting the optimal sizing of CHP capacity. Sizing of the storage tank is also affected by the operating time of CHP plant and tariff structure. Rusbeh R. and Reinhard H. [6] investigated the optimal configuration of micro-cogeneration systems for residential buildings in Austria by the minimization of heat generation costs (investment, operational and maintenance costs) and embedded energy (for manufacturing and operation of micro-cogeneration plants). The results showed that the substitution of reference system with a dual system result in a higher efficiency in the heat supply of buildings for both economic and energy saving concerns. Kyle S. et al. [7] evaluated the economic improvement from the introduction of small-scale cogeneration system for the hospital in New Jersey by considered the expected returns from demand response, capacity and regulation markets, pricing CO2 emissions and net metering. It was found that the uncertainty of fuel and electricity prices is the significant risk to cogeneration projects but can be mitigated by the feed-in tariffs system. Sun, Z.-G. [8] studied energy efficiency and economic analysis of the cogeneration system driven by gas engine in China by compared the Primary Energy Rate (PER) and primary energy saving to evaluate the performances with conventional system. It is found that at the required energy flows, the comparative primary energy saving of the cogeneration system is more than 37% compared to conventional system. Furthermore, the payback periods of the cogeneration system are 4.52 and 2.65 years based on energy prices in Jiangsu Province and Sichuan Province, respectively. The research studies of CHP system for commercial buildings in Thailand are also implemented by Somcharoenwattana, W., et al. [9] , the authors studied the potential of the implantation of natural-gas cogeneration for public buildings in Thailand upon the completion of the natural gas pipeline plan in the city in 2020. The authors have proved in some buildings such as Thailand’s Suvarnabhumi Airport, the overall efficiency and primary energy saving can be improved by 10% and 24%, respectively, and electricity can be sold back to the grid to gain more revenue [9] . The benefits of the implementation of the co-generation system integrated with an absorption chiller in the Supercenter Building in Thailand have been studied from Sommart and Chullapong [10] by varying 2 types of cogeneration systems and 3 types of absorption chillers by considering the payback period as the economic assessment index. The results showed that the average payback period is about 8.9 - 35.5 years from the integrated system between gas turbine cogeneration with all absorption chillers.
From the above review of previous studies, there is no research on the effects of a CHP system for convenience stores in hot countries. Therefore, the objective of this paper is to show how to utilize the micro-cogeneration (µ-CHP) system for convenience stores in Bangkok, Thailand by using sensitivity analysis in view point of energy and economic performances. The structure of the remainder of this paper is as follows: Section 2 describes the basic information of case study including energy demand and utility tariff. In Section 3, the outline of analytical model and analysis of evaluation indexes are described. Parameters for the analysis methods are illustrated in Section 4. Section 5 describes the analysis results through the sensitivity analysis. Finally, Section 6 draws the conclusions of the paper.
2. Description of the Case Study
2.1. Store’s Energy Demand
In this study, on-site investigation of energy demand has been done in separated system throughout the year 2011; equipment energy system and air-conditioning (A/C) system, by installed the power meter on the panel board of the store. Figure 1 shows the hourly energy demand, represented by load-duration curve (monotonic curve) pattern which starting with largest to smallest consumption values for 1-year consumption of cooling and equipment (including lighting) demands, respectively.
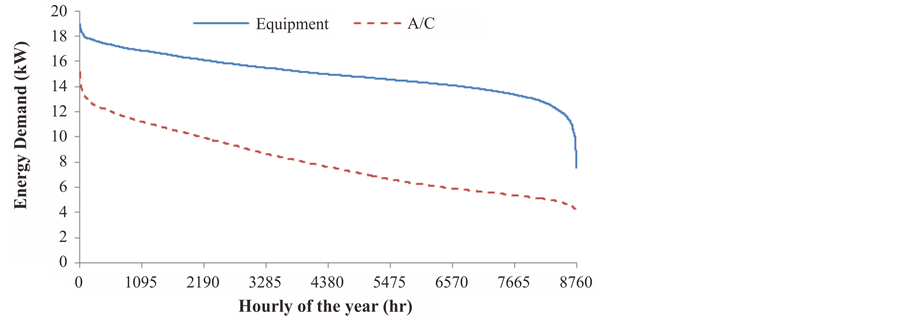
Figure 1. Load duration curves of equipment and cooling demand of the store.
Lighting system of the store consumes stable energy consumption which composed of 138 36-Watt fluorescent lamps and 8 18-Watt fluorescent lamps. The energy consumption from the equipment system in this study includes the energy demand from the refrigerating system and heating systems. A/C system of the store composed of 5 A/C units with a capacity 44,000 BTU (7.08 kW) which operated inside sales area only.
2.2. Utility Tariffs
Utility electricity and gas tariffs are the key parameters that need to take into account for the calculation in order to analyze the economic benefits of the µ-CHP implementation. Because of the present situation has no city gas pipeline, therefore, gas tariff information in this study is assumed to be the same rate for industrial customers as 350 THB/MMBTU which provided by PTT Public Co. Ltd. only. If the city gas pipeline is successfully implemented in 2020 [9] , the gas utility company can be provide gas tariff rate in cheaper price than the present in order to encourage customers to use gas as the alternative energy for both residential and commercial sectors.
Electricity service in Bangkok and vicinity areas is mainly provided by Metropolitan Electricity Authority (MEA) [11] . Electrical energy utilization of Thailand’s convenience store can be considered for electricity tariff as the “Medium General Service”, a time of use (TOU) tariff rate is applied for the store. The electricity change is imposed a variation by time (day time and night time) and also for holiday consideration (weekend and weekday period). Calculation of electricity tariff in this study is shown in Equation (1).
 (1)
(1)
where EC is electricity charge which vary by time of utilization as illustrated in Figure 2. ES and ED are service charge and demand charge, which are equal to 312.24 THB/month and 196.26 THB/kW, respectively. h, d, and m denote hours in a day, days in a year, and months in a year, respectively. The Automatic Tariff Adjustment (Ft) is the mechanism for adjusting the power tariff which reflects the policy expense and the fuel cost of power generation at a given period of time [11] .
3. Methodology
Figure 3 illustrates the outline of the model used for the calculation. In order to satisfied the target of optimal sizing from the results of energy efficiency and economic assessment analysis, 5-major parameters are considered as the input data—energy requirements of the store, hourly load demand profile, prime mover technology (gas engine is considered in this case), hypothesis and methodology for assessment, and fuel price & tariff scenario.
3.1. Modeling of Micro-Cogeneration System
According to end-used demand data of hourly electrical energy consumption from on-site measurement data, the comparative study between conventional system and µ-CHP system is executed by using conventional system as a baseline. The energy flows of both systems are illustrated in Figure 4. Two major energy demands have been considered in this study—direct electrical energy demand (from equipment and other sys-
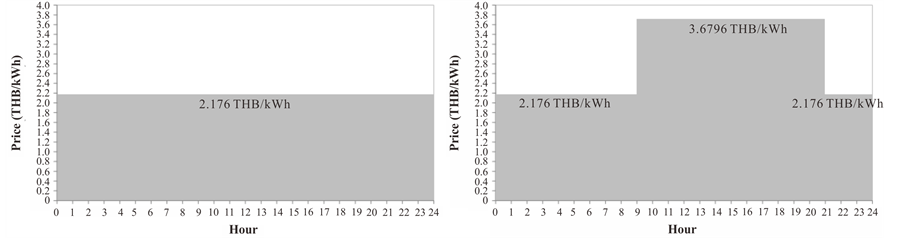
Figure 2. Energy charge for TOU rate of the store.
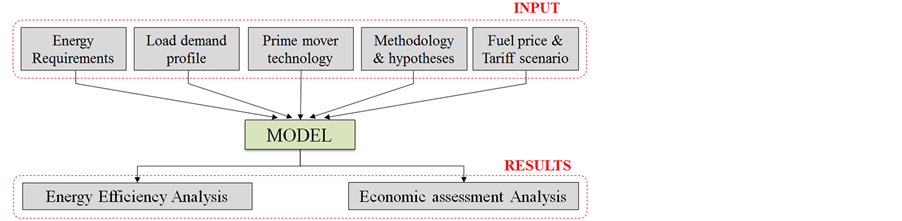
Figure 3. Outline of the model for calculation.
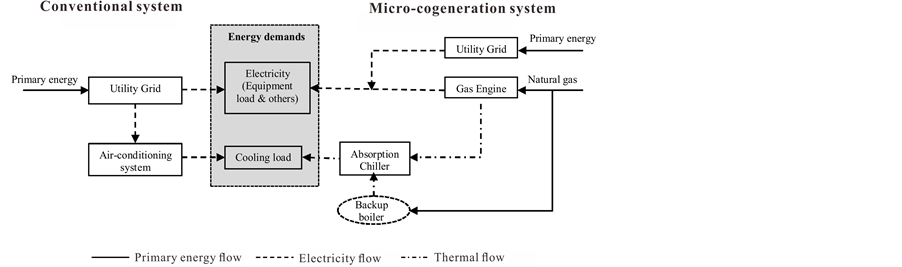
Figure 4. Conventional energy supply system and micro-cogeneration energy supply system.
tems) and cooling demand (from A/C system). Three major energy flows, namely, primary energy flow, electricity flow, and thermal flow are executed in different stages as shown in Figure 4.
In conventional system, all of the electrical energy demand either direct power consumption for equipment system or space cooling via the operation of A/C system is employed by utility grid only. For µ-CHP system, we used gas engine as the prime mover and absorption chiller as two major components in order to meet the energy demands either electricity or cooling demands. The gas engine is used to meet the electrical load for equipment system and also meet the cooling load with the use of A/C system through the operation of absorption chiller. It is noted that, if the recovery of thermal energy from gas engine does not completely satisfy the absorption chiller’s needs, a backup-boiler is used. Otherwise, the surplus energy is released into the atmosphere in case of recovery of thermal energy exceeds the load demands.
3.2. Energy Efficiency Index
In this study, the evaluation index for energy efficiency is expressed by the calculation of the primary energy saving ratio (PES). The PES is defined as the ratio of the difference between primary energy input in the conventional energy system and the µ-CHP system to the primary energy input in the conventional system which can be expressed in Equation (2).
 (2)
(2)
where QCONV and QµCHP are the primary input in the conventional energy system and the µ-CHP system, respectively. In this study, total annual primary energy consumption of the conventional system composed of the power consumption for electricity and cooling loads, total primary energy consumption of the µ-CHP also composed of the electrical energy consumption from utility grid, on-site power generation, direct fuel combustion for back-up boiler. Equation (3) illustrated the final formula for calculation of PES value.
 (3)
(3)
where  and
and  are the electricity load and the space cooling of the store, respectively. hGRID denotes the efficiency of the utility grid.
  is the coefficient of performance of A/C system which utilized in conventional system.
  and
and  are the power purchased from the utility grid and power generation of the µ-CHP system, respectively.
  is the purchased power from natural gas supply for back-up boiler in order to satisfy the heat demand for absorption chiller. hE and hBOILER denote the electricity efficiency of the µ-CHP system and the efficiency of back-up boiler, respectively.
3.3. Economic Assessment Index
In this study, cost saving ratio (CSR) is used as one of economic assessment index which express the profitability of the µ-CHP system and also defined as the rate of total energy cost difference between the µ-CHP and the conventional system to the annual energy cost of the conventional system, as illustrated in Equation (4).
 (4)
(4)
where CCONV and CµCHP are the annual energy cost of the conventional system and µ-CHP system, respectively. Both energy costs are mainly composed of the combination between investment cost (initial cost) and running costs which can be defined as Equations (5) and (6):
 (5)
(5)
 (6)
(6)
where ,
,  are annualized investment cost and electricity purchase (running cost), respectively for conventional system.
 ,
,  ,
,  are the annualized investment cost, utility grid electricity cost (running cost), and city gas cost (running cost), respectively, for the µ-CHP system.
Annual investment costs of conventional and µ-CHP systems are described in Equations (7) and (8). Investment cost is calculated from the annualized capital cost which spreading the initial cost of an option across the life time of that option while accounting for the time value of money. The cost of capital is annualized as if it were being paid off as a loan at a particular interest of discount rate over the life time of the option [12] .
 (7)
(7)
 (8)
(8)
where ,
,  ,
,  denote capital cost of A/C system, absorption chiller, and µ-CHP, respectively.
 ,
,  ,
,  denote the machine’s capacity of A/C system, absorption chiller, and µ-CHP, respectively. I indicates the interest rates of each machine.
 ,
, , and
, and  illustrate the life time of the A/C system, absorption chiller, and µ-CHP system, respectively. The investment cost for conventional system in this study is considered for A/C system only. On the other hand, the consideration of absorption chiller and µ-CHP system are taken into account for determine the investment cost of µ-CHP system. The annual running cost conventional system and µ-CHP system are described in Equations (9) to (11). Calculation of running cost is mainly from the cumulative fuel consumption for each period of both systems multiplied by the fuel price.
 (9)
(9)
 (10)
(10)
 (11)
(11)
where ,
,  ,
,  denote hourly electricity load of A/C system, equipment demand, and µ-CHP, respectively.
  and
and  are electricity price and gas price.
  is heat load input to boiler, kW. HR denotes the heat rate, kWh/m3. ηE and ηBOILER are electricity efficiency of µ-CHP boiler efficiency, respectively.
The payback period (PBP) is one of widely accepted method for assess economic performance, is also employed in this study. It reflects the length of time required for a project to return its investment through the net savings realized which can be reflect the time frame necessary for the net energy cost saving to pay the installation cost of µ-CHP system. Calculation of payback period [13] can be illustrated in Equation (12):
 (12)
(12)
where ,
,  are investment cost of µ-CHP and conventional system, respectively.
 ,
,  denote the running cost (purchase cost) of electricity for conventional and µ-CHP and gas for µ-CHP system only.
4. Parameters and Data Assumptions
The technical data for this analysis are summarized in Table 1.
5. Results and Discussions
5.1. Analysis Results of Energy Performance
Evaluation of reasonable μ-CHP capacity in order to maximizing the energy efficiency, the electrical efficiency (hE) and thermal efficiency hH) of µ-CHP system is assumed to be 35% and 45%, respectively. The demand from equipment and cooling load has a direct effect on the selection of the size of the prime mover. Finally, the calculation of optimal sizing of prime mover by considering the PES value is performed.
Zone A in Figure 5 denotes the amount of electricity that is still needed from the utility grid. It was found that increasing the µ-CHP capacity can supply the much more electricity for equipment demand which represented in the reduction in zone A. When the capacity is higher than 18 kW, full electricity for equipment can be produced by a µ-CHP system, which means the store is totally independent of the grid electricity supply.
As illustrated in Figure 6, effect of thermal energy utilization from cooling load demand and load supply from µ-CHP system can be divided into 3 zones, namely Zone X, Y, and Z. Zone X represents the amount of recovery heat which is produced by the µ-CHP system. Zone Y denotes the amount of heat from the back-up boiler which provides additional heat to produce the cooling energy. Zone Z is the amount of waste heat which is produced from the µ-CHP system that exceeds the requirements, and which is released into the atmosphere. It can be seen that increasing of the µ-CHP capacity will increase the area of Zone X, reduce the size of Zone Y, and increase the area of Zone Z. The reasons can be described by the large amount of cooling demand can be satisfied by recovery
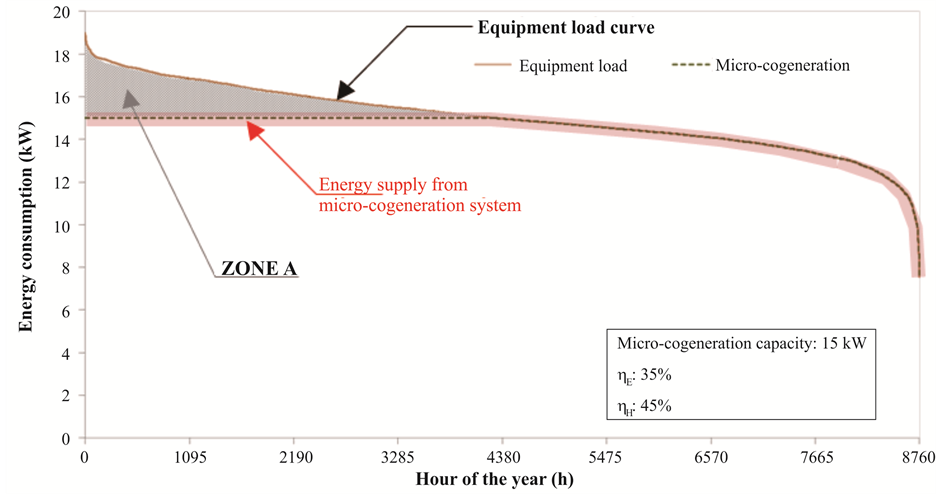
Figure 5. Load duration curves of equipment demand and energy supply from µ-CHP system.

Figure 6. Load duration curves of cooling demand and energy supply from µ-CHP system.
heat from the µ-CHP system. Also, a lot of surplus heat will be released into the environment (Zone Z). From the viewpoint of making good use of recovery heat, the optimum capacity of the µ-CHP system is 9 kW, at which the area of Zone Z will be near zero and recovery heat from µ-CHP system is totally used.
For the total performance of the µ-CHP system, below 15 kW of µ-CHP capacity, the increase of µ-CHP capacity results in a significant energy saving and the change of PES value becomes slower when the capac

Table 1. Investigated data and data assumption for the analysis.
ity is above 15 kW. Finally, PES value becomes stable from the utilization of capacity above 18 kW. It is found that, PES value can be increased up to 45% from the variation of the gas engine’s efficiencies.
5.2. Analysis Results of Economic Assessment
5.2.1. Effect of Micro-Cogeneration Capacity to Annual Cost Structure
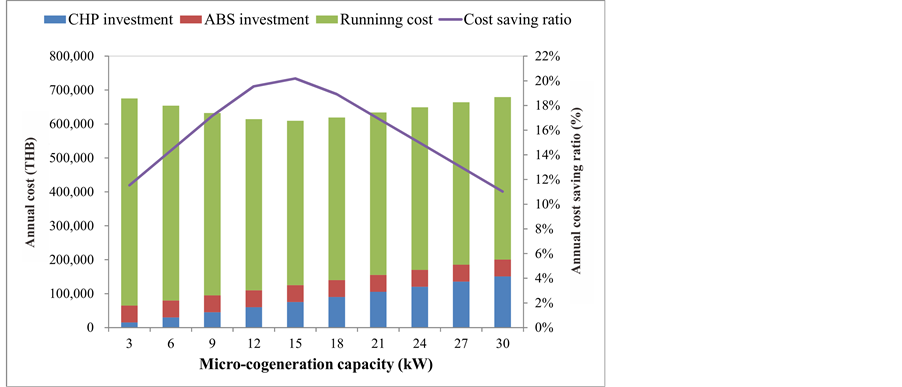
Figure 7(A) shows the estimated investment cost and running cost of µ-CHP and the tendency of annual cost saving ratio (CSR). Investment cost of µ-CHP has linear increase to the capacity. The running cost (purchased energy cost) is decreased as the increase of CHP capacity and become stable from 18 kW or higher capacity. Considering the annual cost saving, increase the capacity of µ-CHP does not always lead to more cost saving. It can be seen that the annual cost saving ratio reaches the maximum point when the capacity of µ-CHP is about 15 kW. A rise of capacity leads to decrease of marginal revenue and the marginal cost is almost constant, which causes the net marginal benefit to decrease from a positive value to a negative one [2]. From the analysis of return on investment for the net energy cost saving to pay for the installation of µ-CHP under the current situation of fuel price for both electricity and natural gas price as shown in Figure 7(B), the optimal solution for capacity selection of µ-CHP is about 12-kW which is obtained about 5.05 years for payback period.
5.2.2. Fuel Price Sensitivity Analysis of Optimal Micro-Cogeneration Capacity
Electricity and gas price are the key parameters influence the decision of implementing the µ-CHP system by considering the economic benefits to judge for the installation and also capacity and efficiencies of µ-CHP system in the convenience store. In this study, the profitability index e.g. Cost saving ratio (CSR) or Payback period (PBP) have been analyzed due effect of the price sensitivity for both gas and electricity in order to find out the optimal capacity for µ-CHP system under the circumstance of price variation in the future.
 (a)
(a)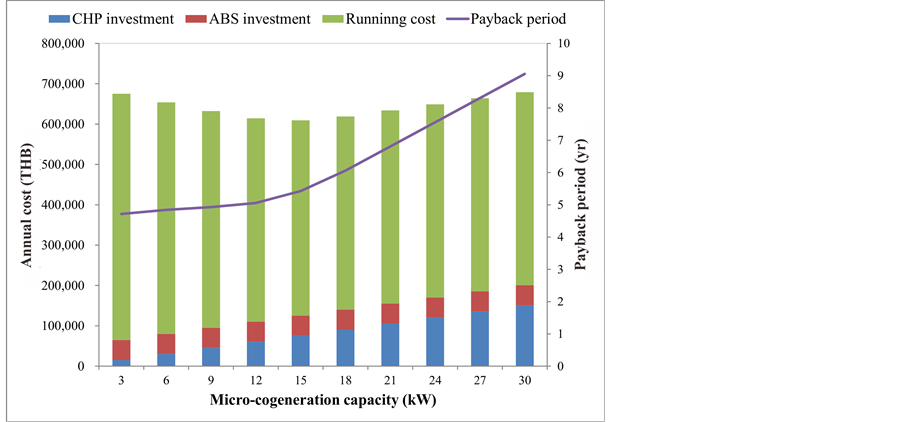 (b)
(b)
Figure 7. Capacities of µ-CHP system from various annual cost structures, CSR, and PBP values. (a) Annual cost structure and CSR value; (b) Annual cost structure and PBP value.
1) Electricity price sensitivity
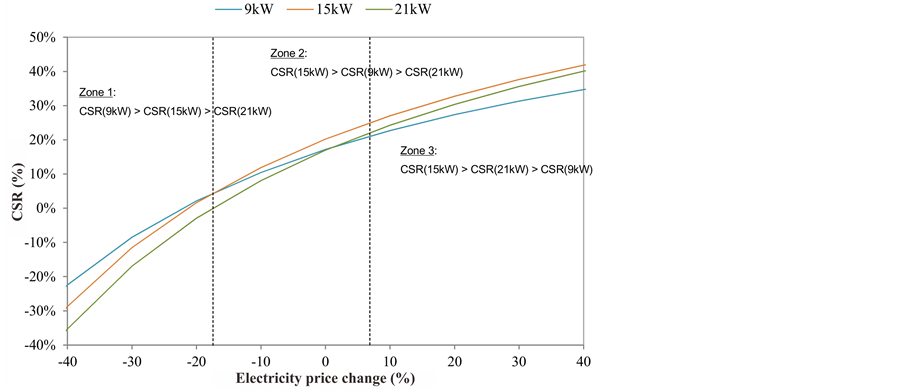
Increasing of electricity price due to the depletion of natural resource for electricity generation is possible in near future. One of main parameter affect the adoption of µ-CHP system to convenience store which related to annual cost saving is about the electricity price. The electricity price is one of the key parameter to induce customer for selection of power purchase from grid or on-site generation. Furthermore, the changing of electricity price is also the parameter affect the selection of optimal size of µ-CHP system as shown in Figure 8.
From Figure 8(a), the zoning of µ-CHP capacity selection by considering the effect of electricity price sensitivity on CSR values are illustrated. It can be seen that if electricity price is decrease about 18 - 40 percent (Zone 1), CSR value from the selection of µ-CHP capacity with 9 kW > that of 15 kW > that of 21 kW. In Zone 2, the electricity price is in the range −18% to +8%, CSR value from the selection of µ-CHP capacity with 15 kW > that of 9 kW > that of 21 kW. However, if the electricity price is increase about 8% - 40% which represented in Zone 3, CSR value from the selection of µ-CHP capacity with 15 kW > that of 9 kW > that of 21 kW. The results from calculation of return on investment through the net savings is shown in Figure 8(b) from the effect of electricity price sensitivity to payback period (PBP) with different µ-CHP capacity. If electricity price is higher,
 (a)
(a)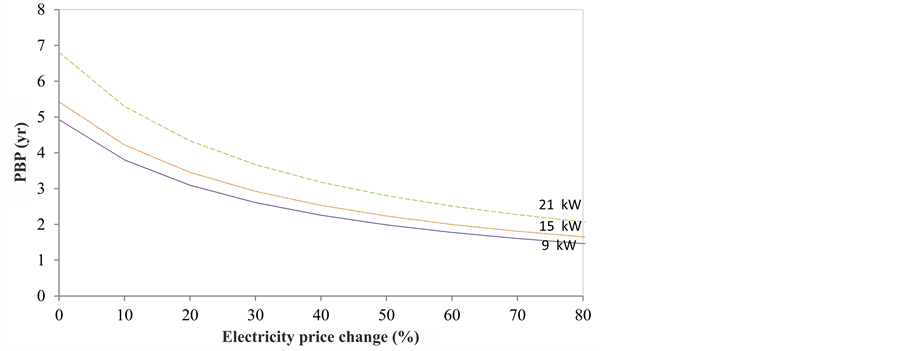 (b)
(b)
Figure 8. Effect of electricity price to optimal sizing of µ-CHP system. (a) Effect of electricity price to CSR value; (b) Effect of electricity price to PBP value.
PBP for all µ-CHP capacity will decrease accordingly in similar tendency due to the consideration of investment cost and running cost of µ-CHP system compared with conventional system as shown in Equation (12).
The sensitivity of electricity price affect the operation of gas engine which consequence to management of the operation time for the utilization of µ-CHP system. Figure 9 shows the effect of electricity price sensitivity to operating time of µ-CHP system in this study, considering the µ-CHP with capacity 15 and 21 kW, if electricity price is increase more than 20 percent, gas engine will operate 24-hr throughout a year in order to minimize the energy cost saving. In contrary, if electricity price is decrease lower than 40%, µ-CHP with 9, 15, and 21 kW capacity will stop for the operation because the customer will better purchase electricity from utility grid. However, in case of 9 kW capacity, gas engine will operate 24-hr throughout a year if electricity rate increase more than 40% from current price.
2) Natural gas price sensitivity
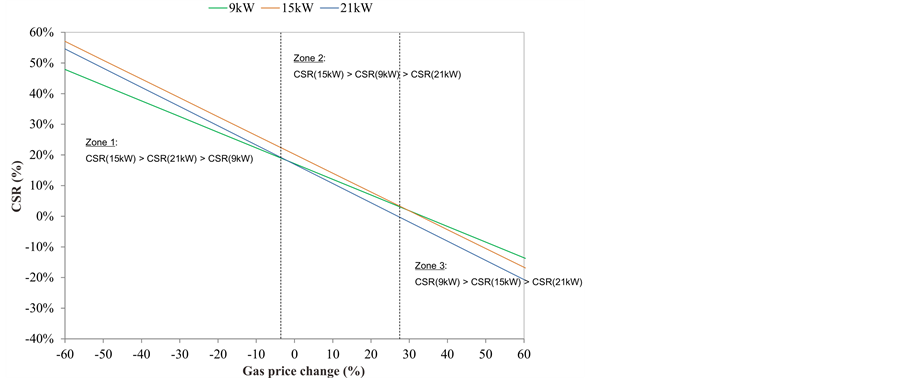
As illustrated in Figure 10(a), contrary to the analysis results from sensitivity of electricity price, higher CSR value can be obtained if gas price is decreasing in linear tendency. However, increasing of natural gas price will also induce customer to purchase electricity from grid rather than utilize µ-CHP by natural gas. It can be seen that zoning of µ-CHP capacity selection by considering the effect of natural gas price sensitivity on annual energy cost saving ratio is also analyze in this study. If natural gas price is decrease about 4 - 60 percent (Zone 1), CSR value from the selection of µ-CHP capacity with 15 kW > that of 21 kW > that of 9 kW. In Zone 2, the
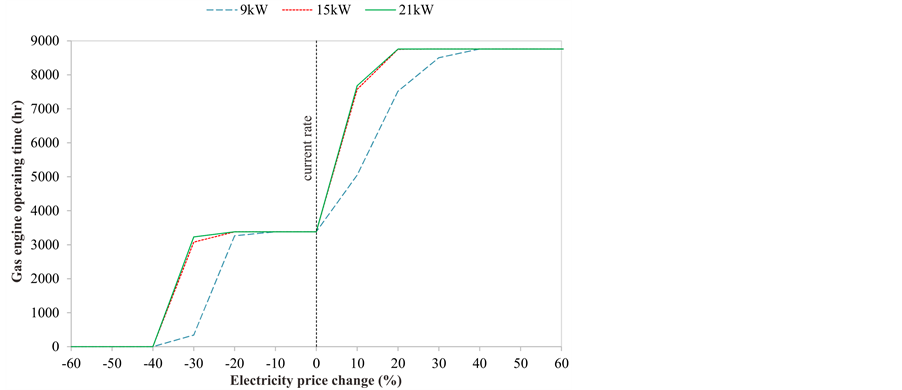
Figure 9. Effect of electricity price and operating time for gas engine.
 (a)
(a)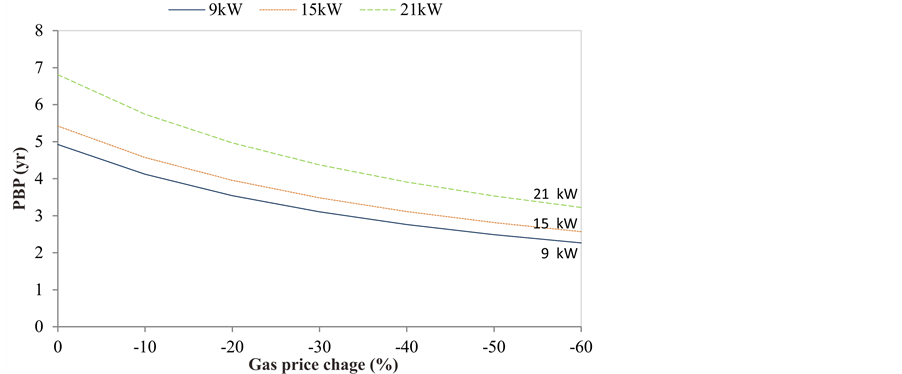 (b)
(b)
Figure 10. Effect of gas price to optimal sizing of µ-CHP system. (a) Effect of gas price to CSR value; (b) Effect of gas price to PBP value.
natural gas price is in the range −4% to +28%, CSR value from the selection of µ-CHP capacity with 15 kW > that of 9 kW > that of 21 kW. However, if the natural gas price is increase about 28% - 60% (Zone 3), CSR value from the selection of µ-CHP capacity with 9 kW > that of 15 kW > that of 21 kW, respectively.
Figure 10(b) shows the effect of natural gas price sensitivity to payback period with different µ-CHP capacity. If natural gas price is lower, payback period for all capacity will decrease accordingly in similar tendency which can be induce for example for investment of µ-CHP system and the promote the penetration of gas fired distributed power generating system and supported future policy for gas price usage in CHP system in the future.
In Figure 11, for the µ-CHP system with 15-kW and 21-kW capacity, gas engine will operate 24-hr throughout a year in order to minimize the energy cost saving if natural gas price is decrease less than 20 percent. In case of 9-kW µ-CHP capacity, 30 percent for decreasing of natural gas price is considered to operate gas engine machine 24-hr throughout a year, however, if natural gas price is higher than 50%, the machine is going to stop the operation in order to maintain for cost saving criteria. In case of 15-kW and 21-kW of the µ-CHP capacity, operation of gas engine will stop if natural gas price become higher than 70 percent from the current price.
6. Conclusions
In this study, the introduction of micro-cogeneration (µ-CHP) system for typical convenience stores in Thailand has been evaluated. The study case with 188 sq.m.-floor area was considered regarding to store’s energy performance and hourly load profile throughout a year of electric and cooling load. Under the circumstance of electricity and cooling demands, the mathematical model has been developed in order to determining the optimal size of µ-CHP system. According to the analysis in this study the following conclusions can be drawn:
Energy efficiency consideration: selection of µ-CHP capacity of 15 kW is the optimal solution for efficient energy saving concern. However, in order to decentralize power generation from utility grid which is so called “grid independence” pattern, selection of µ-CHP capacity of 18 kW is suitable for this purpose. On the other hand, the consideration of the minimization of waste heat can lead to a decision to select a 9 kW of the µ-CHP system. But in this case, the additional electricity supply for the equipment load from the grid and heat supply from the back-up boiler are needed in order to satisfy the energy need.
Economic consideration: under the present situation of fuel prices for both electricity and gas prices including tariff rates, 15 kW of the µ-CHP capacity is the reasonable solution by the consideration of lowest Cost saving ratio (CSR). However, 12 kW of µ-CHP capacity is also suitable for economic concerns from the payback period calculation results. It is noted that the sensitivity of fuel price and tariff structures either electricity price and natural gas price are the significant factors affecting the selection of optimal sizing for µ-CHP system in order to
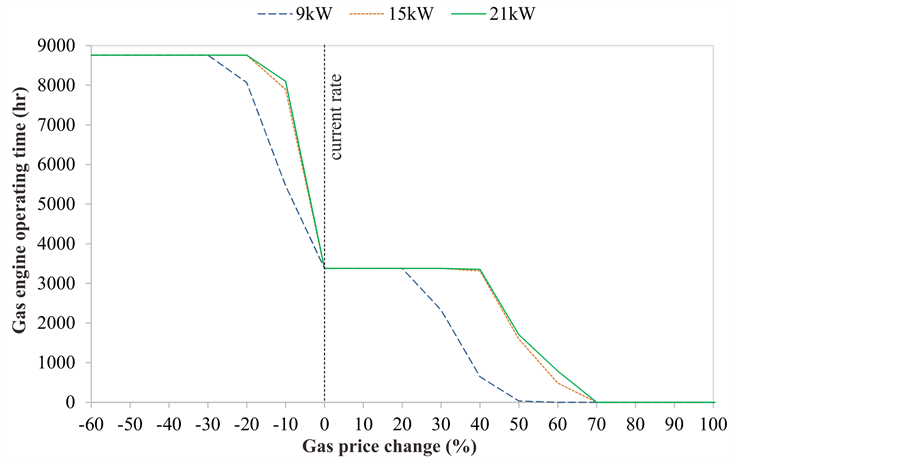
Figure 11. Effect of natural gas price and operating time for gas engine.
achieve the economic benefits. Not only the selection of optimal sizing should be concerned from the fluctuating fuel price, the operation schedules of µ-CHP system also need to be considered.
References
- Rena, H.B., Gaoa, W.J. and Ruanb, Y.J. (2008) Optimal Sizing for Residential CHP System. Applied Thermal Engineering, 28, 514-523. http://dx.doi.org/10.1016/j.applthermaleng.2007.05.001
- Heejin, C., Rogelio, L., Sandra, D.E., Louay, M.C. (2008) Cost-Optimized Real-Time Operation of CHP Systems. Energy and Buildings, 41, 445-451.
- Chris, G. and Jim, F. (2006) Decentralizing Thai Power: Towards a Sustainable Energy System. Greenpeace Southeast Asia, Thailand.
- Joint Graduate School on Energy and Environment (JGSEE) (2006) The Study of Estimated the Quantity of Commercially Viable New CHP System for Factories and Buildings. Energy Policy and Planning Office, Ministry of Energy, Thailand.
- Hueffed, A.K. and Mago, P.J. (2010) Influence of Prime Mover Size and Operational Strategy on the Performance of Combined Cooling, Heating, and Power Systems under Different Cost Structures. Journal of Power and Energy, 224, 591-605. http://dx.doi.org/10.1243/09576509JPE922
- Rusbeh, R. and Reinhard, H. (2012) Optimization of Micro-CHP Systems in Residential Buildings from an Economic and Energetic Point of View. International Journal of Distributed Energy Resources, 8, 217-234.
- Siler-Evans, K., Morgan, M.G. and Azevedo, I.L. (2012) Distributed Cogeneration for Commercial Buildings: Can We Make the Economic Work? Energy Policy, 42, 580-590. http://dx.doi.org/10.1016/j.enpol.2011.12.028
- Sun, Z.-G. (2008) Energy Efficiency and Economic Feasibility Analysis of Cogeneration System Driven by Gas Engine. Energy and Buildings, 40, 126-130. http://dx.doi.org/10.1016/j.enbuild.2007.01.013
- Somcharoenwattana, W., Menke, C., Kamolpus, D. and Gvozdenac, D. (2011) Study of Operational Parameters Improvement of Natural-Gas Cogeneration Plant in Public Buildings in Thailand. Energy and Buildings, 43, 925-934. http://dx.doi.org/10.1016/j.enbuild.2010.12.016
- Sommart, K. and Chullapong, C. (2005) Potential of Cogeneration and Absorption Chiller in a Supercenter Building. The 1st Conference on Energy Network of Thailand, Chonburi, 11-13 May 2005, 244-249.
- Metropolitan Electricity Authority (2013) Medium General Service’s Electricity Tariffs. http://www.mea.or.th/profile/index.php?l=en&tid=3&mid=113&pid=109
- Ruan, Y.J. (2006) Integration Study on Distributed Energy Resource and Distribution System. Ph.D. Thesis, The University of Kitakyushu, Kitakyushu.
- Narita Kenbi (2003) Cogeneration Manual (Japanese Version). Japan Cogeneration Center, Tokyo.